


Abstract
Lysine-specific demethylase 1 (LSD1) stabilizes hypoxia-inducible factor 1α (HIF1α) to advance tumor progression, while HIF1α functions as a transcription factor to increase the expression of microRNA-146a (miR-146a).
We aim to investigate whether LSD1 affects the development of papillary thyroid carcinoma (PTC) via HIF1α and miR-146a.
In vitro assays were performed with Nthy-ori 3-1, BHP5-16, BCPAP, K1, and BHP2-7 cell lines. In vivo assays were conducted with established xenograft tumors in nude mice.
This study was conducted at our lab.
PTC tissues and corresponding adjacent normal tissues were obtained from 45 patients hospitalized in Sun Yat-Sen Memorial Hospital. Assays were conducted using Nthy-ori 3-1, BHP5-16, BCPAP, K1, and BHP2-7 cell lines, as well as 50 male BALB/c nude mice.
Cells were transfected with sh-LSD1, sh-GABPA, oe-LSD1, oe-HIF1α, miR-146a mimic, and miR-146a inhibitor. In addition, K1 cells expressing lv-oe-LSD1, lv-miR-146a inhibitor, lv-oe-LSD1 or miR-146a inhibitor were injected into the right side of the mice. LSD1 gene and protein expression patterns were analyzed in 45 clinical PTC tissue samples.
Expression of LSD1, HIF1α, miR-146a, and GA-binding protein transcription factor alpha (GABPA), as well as their effects on PTC.
LSD1 was highly expressed in clinical PTC tissues. LSD1 stabilized HIF1α and inhibited the degradation of its ubiquitin proteasome. HIF1α was enriched in the promoter region of miR-146a, an upregulated miRNA in PTC. HIF1α increased miR-146a expression to promote PTC progression in vitro, which was achieved by inhibiting GABPA, a target gene of miR-146a. LSD1 upregulated miR-146a to enhance the development and metastasis of PTC in nude mice.
Our results show that LSD1 functions as an oncogene in PTC by upregulating HIF1α and miR-146a, elucidating an understanding of undefined mechanisms associated with tumor progression in PTC.
Differentiated thyroid cancers consist of papillary thyroid carcinoma (PTC) and follicular thyroid carcinoma (1). Most cases of thyroid cancer are small, localized malignancies of papillary origin (2). In the United States from 1974 to 2013, the incidence of thyroid cancer increased by 3% annually (3, 4). Different pathologies are affected by diverse drivers with distinct signaling and differentiation features, characterization of which improves pathological classification and disease management (5). However, the optimal management of new differentiated thyroid cancer cases remains controversial due to the considerable effects on quality of life in patients who suffer from thyroidectomy-associated complications (6). Novel targeted therapies exert great promise in the near future to be included in standard treatment regimens for thyroid carcinomas that are clinically refractory to radioiodine or surgically inoperable (7).
Lysine-specific demethylase 1 (LSD1), also known as KDM1A, is a histone demethylase that mediates methylation of histones H3K4me1/2 and H3K9me1/2. Pharmacological inhibition of LSD1 is proposed to biologically repress tumorigenesis in solid tumors (8, 9). Additionally, LSD1 is associated with the initiation and malignant transformation of PTC and may function as a sensitive molecular marker for the diagnosis of thyroid cancer (10). Interestingly, siRNA-mediated silencing of LSD1 efficiently represses PTC cell proliferation and tumor metastasis (11). LSD1 can epigenetically modulate gene transcription. For instance, LSD1 induces demethylation of hypoxia-inducible factor 1α (HIF1α) at lysine (K) 391, thus impairing ubiquitin-mediated degradation of HIF1α protein, involved in tumor angiogenesis (12). Moreover, inhibition of LSD1 partially rescues the reduced expression of HIF1α and reverses the elevation of genes related to oxidative phosphorylation pathway as well as reduction of genes related to glycolysis pathway (13). Also, LSD1 and HIF1α exert synergistic effect on the maintenance of glycolytic process to facilitate uncontrolled proliferation of pancreatic cancer (14). Furthermore, HIF1α induced by hypoxia positively regulates the expression of microRNA-146a (miR-146a) (15). The hypoxia-response element in the miR-146a promoter can bind to HIF1α and HIF2α, which are both important transcriptional activators of miR-146a (16).
Based on prediction using the mirDIP, TargetScan, and miRWalk databases, GA-binding protein transcription factor alpha (GABPA), an ETS family transcription factor, was a potential target of miR-146a. GABPA, also known as NRF2, may itself play a tumor suppressive role rather than an oncogenic role PTC (17). Hence, we speculated that LSD1 might regulate HIF1α to control the expression of miR-146a, which targets GABPA, thus affecting the progression of PTC. To test this hypothesis, we examined the effects of LSD1 on biological properties and epithelial mesenchymal transition (EMT) of PTC cells as well as tumor formation and metastasis, and we further analyzed the underlying mechanisms regarding HIF1α/miR-146a/GABPA.
Materials and Methods
Ethics statement
All research procedures were conducted with approval of the Ethics Committee of Sun Yat-Sen Memorial Hospital, Sun Yat-Sen University and in line with the Declaration of Helsinki. All patients and/or legal guardians signed the informed consent documentation prior to experiments. All animal experiments were approved by the Animal Ethics Committee of Sun Yat-Sen Memorial Hospital, Sun Yat-Sen University. Great efforts were made to reduce their suffering during the experimental procedures.
Tissue collection and cell culture
PTC tissues and corresponding adjacent normal tissues from 45 patients hospitalized in Sun Yat-Sen Memorial Hospital, Sun Yat-Sen University were immediately stored at −80°C until use. Human thyroid epithelial cell line Nthy-ori 3-1 and human PTC cell lines BHP5-16, BCPAP, K1, and BHP2-7 were purchased from the Cell Bank of Type Culture Collection of Chinese Academy of Sciences (Shanghai, China). All cells were cultured with RPMI-1640 medium supplemented with 10% fetal bovine serum (FBS) and 10% penicillin-streptomycin (all from Gibco, Life technologies, Grand Island, NY) at 37°C with 5% CO2. Cells were detached with 0.25% trypsin and passaged at a ratio of 1:3. The cells were seeded on a 6-well plate (4 × 10⁵ cells/well).
Xenograft tumor in nude mice
Fifty male BALB/c nude mice aged 6 to 10 weeks were commercially available from the Shanghai laboratory Animal Center (Chinese Academy of Sciences, Shanghai, China). Human papillary thyroid carcinoma cell line K1 cells were stably transduced with lentivirus expressing oe-NC (lv-oe-NC), oe-LSD1 (lv-oe-LSD1), inhibitor-NC (lv-inhibitor-NC), or miR-146a inhibitor (lv-miR-146a inhibitor) alone, or co-transduced with lv-oe-LSD1 and miR-146a inhibitor. 100 µL of stably transduced K1 cells (106 cells/mouse) were subcutaneously injected into the right side of the mice. Tumor volume and weight were measured every 7 days and tumor volume was calculated with the formula [volume = 0.5 × length × width2]. After 5 weeks, mice were anesthetized with 2% pentobarbital sodium (30 mg/kg) and euthanized. The tumors were collected and the weight of the tumor was measured. The liver tissues of mice were collected, fixed, and embedded in paraffin.
Terminal deoxynucleotidyl transferase–mediated dUTP-biotin nick-end–labeling (TUNEL) for tissues and cells
Tumor tissue sections of mice were reacted with proteinase K, and stained with TUNEL reaction working solutions at 37°C for 1 hour according to the TUNEL kit (Roche Diagnostics, Basel, Switzerland). The sections were incubated with 3% H2O2/methanol solution for 10 minutes, and then rinsed with phosphate-buffered saline (PBS) 3 times. Next, the sections were incubated with conversion-peroxidase solution at 37°C for 30 minutes, followed by 3 PBS rinses. The sections were developed with diaminobenzidine, and rinsed with PBS again, followed by counterstaining with hematoxylin. TUNEL-positive cells (brown) were observed and counted under light microscopy to calculate the percentage of cell apoptosis as follows: [apoptosis rate = number of positive cells / total cells × 100%].
The cell apoptosis was evaluated using TUNEL Apoptosis Detection Kit (Green Fluorescence; C1088, Beyotime, Shanghai, China). The cells were observed under a fluorescence microscope with the excitation wavelength at 450 nm and the emission wavelength at 550 nm (green fluorescence).
Hematoxylin and eosin (HE) staining
Liver tissues collected from human patients were fixed in 10% neutral formaldehyde solution overnight and embedded with paraffin. The sections were sliced into serial sections, and then dewaxed in xylene, followed by hydration with gradient ethanol. After being rinsed with the tap water for 3 minutes, the sections were stained with hematoxylin for 8 minutes, and rinsed for 5 minutes again. Afterwards, the sections were stained in eosin solution for 2 minutes. Morphological changes of cells were observed under microscope.
Cell transfection
Upon 70% to 80% confluence, the cells were transfected with 10 μg plasmid (final concentration of 50 nM added to the cells) in accordance with instructions of Lipofectamine 2000 (11 668-019, Invitrogen). After transfection, the cells were cultured at 37°C with 5% CO2 and saturated humidity. After 48 hours of transfection, the original medium was renewed using RPMI 1640 medium with 10% FBS for another 24 to 48 hours of culture. The sequences and plasmids purchased from GenePharma (Shanghai, China) for transfection included shRNA targeting LSD1 (sh-LSD1), shRNA targeting GABPA (sh-GABPA), plasmid overexpressing LSD1 (oe-LSD1), plasmid overexpressing HIF1α (oe-HIF1α), miR-146a mimic, miR-146a inhibitor, and their corresponding negative controls (sh-NC, oe-NC, mimic-NC, and inhibitor-NC).
A lentiviral packaging system was constructed using overexpression lentiviral-based LV5-GFP vector and pSIH1-H1-copGFP shRNA vector for gene silencing. The packaged lentivirus and target vectors were co-transfected into 293T cells using Lipofectamine 2000. The supernatant (containing lentivirus particles) was collected after 48 hours of cell culture. Virus titer was determined and the lentivirus in the exponential phase was harvested and designated as lv-oe-NC, lv-oe-LSD1, lv-inhibitor-NC, and lv-miR-146a inhibitor, respectively. The expression efficiency of GFP was observed by fluorescence microscopy 48 hours after infection.
Reverse transcription quantitative polymerase chain reaction (RT-qPCR)
Total RNA from tissues was extracted using TRIzol (Cat. No. 16 096 020, Thermo Fisher Scientific, New York), and 5 μg was reversely transcribed into cDNA according to the cDNA kit (K1622; Fermentas Inc., Ontario, Canada). Using cDNA as a template, real-time qPCR was performed to determine miRNA expression using TaqMan Universal PCR Master Mix in accordance with the specifications of TaqMan MicroRNA Assay protocol.
In addition, real-time qPCR assays performed to determine mRNA expression were based on the instructions of the TaqMan Gene Expression Assays protocol (Applied Biosystems, Foster City, CA). All RT-qPCR was conducted in 3 parallel wells and repeated independently 3 times. Primers designed for qPCR are shown in Table 1. The expression of miRNA normalized to U6 or mRNA normalized to glyceraldehyde-3-phosphate dehydrogenase (GAPDH) was calculated using 2-ΔΔCt method. The formula is as follows: [ΔΔCT = ΔCt experimental group − ΔCt control group, wherein ΔCt = Ct target gene − Ct internal reference].
Primer Sequences for Reverse Transcription Quantitative Polymerase Chain Reaction
| Gene | Primer sequence |
|---|---|
| LSD1 | F: 5’-GAAACTGGAATAGCAGAGAC-3’ |
| R: 5’-GGTGGACAAAGCACAGTATCA-3’ | |
| HIF1α | F: 5’-CTCAAAGTCGGACAGCCTCA-3’ |
| R: 5’-CCCTGCAGTAGGTTTCTGCT-3’ | |
| GABPA | F: 5’-TTTTTCAGCGGGTTCCTCG-3’ |
| R: 5’-GTATTTGGCTGCTTTCGC-3’ | |
| miR-146a | F: 5’-GCGTGAGAACTGAATTCCA-3’ |
| R: 5’-GTGCAGGGTCCGAGGT-3’ | |
| U6 | F: 5’-GCCTTCGGCAGCACATATACTAAAAT-3’ |
| R: 5’-CGCTTCACGAATTTGCGTGTCAT-3’ | |
| GAPDH | F: 5’-CCATGTTCGTCATGGGTGTGAACCA-3’ |
| R: 5’-GCCAGTAGAGGCAGGGATGATGTTG-3’ |
Abbreviations: GABPA, GA-binding protein transcription factor alpha; GAPDH, glyceraldehyde-3-phosphate dehydrogenase; HIF1α, hypoxia-inducible Factor-1α; LSD1, lysine-specific demethylase 1; miR-146a, microRNA-146a.
Western blot analysis
Total protein was extracted using radio-immunoprecipitation assay (RIPA) lysis buffer (Beyotime, Shanghai, China). After polyacrylamide gel electrophoresis (PAGE), the separated proteins were transferred to polyvinylidene fluoride membrane (IPVH85R, Millipore, Darmstadt, Germany), and blocked with 5% bovine serum albumin for 1 hour. The rabbit anti-human antibodies including LSD1 (ab17721, 1:100), HIF1α (ab51608, 1:1000), GABPA (ab224325, 1:100), E-cadherin (ab15148, 1:500), β-catenin (ab2365, 1:500), N-cadherin (ab207608, 1:1000), Vimentin (ab137321, 1:2000), and GAPDH (ab706699, 1:5000) from (Abcam, Cambridge, UK) were utilized as primary antibodies. The membrane was subsequently probed with horseradish peroxidase (HRP)-labeled goat anti-rabbit immunoglobulin G (IgG; ab205718, 1:20 000, Abcam) for 1 hour after TBST washing, followed by developing. Protein quantitative analysis was performed using ImageJ 1.48u software (National Institutes of Health) based on the ratio of gray value of each protein band to that of the GAPDH band.
5-ethynyl-2’-deoxyuridine (EdU) assay
The cells were labeled with EdU medium (100 μL/well) for 2 hours, and then washed with PBS twice. The cells were fixed with 100 μL/well cell fixative (4% paraformaldehyde) for 30 minutes and incubated with 2 mg/mL glycine for 5 minutes. After being washed with 100 μL/well PBS for 5 minutes, the cells were permeabilized with 0.5% Triton X-100 in PBS (100 μL/well) for 10 minutes. The cells were washed with PBS again, followed by 100 μL/well 1× Apollo staining solution in the dark for 30 minutes. The cells were washed with 3 times with 100 μL/well 0.5% Triton X-100 in PBS, 10 minutes each time, 100 μL/well methanol for 5 minutes, and PBS in succession for 5 minutes. The cells were stained with 100 μL/well 1× Hoechst 33 342 reaction solution for 30 minutes, decolorized, and washed 3 times with PBS at 100 μL/well. Anti-fluorescence quenching agents were added at a volume of 100 μL/well after staining. Images were captured under a fluorescence microscope. Cells with nuclei (stained in red) were considered as EdU-positive cells, and the numbers of EdU-positive and EdU-negative cells in each of the 3 randomly selected fields were counted under a microscope. EdU labeling rate (%) = number of positive cells / (number of EdU-positive cells + number of EdU-negative cells) × 100%. Each experiment was repeated independently 3 times.
Scratch test
The cells were seeded in a 6-well plate at a density of 2.5 × 10⁴ cells/cm2, and cultured for 24 hours. The medium was aspirated, and scratches were made using a 10 μL sterile pipette. After being washed twice with PBS, the culture was continued with DMEM medium containing 5% FBS. Images of each well at 0 hours and 24 hours after scratching were captured under an inverted microscope. The width of each scratch was determined using Image J software, and the migration ability of the cells was evaluated by comparing the scratch width among groups. The ratio of scratch wound healing rate = (scratch width at 0 h − scratch width at 24 h) / scratch width at 0 h × 100%. Each experiment was conducted in 3 parallel wells.
Transwell assay
In vitro cell invasion assays were performed in 24-well plates using a polycarbonate membrane Transwell chamber (8 mm pore size; Corning) coated with Matrigel. 600 mL DMEM containing 20% FBS was loaded into the lower chamber and allowed to stand for 1 hour at 37°C. The K1 cell suspension (1 × 10⁶ cells/mL) deprived of serum was cultured in the upper chamber at 37°C with 5% CO2 for 24 hours. The Transwell chamber was fixed in 5% glutaraldehyde at 4°C and stained with 0.1% crystal violet for 5 minutes. The cells passing through the chamber were observed under an inverted fluorescence microscope (TE2000, Nikon, China) in 5 randomly selected fields.
Dual-luciferase reporter assay
The GABPA 3′UTR containing miR-146a binding sites and the mutant dual-luciferase reporter plasmid containing the mutated binding site were constructed, named PmirGLO-GABPA-WT and PmirGLO-GABPA-MUT. The constructed plasmids were co-transfected with miR-146a mimic and mimic NC into 293T cells. The cells were lysed after 24 hours transfection and centrifuged at 12 000 rpm for 1 minute with the supernatant collected. Luciferase activity was measured using a Dual-Luciferase Reporter Assay System, (E1910, Promega, Madison, WI).
Chromatin immunoprecipitation (ChIP)
For detection of enrichment of HIF1α in the promoter region of miR-146a, ChIP experiment was performed using the EZ-Magna ChIP TMA kit (Millipore, Billerica, MA) as previously described (15). The cells were crosslinked with 1% formaldehyde for 10 minutes. The collected cells were resuspended in cell lysis buffer to a final concentration of 2 × 10⁶ cells per 200 mL and mixed with proteinase inhibitor. The cell lysates were sonicated to obtain 200 to 1000 base pair chromatin fragments, which were rotated using 50 × PIC and 60 μL of Protein A Agarose/Salmon Sperm DNA at 4°C for 1 hour. A total of 20 μL supernatant was taken as the Input. The remaining supernatant was coprecipitated with 1 μL of rabbit anti-HIF1α (ab2185, 1:4, Abcam, Cambridge, UK) or 1 μL of rabbit anti-IgG (ab172730, abcam, UK). The DNA-protein complex was captured with 60 μL of Protein A Agarose/Salmon Sperm DNA at 4°C for 2 hours and eluted with 250 mL ChIP Wash Buffer. The DNA was harvested after de-crosslinking with 20 mL of 5 M NaCl. The miR-146a promoter sequence in the complex was detected by real-time PCR.
Co-immunoprecipitation (Co-IP)
The transfected cells were lysed in lysis buffer (50 mM Tris-HCl (pH 7.4), 150 mM NaCl, 10% glycerol, 1 mM EDTA, 0.5% NP-40 and protease inhibitor cocktail) and subjected to centrifugation to remove cell debris. The harvested cell lysate was incubated with 1 lytic anti-HA or anti-FLAG antibody (Sigma-Aldrich, St. Louis, MO) and 15Si protein A/G beads (Santa Cruz Biotechnology Inc., Santa Cruz, CA) for 2 hours. After extensive washing, the beads were boiled for 5 minutes at 100°C. The protein was separated by sodium dodecyl sulfate-PAGE and transferred to a nitrocellulose membrane (Millipore, Temecula, CA, USA), followed by immunoblotting.
Statistical analysis
All data were processed by SPSS 21.0 statistical software (IBM Corp. Armonk, NY). Measurement data were expressed in the form of mean ± standard deviation. The data from cancer tissues and adjacent normal tissues obeying normal distribution were analyzed by paired t test. The skewed data were tested by the nonparametric Mann-Whitney U test. Comparisons between groups were performed using one-way analysis of variance (ANOVA) with Tukey post hoc test. Data at different time points were compared using repeated measures ANOVA. Statistically significant differences were indicated by P < 0.05.
Results
LSD1 promotes malignant potentials of PTC cells
LSD1 is known to be a critical regulator in various human cancers, such as hepatocellular carcinoma, clear cell renal cell carcinoma, and small cell lung cancer (18-20). To investigate the role of LSD1 in PTC, RT-qPCR and Western blot assays were conducted to determine the gene and protein expression pattern of LSD1 in 45 clinical tissue samples of PTC. The results (Fig. 1A and 1B) indicated that LSD1 was upregulated in PTC tissues compared with adjacent normal tissues. We further analyzed the relationship between the high and low expression level of LSD1 protein (the median was used to distinguish the high and low expression) and the clinicopathological data of patients with PTC. The results showed that LSD1 protein was related to the clinical stage and lymph node metastasis (P < 0.05, Table 2). Consistently, RT-qPCR and Western blot analysis also demonstrated that expression of LSD1 in the human PTC cell lines BHP5-16, BCPAP, K1, and BHP2-7 was higher than that in the human thyroid epithelial cell line Nthy-ori 3-1 (Fig. 1C), wherein the K1 cell line exhibited the highest LSD1 expression. Hence, K1 cells were selected for the subsequent in vitro experiments.
Relationship Between the High/Low Expression of LSD1 Protein and the Clinicopathological Data of Patients With PTC
| Case (n) | High LSD1 expression | Low LSD1 expression | P | |
|---|---|---|---|---|
| Age | 0.1503 | |||
| > 45 years | 12 | 8 | 4 | |
| ≤ 45 years | 33 | 14 | 19 | |
| Gender | 0.9365 | |||
| Male | 10 | 5 | 5 | |
| Female | 35 | 17 | 18 | |
| TNM stage | 0.0421 | |||
| I + II | 31 | 12 | 19 | |
| III + IV | 14 | 10 | 4 | |
| Lymph node metastasis | 0.0013 | |||
| Yes | 16 | 13 | 3 | |
| No | 29 | 9 | 20 |

LSD1 promotes proliferation, migration, and invasion of PTC cells. (A) The mRNA expression of LSD1 in clinical PTC tissues and adjacent normal tissues (n = 45) determined by RT-qPCR. (B) Relative protein expression of LSD1 in clinical PTC tissues and adjacent normal tissues (n = 45) measured by Western blot assay. (C) The mRNA expression of LSD1 in human thyroid epithelial cell line Nthy-ori 3-1 and human PTC cell lines determined by RT-qPCR. (D) The mRNA expression of LSD1 in K1 cells transfected with sh-LSD1 or oe-LSD1 determined by RT-qPCR. (E) The protein expression of LSD1 in K1 cells transfected with sh-LSD1 or oe-LSD1 determined by Western blot analysis. (F) Proliferation ability of K1 cells shown by EdU-positive cells after overexpressing or silencing LSD1 (× 200). (G) Scratch test showing migration of K1 cells after overexpressing or silencing LSD1. (H) Invasion of K1 cells assessed by Transwell assay after overexpressing or silencing LSD1 (× 200). (I) The apoptosis of K1 cells assessed by TUNEL after overexpressing or silencing LSD1 (× 200). (J) The expression of EMT-related proteins E-cadherin, β-catenin, N-cadherin and Vimentin measured by western blot assay after overexpressing or silencing LSD1. The data were expressed as mean ± standard deviation, and data between PTC tissues and adjacent normal tissues were analyzed by paired t test, and unpaired data between the 2 groups were analyzed by unpaired t test. The data among groups were statistically analyzed by one-way ANOVA. The experiment was independently repeated 3 times. *P < 0.05.
In order to further examine the effect of LSD1 on PTC cellular behaviors, LSD1 was silenced or overexpressed in K1 cells, the behaviors of which were assessed using EdU, scratch test, Transwell and TUNEL assays. As determined by RT-qPCR and Western blot analysis, the expression of LSD1 was remarkably decreased in the K1 cells transfected with sh-LSD1-1 and sh-LSD1-2, respectively as compared to that in sh-NC-transfected K1 cells, and transfection with oe-LSD1 resulted in higher expression of LSD1 (Fig. 1D and 1E) (Supplementary Figs. 1 and 2) (21, 22). Consequently, the proliferative, migrative and invasive properties of K1 cells transfected with oe-LSD1 were markedly enhanced, but cell apoptosis was reduced. On the contrary, K1 cell proliferating, migrating, and invading capabilities were suppressed by transfection with sh-LSD1-1, and the cell apoptosis rate was increased (Fig. 1F-1I and Fig. 2C-2F) (Supplementary Fig. 1) (21). Next, expression levels of the EMT-related proteins E-cadherin, β-catenin, N-cadherin, and Vimentin were measured by Western blot assay. The results (Fig. 1J) (Supplementary Figs. 1 and 2) (21, 22) showed that LSD1 silencing caused by sh-LSD1-1 led to decreased expression of N-cadherin and Vimentin, and elevated expression of E-cadherin and β-catenin, while overexpression of LSD1 increased expression of N-cadherin and Vimentin, but reduced expression of E-cadherin and β-catenin. Those data together suggested that LSD1 promoted PTC progression in vitro.
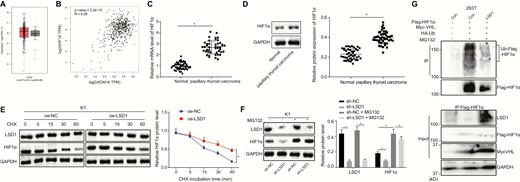
LSD1 inhibits degradation of HIF1α protein to upregulate its expression. (A) Retrieval of HIF1α expression in thyroid cancer in TCGA. The abscissa represents the sample type, the ordinate represents the expression value, the red box diagram represents the tumor sample, and the gray box diagram represents the normal sample. (B) The relationship between LSD1 and HIF1α expression predicted by GEPIA website. (C) The mRNA expression of HIF1α in clinical PTC tissues and adjacent normal tissues (n = 45) determined by RT-qPCR. (D) The protein expression of HIF1α in clinical PTC tissues and adjacent normal tissues (n = 45) measured by Western blot analysis. (E) The protein expression of LSD1 and HIF1α in K1 cells treated with 100 μM CHX measured by Western blot analysis. (F) The protein expression of LSD1 and HIF1α in K1 cells treated with 40 μM MG132 (proteasome inhibitor) measured by Western blot analysis. (G) HIF1α ubiquitination in 293T cells detected by Co-IP after overexpression of LSD1. The data in the figure were all measurement data, which were expressed by mean ± standard deviation. The data in panel 2C conformed to the normal distribution and were analyzed using paired t test, and unpaired data between 2 groups were analyzed by unpaired t test. Data among groups were statistically analyzed by one-way ANOVA. Data at different time points was analyzed by repeated measures ANOVA. The experiment was independently repeated 3 times. *P < 0.05.
LSD1 upregulates the expression of HIF1α by enhancing the stability of HIF1α and inhibiting ubiquitin-proteasome–mediated degradation
LSD1 is known to be involved in tumor angiogenesis and tumor progression by increasing the stability of the transcription factor HIF1α in breast cancer (12). After searching for the expression of HIF1α in thyroid cancer in The Cancer Genome Atlas (TCGA), it was found that its expression was increased in thyroid cancer (Fig. 2A). The Gene Expression Profiling Interactive Analysis (GEPIA) website predicts a positive correlation between LSD1 and HIF1α expression in both normal thyroid and thyroid cancer tissues (Fig. 2B). Hence, this study subsequently investigated whether LSD1 could regulate HIF1α expression in PTC. HIF1α expression was shown to be increased in clinical PTC tissues compared with adjacent normal tissues based on the data collected from RT-qPCR and Western blot analyses (Fig. 2C and 2D). The expression of LSD1 was found to be positively correlated with HIF1α in K1, BHP5-16, BCPAP, and BHP2-7 cells. To further investigate whether the stability of HIF1α is regulated by LSD1, cells were treated with 100 μM cycloheximide (CHX), a protein synthesis inhibitor; subsequent Western blot analysis (Fig. 2E) (Supplementary Fig. 3) (23) showed that prolonged CHX treatment did not affect the expression of LSD1 protein in the oe-LSD1-transfected cells but decreased the protein expression of HIF1α with increasing treatment time. After CHX treatments of the same duration, HIF1α protein expression was increased in the oe-LSD1-transfected cells compared with oe-NC-transfected cells, suggesting that LSD1 could enhance the stability of HIF1α. To further investigate how LSD1 regulated the stability of HIF1α, cells were treated with MG132, a proteasome inhibitor. Western blot analysis (Fig. 2F) (Supplementary Fig. 3) (23) showed that the protein expression of LSD1 was reduced after transfection with sh-LSD1, accompanied by decreased protein expression of HIF1α. After treatment with MG132, LSD1 protein expression was not affected, but the protein expression of HIF1α was noticeably increased. The reduction of HIF1α caused by sh-LSD1 was rescued by treatment with MG132. Hence, LSD1 functioned to inhibit the degradation of HIF1α protein. To analyze whether LSD1 regulated HIF1α protein expression by inhibiting VHL-mediated ubiquitination of HIF1α, 293T cells overexpressing LSD1 were transfected with HA-Ub, Flag-HIF1α, and Myc-VHL and treated with 40 μM MG132 for 48 hours. The ubiquitination level of HIF1α was reduced in the cells overexpressing LSD1 (Fig. 2G). These results revealed that LSD1 increased the stability of HIF1α, and inhibited the degradation mediated by ubiquitination-proteasome, ultimately elevating the expression of HIF1α protein.
HIF1α promotes the progression of PTC in vitro by elevating the expression of miR-146a
HIF1α can mediate cancer progression by upregulating or downregulating miRNA (24, 25). HIF1α acts as a transcription factor to induce miR-146a in monocytes and chondrocytes (15, 16). In the GEO database, the miRNA expression profiling of the microarray GSE113629 was carried out using GEO2R software, from which miR-146a was found to be an upregulated miRNA in PTC (Fig. 3A). Consistent with this finding, RT-qPCR demonstrated that miR-146a was highly expressed in PTC (Fig. 3B). Further analysis of the relationship between high and low expression levels of miR-146a (the median was used to distinguish the high and low expression) and the clinicopathological data of patients with PTC showed that miR-146a was related to the clinical stage and lymph node metastasis (P < 0.05) (Table 3). We found that the expression of miR-146a was positively correlated with LSD1 in PTC tissue (r > 0; P < 0.05) (Fig. 3C). Subsequently, the question of whether HIF1α was enriched in the promoter region of miR-146a was investigated using ChIP. The results of RT-qPCR (Fig. 3D) showed that enrichment of HIF1α was enhanced in the cells transfected with oe-HIF1α. After transfection with oe-HIF1α in K1, BHP5-16, BCPAP, and BHP2-7 cells, the results of RT-qPCR and Western blot analysis demonstrated that the expression of HIF1α was significantly increased. Overexpression of HIF1α resulted in increased expression of miR-146a (Fig. 3E and 3F) (Supplementary Fig. 4) (26), suggesting that HIF1α positively regulated the expression of miR-146a.
Relationship Between the High/Low Expression of miR-146a and the Clinicopathological Data of Patients With PTC
| Case (n) | High miR-146a expression | Low miR-146a expression | P | |
|---|---|---|---|---|
| Age | 0.9284 | |||
| > 45 years | 12 | 6 | 6 | |
| ≤ 45 years | 33 | 16 | 17 | |
| Gender | 0.4254 | |||
| Male | 10 | 6 | 4 | |
| Female | 35 | 16 | 19 | |
| TNM stage | 0.0074 | |||
| I + II | 31 | 11 | 20 | |
| III + IV | 14 | 11 | 3 | |
| Lymph node metastasis | 0.0092 | |||
| Yes | 16 | 12 | 4 | |
| No | 29 | 10 | 19 |
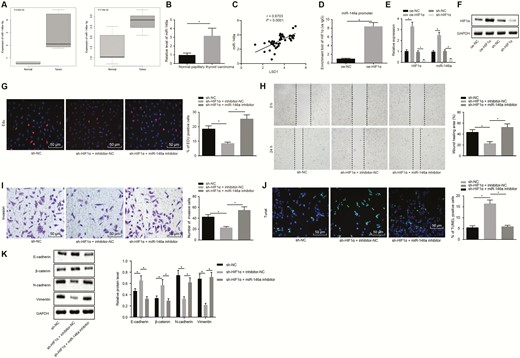
HIF1α promotes the proliferation and migration of PTC cells by increasing the expression of miR-146a. (A) Expression of miR-146a-5p and miR-146a-3p in PTC tissues and normal thyroid tissues based on microarray GSE113629, abscissa indicates sample type. (B) Expression of miR-146a in clinical PTC tissues and adjacent normal tissues (n = 45) determined by RT-qPCR. (C) Correlation between miR-146a and LSD1 determined by Pearson. (D) Enrichment of HIF1α in the promoter region of miR-146a detected by RT-qPCR after ChIP. (E) Expression of HIF1α and miR-146a in K1 cells after transfection with oe-HIF1α determined by RT-qPCR. (F) Expression of HIF1αin K1 cells after transfection with oe-HIF1α determined by Western blot analysis. (G) EdU labeling showing proliferation of K1 cells after inhibition of both HIF1α and miR-146a or either alone (× 200). (H) Scratch test showing migration of K1 cells after inhibition of both HIF1α and miR-146a or either alone. (I) Transwell assay displaying invasion of K1 cells inhibition of both HIF1α and miR-146a or either alone (× 200). (J) TUNEL detection displaying apoptosis of K1 cells after inhibition of both HIF1α and miR-146a or either alone (× 200). (K) Western blot analyses of expression of EMT-related proteins E-cadherin, β-catenin, N-cadherin, and Vimentin in K1 cells after inhibition of both HIF1α and miR-146a or either alone. The data in the figure were all measurement data, which were expressed by the mean ± standard deviation. The data between cancer and adjacent normal tissues in panel B did not conform to the normal distribution and were analyzed using Wilcoxon matched-pairs signed rank test, and unpaired data between 2 groups were analyzed by unpaired t test. Multigroup comparison was conducted using one-way ANOVA. The experiment was independently repeated 3 times. *P < 0.05.
Based on the data from EdU, scratch test, and Transwell assays (Fig. 3G-3J), the proliferative, migrative, and invasive abilities of K1 cells were inhibited and apoptosis was enhanced by shRNA-mediated silencing of HIF1α, while those changes induced by HIF1α silencing were counteracted by inhibition of miR-146a. The expression of EMT-related proteins E-cadherin, β-catenin, N-cadherin, and Vimentin were subsequently measured by Western blot assay. As shown in Fig. 3K, silencing of HIF1α lowered the protein expression of N-cadherin and Vimentin but increased that of E-cadherin and β-catenin. Conversely, the reductions in N-cadherin and Vimentin and increases in E-cadherin and β-catenin caused by HIF1α silencing were neutralized by downregulation of miR-146a. Hence, HIF1α facilitated PTC progression via upregulation of miR-146a.
miR-146a targets GABPA to promote progression of PTC in vitro
To identify the differentially expressed genes (DEGs) in PTC, the mRNA expression profiles (GSE33630 and GSE3467) were analyzed by “limma” package in R language, with |logFC| > 0.5, and P value < 0.01 after correction as the threshold. The analysis of microarray GSE33630 found 1294 upregulated mRNAs and 1252 downregulated mRNAs in PTC as compared to normal thyroids (P < 0.01 after correction) (Fig. 4A). The analysis of microarray GSE3467 displayed 803 upregulated mRNAs and 894 downregulated mRNAs in PTC compared with normal thyroid tissues (P < 0.01 after correction) (Fig. 4B). Using the mirDIP, TargetScan, and miRWalk databases, downstream target genes of miR-146a were predicted, and the predicted target genes were intersected with the downregulated DEGs in microarrays GSE33630 and GSE3467 (Fig. 4C). As a result, there were 11 overlapping genes (FHL1, GABPA, NUS1, etc.). Subsequently, the expression of GABPA was found to be noticeably lower in thyroid cancer than that in normal controls based on the GEPIA website (Fig. 4D). RT-qPCR in this study also confirmed the lower GABPA expression in clinical PTC tissues versus adjacent normal tissues (Fig. 4E). A specific binding region between the GABPA gene sequence and the miR-146a sequence was shown by online analysis at TargetScan database (Fig. 4F). Dual-luciferase reporter assay was used to verify whether GABPA could bind to miR-146a; the luciferase activity of WT-miR-146a/GABPA was reduced by transfection with miR-146a mimic while the luciferase activity of the MUT-miR-146a/GABPA was not affected (Fig. 4G), suggesting that miR-146a could specifically bind to GABPA. The expression of miR-146a was overexpressed or knocked down in K1 cells, and subsequently the expression of GABPA in K1 cells was determined by RT-qPCR and Western blot analysis. GABPA mRNA and protein expression was decreased in the cells transfected with miR-146a mimic (P < 0.05) (Fig. 4H and 4I). On the contrary, the GABPA mRNA expression was increased noticeably by miR-146a inhibitor (P < 0.05). The increased GABPA expression induced by miR-146a inhibitor was markedly reduced by transfection with sh-GABPA. Hence, GABPA expression was downregulated by miR-146a.
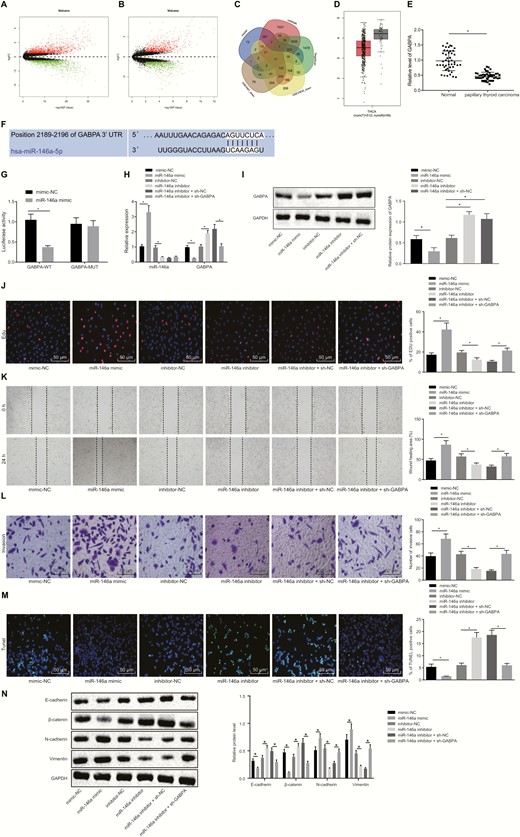
miR-146a targets GABPA to enhance proliferative, migrative, and invasive potentials of PTC cells. (A) The PTC-associated mRNA expression volcano plot of the microarray GSE33630, wherein the black part indicates mRNAs with no significant difference, the green part indicates noticeably downregulated mRNA, and the red part indicates the notably upregulated mRNA. (B) The PTC-associated mRNA expression volcano plot of the microarray GSE3467, the black part indicates mRNAs with no significant difference, the green part indicates noticeably downregulated mRNA, and the red part indicates the notably upregulated mRNA. (C) Intersection of the predicted target genes of miR-146a in the Figure 4 Continued. mirDIP, TargetScan, and miRWalk databases, and downregulated mRNAs in microarrays GSE33630 and GSE3467. (D) GABPA expression in thyroid cancer and normal tissues from GEPIA website. (E) RT-qPCR determination of miR-146a expression in clinical PTC tissues and adjacent normal tissues (n = 45). (F) The binding site of miR-146a to GABPA. (G) The binding relationship between miR-146a and GABPA analyzed by dual-luciferase reporter assay. (H) The expression of GABPA and miR-146a in K1 cells determined by RT-qPCR. (I) The expression of GABPA in K1 cells determined by RT-qPCR and Western blot analysis. (J) EdU-positive cells showing the proliferation of K1 cells (× 200). (K) The migration of K1 cells assessed by scratch test. (L) The invasion of K1 cells evaluated using Transwell assay (× 200). (M) The apoptosis of K1 cells detected by TUNEL (× 200). (N) Expression of EMT-related proteins E-cadherin, β-catenin, N-cadherin and Vimentin measured by Western blot assay. The data in the figure were all measurement data, which were expressed by the mean ± standard deviation. The data between cancer and adjacent normal tissues in panel E did not conform to the normal distribution and were analyzed using Wilcoxon matched-pairs signed rank test, and unpaired data between 2 groups were analyzed by unpaired t test. Multigroup comparison was conducted using one-way ANOVA. The experiment was independently repeated 3 times. *P < 0.05.
Next, the focus was shifted onto the effect of miR-146a-mediated inhibition of GABPA on K1 cellular behaviors. As shown by the data of EdU, scratch test, and Transwell assays in Fig. 4J-4M, upregulation of miR-146a remarkably enhanced cell proliferating, migrative, and invasive properties, but reduced cell apoptosis. However, inhibition of miR-146a resulted in noticeably suppressed cell proliferating, migrating, and invading capabilities and elevated apoptosis rate, but those changes induced by miR-146a inhibitor were reversed by co-transfection with sh-GABPA. As depicted by Western blot assay in Fig. 4N, the expression of N-cadherin and Vimentin was upregulated, and the expression of E-cadherin and β-catenin was noticeably lowered in the cells transfected with miR-146a mimic, the opposite of the changes induced by transfection with miR-146a inhibitor. The reductions in N-cadherin and Vimentin and increases in E-cadherin and β-catenin were normalized by silencing of GABPA. These results collectively suggested that miR-146a facilitated malignant potentials of PTC cells by inhibiting GABPA.
LSD1 accelerates the progression of PTC in vitro by upregulating HIF1α
As the data shown that LSD1 could regulate HIF1α, and HIF1α could bind to the miR-146a promoter region and miR-146a could bind to GABPA, we aim to investigate whether LSD1 could regulate miR-146a and GABPA via HIF1α to mediate PTC progression. The expression of miR-146a was determined by RT-qPCR and Western blot analysis as well as expression of LSD1, HIF1α, and GABPA was determined by RT-qPCR and Western blot analysis when the expression of LSD1 and HIF1α was altered. As depicted in Fig. 5A and 5B, LSD1 was notably downregulated by transfection with sh-LSD1, and HIF1α was noticeably increased by oe-HIF1α. Consequently, miR-146a was notably downregulated by silencing of LSD1, but increased by overexpression of HIF1α. The downregulation of miR-146a caused by LSD1 silencing was reduced by overexpression of HIF1α. The upregulation of LSD1 induced by overexpression of HIF1α was notably downregulated by silencing of LSD1. GABPA was noticeably increased in the cells transfected with sh-LSD1, but remarkably decreased in the cells transfected with oe-HIF1α. The GABPA expression increased by LSD1 silencing was markedly reduced by overexpression of HIF1α, while the GABPA expression reduced by HIF1α overexpression was elevated by LSD1 silencing. The data from Western blot assay (Fig. 5C) showed that E-cadherin and β-catenin expression was noticeably increased, and that of N-cadherin and Vimentin was remarkably decreased after LSD1 silencing, which were all reversed by overexpressing HIF1α. E-cadherin and β-catenin expression was markedly decreased and N-cadherin and Vimentin were notably increased when HIF1α was overexpressed, while those changes induced by HIF1α overexpression were normalized after LSD1 silencing.
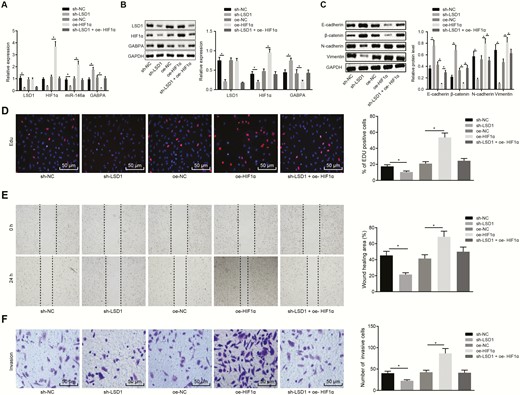
LSD1 enhances the malignant potentials of PTC cells by upregulating the expression of HIF1α. (A) The expression of LSD1, HIF1α, miR-146a and GABPA in K1 cells determined by RT-qPCR. (B) The expression of LSD1, HIF1α, and GABPA in K1 cells determined by Western blot analysis. (C) The expression of EMT-related proteins E-cadherin, β-catenin, N-cadherin and Vimentin measured by Western blot assay. (D) The proliferation of K1 cells assessed by EdU labeling (× 200). (E) The migration of K1 cells assessed by scratch test. (F) The invasion of K1 cells evaluated using Transwell assay (× 200). The data in the figure were all measurement data, which were expressed by mean ± standard deviation. Data among groups were statistically analyzed by one-way ANOVA. The experiment was independently repeated 3 times. *P < 0.05.
Meanwhile, EdU, scratch test, and Transwell assays showed that the numbers of proliferated, migrated, and invaded cells were increased by HIF1α overexpression, but reduced by silencing of LSD1 cells (Fig. 5D-5F). The enhanced malignant potential mediated by oe-HIF1α was suppressed by sh-LSD1. Collectively, the data demonstrated that LSD1 affects the malignant potential of PTC through regulation of the miR-146a/GABPA axis by upregulating HIF1α.
LSD1 promotes the growth and metastasis of PTC in nude mice by upregulating miR-146a
In order to verify in vivo regulation of LSD1/miR-146a/GABPA axis, K1 cells infected with lentiviruses were subcutaneously inoculated into nude mice, and the growth curve of tumors in nude mice was plotted. After 5 weeks, tumors were not successfully formed in 2 mice that received an injection of the cells stably infected with lv-oe-NC, 2 mice injected with cells stably infected with lv-inhibitor-NC, 1 mouse injected with the cells stably infected with lv-oe-LSD1, 1 mouse injected with the cells stably infected with lv-inhibitor-NC, and 3 mice injected with cells stably infected with lv-miR-146a inhibitor. The tumor-bearing mice were euthanized and the tumor growth of mice was assessed. The results (Fig. 6A-6C) showed that the tumor growth was noticeably enhanced by lentivirus-mediated overexpression of LSD1, and reduced by inhibition of miR-146a. The tumor growth enhanced by overexpression of LSD1 was counteracted by inhibition of miR-146a. The TUNEL assay results (Fig. 6D) showed that the apoptosis rate was noticeably increased by inhibition of miR-146a, but reduced by overexpression of LSD1. The apoptosis induced by inhibition of miR-146a was neutralized by overexpression of LSD1. HE staining was performed to assess liver metastasis in nude mice. The liver metastasis was markedly increased in response to LSD1 overexpression, and notably reduced in response to inhibition of miR-146a. Our data also showed that the LSD1-induced liver metastasis was suppressed by lentivirus-mediated inhibition of miR-146a (Fig. 6E). Our results demonstrated that LSD1 accelerated the tumor development and metastasis in vivo by upregulating miR-146a.
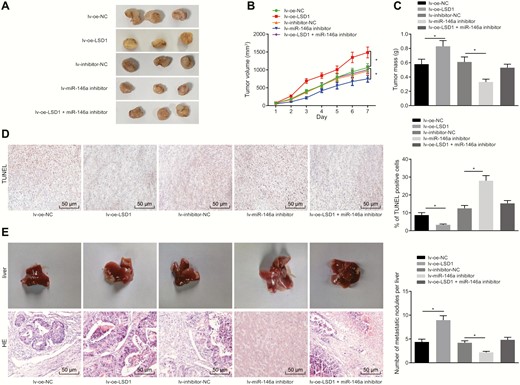
LSD1 promotes the progression and metastasis of PTC in nude mice through increasing miR-146a. (A) Subcutaneous tumor formation in nude mice. (B) Tumor growth curve in nude mice. (C) Tumor weight of nude mice. (D) Cell apoptosis in tumor tissues assessed by TUNEL (× 200). (E) Liver tumor metastasis in nude mice evaluated using HE staining (× 200). The data were measurement data, and analyzed by one-way ANOVA. The tumor volume at different time points was analyzed by repeated measures ANOVA. (n = 7-10). *P < 0.05.
Discussion
PTC, the most common subtype of thyroid cancer, exhibits an almost uniformly good prognosis (27). LSD1 is reported to be an upregulated gene in various cancers, involved in the control of cancer-related biological processes such as proliferation and apoptosis (28). In this study, we tested the role of LSD1 in PTC, and the involvement of molecular mechanisms. Our experimental data confirmed the oncogenic effect of LSD1 on PTC development and metastasis. More importantly, LSD1 upregulated the expression of HIF1α by inhibiting ubiquitin-proteasome-mediated degradation of HIF1α and increased miR-146a expression that negatively mediated GABPA (Fig. 7).
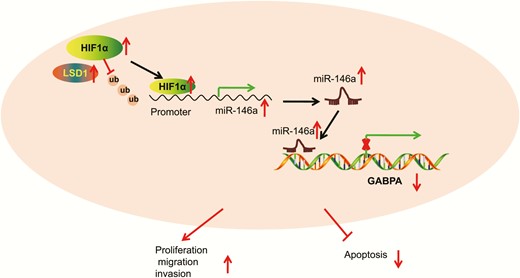
Schematic diagram depicts how LSD1 affects the development and metastasis of PTC. The histone demethylase LSD1 increases the expression of miR-146a by inhibiting the degradation of HIF1α mediated by ubiquitin-proteasome. miR-146a reduces the expression of GABPA, thereby promoting malignant potentials of PTC cells and inhibiting their apoptosis.
First, LSD1 was upregulated in PTC tissues and cell lines. LSD1 are involved in different cancers. For instance, LSD1 acts as a tumor promoter that accelerates migration and invasion and facilitates EMT in gastric carcinoma (29). Deletion of LSD1 in gastric carcinoma impairs tumor formation and delays BCL6-driven lymphomagenesis (30). Also, LSD1 can trigger induction of EMT and lead to metastasis in ovarian cancer (31) and breast cancer (32, 33). siRNA-mediated knockdown of LSD1 impedes cell growth, colony formation, and tumor growth but induces cell apoptosis and enhances chemosensitivity in oral squamous cell carcinoma (34). Depletion of LSD1 also represses cell proliferation and suppresses stem cell properties along with tumor growth in small cell lung cancer (35). LSD1 knockdown reverses the process of EMT by increasing the level of E-cadherin, and downregulating the levels of N-cadherin and Vimentin (36). Our data provides evidence supporting that LSD1 silencing reverses the EMT process through inhibition of N-cadherin and Vimentin, and upregulation of E-cadherin and β-catenin. Consistent with our findings, loss of LSD1 contributed to reduced cell proliferation, tumorigenicity, and invasion (11).
Moreover, the present study identified that LSD1 upregulated the expression of HIF1α by stabilizing HIF1α and inhibiting protein degradation. Histone methylation controls various chromatin-templated processes such as gene transcription. LSD1 can demethylate and stabilize DNA methyltransferase 1 (Dnmt1), while LSD1 knockout in embryonic stem cells contributes to loss of DNA methylation (37). LSD1 might recruit HDAC2 to protect HIF1α against subsequent acetylation-induced degradation, while inhibition of LSD1 may disrupt the glycolysis process that sustains pancreatic cancer malignancies (14). LSD1 knockdown reduces HIF1α expression in hepatocellular carcinoma (HCC) cells and subsequently regulates glycolytic genes (38). Similarly, either pharmacological inhibition or siRNA-mediated silencing of LSD1 expression can decrease HIF1α protein level, which induces glioblastoma cell senescence (39). Our study further demonstrated that HIF1α accelerated the proliferation and migration of PTC cells by upregulating miR-146a.
CoCl2-increased expression of miR-146a can be inhibited by silencing of HIF1α (40). miR-146a is increased in PTC tissues compared with nodular goiter and nonneoplastic thyroid tissues and this increase is positively associated with cervical lymph node metastasis and advanced clinical tumor-node-metastasis (TNM) stages. Enforced expression of miR-146a correlates with carcinogenesis and deterioration of PTC (41), which is partially consistent with our findings. Expression of miR-146a in cancerous tissues is also correlated with the presence of lymph node metastasis. However, inhibition of miR-146a impedes growth and migration of PTC cells (42). Moreover, depletion of miR-146a restrains the oncogenic potential of FRO cells and increased cell apoptosis in anaplastic thyroid carcinomas (43). Upregulation of miR-146a contributes to proliferative, migrating, and invading properties of follicular thyroid carcinoma by inhibiting ST8SIA4 (44). From the data obtained in this study, miR-146a was suggested to promote the progression of PTC in vitro by targeting GABPA. Increasing evidence suggest GABPA as a regulator of tumor development and progression. For example, GABPA suppresses HCC cell migrating and invading potentials partly by upregulating E-cadherin (45). In line with the finding reported by Yuan et al that GABPA suppresses invasion and metastasis of PTC (17), our study suggests an antitumor role of GABPA in PTC.
Conclusion
Taken together, our study demonstrates that LSD1 expedites the development and metastasis of PTC, which is confirmed by in vivo experiments. This study suggests a promising LSD1-targeted therapeutic strategy and also proposes a LSD1-mediated HIF1α/miR-146a/GABPA axis involved in the cancer progression and metastasis, which briefly highlights one of the most important cancer-related molecular mechanisms. Despite siRNA-mediated silencing of LSD1, other available LSD1 inhibitors are expected to be identified for cancer therapy.
Abbreviations
- CHX
cycloheximide
- DEG
differentially expressed gene
- EdU
5-ethynyl-2’-deoxyuridine
- EMT
epithelial mesenchymal transition
- FBS
fetal bovine serum
- GABPA
GA-binding protein transcription factor alpha
- GAPDH
glyceraldehyde-3-phosphate dehydrogenase
- HE
hematoxylin and eosin
- HIF1α
hypoxia-inducible factor 1α
- LSD1
lysine-specific demethylase 1
- miR-146a
microRNA-146a
- PBS
phosphate-buffered saline
- PTC
papillary thyroid carcinoma
- RT-qPCR
reverse transcription quantitative polymerase chain reaction
- TUNEL
Terminal deoxynucleotidyl transferase–mediated dUTP-biotin nick-end–labeling
Acknowledgments
The authors declare that they have no conflict of interest.
Financial Support: This study was supported by Natural Science Foundation of Guangdong Province (No. 2018A030313837).
Additional Information
Disclosure Summary: The authors sincerely appreciate all members who participated in this work.
Data Availability: The datasets generated during and/or analyzed during the current study are not publicly available but are available from the corresponding author on reasonable request.
References
Author notes
These authors are regarded as co-first authors.
