


Abstract
To date, the effect of positive family history as a risk factor of primary aldosteronism (PA) is largely unknown. Studies have failed to distinguish the heritability of PA as well as the associations between positive family history of PA and clinical outcomes.
We quantified the prevalence, the extent of familial aggregation, the heritability of PA among family members of patients with PA, and the association between positive PA family history and major cardiovascular events (MACE).
Using the Taiwan National Health Insurance Database, 30 245 077 National Health Insurance beneficiaries (both alive and those deceased between January 1, 1999, and December 31, 2015) were identified.
We identified 7902 PA patients. Forty-four had PA (0.3%) among 10 234 individuals with affected parents, 2298 with affected offspring, 1924 with affected siblings, and 22 with affected twins. A positive family history was associated with the adjusted relative risk (RR) (95% confidence interval [CI]) of 11.60 (7.63–17.63) for PA in people with an affected first-degree relative. In subgroup analysis, the risk for PA across all relationships (parent, siblings, offspring, and spouse) showed highly significant differences to PA without family history. The accountability for phenotypic variance of PA was 51.0% for genetic factors, 24.9% for shared environmental factors, and 24.1% for nonshared environmental factors. PA patients with an affected first-degree relative were associated with an increased risk for composite major cardiovascular events (RR 1.31; 95% CI 1.24–1.40, P < .001) compared with PA patients without family history.
Familial clustering of PA exists among a population-based study, supporting a genetic susceptibility leading to PA. There is increased coaggregation of MACE in first-degree relatives of PA patients. Our findings suggest a strong genetic component in the susceptibility of PA, involving different kinships.
Primary aldosteronism (PA), that is, autonomous aldosterone hypersecretion, is noted in 3.9% of stage 1 hypertension patients, and that percentage increases to 11.8% in stage 3 hypertension patients (1). PA patients have an increased rate of cardiovascular events (2) and metabolic syndrome, in addition to hypertension (3). While the vast majority of PA patients exhibit a sporadic form, 1.2% to 6% of PA patients carry a familial disease (4–6). The spectrum of PA has been expanded further by the study of familial varieties (7), in which family screening efforts have permitted the recognition of earlier, sometimes even preclinical, stages of disease (8).
Five forms of sporadic familial hyperaldosteronism (FH) have been reported to date (FH-I to FH-IV) (9), together with the genetic disease of PASNA (primary aldosteronism with seizures and neurologic abnormalities) syndrome (10). FH-I (OMIM #103900, GRA, glucocorticoid remediable aldosteronism), caused by gene duplication due to an unequal crossing over, was the earliest identified subtype of PA (11). FH-II is indistinguishable from sporadic PA and represents the most frequent cause of inheritable hypertension in adulthood. Recently, a gain-of-function mutation in the CLCN2 chloride channel gene that causes early onset of FH-II with CLCN2 mutations was identified (12). FH-III (OMIM #613677), with KCNJ5 germline mutations, affects <1% of patients with PA (13). FH-IV is (OMIM #617027) caused by germline mutations in the CACNA1H gene located on chromosome 16p13 (14). PASNA (OMIM #615474), gain-of-function mutations in the CACNA1D gene located on chromosome 3p14.3, is a clinical syndrome characterized by hyperaldosteronism and neurological symptoms (10).
Due to the relatively high prevalence of PA, the Endocrine Society guideline recommends that all hypertensive first-degree relatives of PA patients should undergo screening tests (15, 16). Identification of familial aldosteronism is important because further diagnostic workup could be avoided, along with repeated medical imaging studies, including adrenal vein sampling. Recent studies have failed to distinguish the environmental and shared genetic contribution of PA, let alone the clinical outcomes of PA with familial history (17). Therefore, a high-quality large-scale study about familial heritability of PA would shed light on the contribution of genetic influences on PA susceptibility, and its results could be useful for genetic counseling and outcome evaluation.
We conducted a population-based study including nearly the entire 23 million population of Taiwan (2015) (18–20). Using genealogy and linked health information derived from a comprehensive database, we ascertained familial clustering of PA by calculating the risks of PA and also identified cardiovascular events among these individuals according to specific affected kinship, and assessed the relative contribution of genetic, and shared versus unshared environmental factors. We also examined the risk of MACE associated with a family history of PA.
Patients and Methods
PA identification
Our study used the Taiwan National Health Insurance (NHI) database (23.12 million insured population in 2015) to reconstruct nationwide genealogy and to identify all patients who had a diagnosis of PA from January 1, 1999, to December 31, 2015. We used a validated algorithm to identify PA patients (International Classification of Diseases 9th version, ICD-9 code: 255.11 and 255.12) (21). We only enrolled patients who used mineralocorticoid receptor antagonists (belonging to the Anatomical Therapeutic Chemical classification system, class C03D), because this additional condition assured high values for both sensitivity and positive predictive value (21, 22).
The methods of genealogy reconstruction using recorded family relationships in the NHI database have been described previously (18, 19). Briefly, the NHI database records family relationships as part of an administrative process to calculate insurance premiums. An indirect linking of recorded family relationships allows accurate genealogy reconstruction. The definition of family was a cluster of individuals who were related to each other by blood or by at least 1 common blood relative.
The extent of familial coaggregation with MACE in the families affected by PA was estimated using a marginal Cox proportional hazards regression model with an equal follow-up time. All subjects were adjusted for age, sex, place of residence, income level, occupation, and family size. The relative risks (RRs) were estimated as the adjusted prevalence ratio of the MACE between PA individuals with a first-degree relative having PA and those PA patients without a family history.
Comorbidities.
MACE was defined as the incidence of major cardiovascular events that include nonfatal myocardial infarction (MI), coronary artery bypass graft (CABG), nonfatal stroke, and positive findings in coronary angiography (23). The ICD-9 code for MI at hospitalization had high accuracy, as validated by previous research (24). The records of CABG and angiography were also very reliable because they were constructed on the basis of NHI procedure codes that are tied to the NHI reimbursement system, which is audited regularly. The diagnosis of stroke was an outcome of interest with proofs from both radiographic images and ICD-9 diagnosis code in this study and has been well validated (20, 25).
Ethics
This study has been approved both by the Institutional Review Board of the Chang Gung Memorial Hospital and the data holder of the NHI database. The NHI database was fully encrypted to allow confidentiality protection and all data can only be accessed in the specific computer center operated by the Administration of National Health Insurance. Patient consents were exempted.
Statistics
The prevalence of PA was calculated for the general population and for individuals with an affected first-degree relative as of December 31, 2015. We calculated the RR of PA as the adjusted prevalence ratio between first-degree kinship of an individual with PA and the general population (26). The RRs were calculated for individuals with an affected first-degree kinship and for individual first-degree relatives (parents, offspring, and siblings) and spouses (27).
Heritability is the phenotypic (observable) variation in a population that is attributable to individual genetic differences. Familial transmission was defined as a measure of the combined contribution of genetic and environmental factors to susceptibility to PA. The standard ACE model (additive genetic, common environmental factors shared by family members, and nonshared environmental factors) was applied and has been described previously (28, 29). Spouses were used as controls to estimate the contribution of shared environmental factors to the phenotypic variance, assuming that they shared the family environment with no close genetic relationship and the differences in liability threshold between siblings and spouse contributed to heritability. However, parents and offspring also share environmental factors and also share a similar genetic background.
The liability of PA for the affected individuals was greater than the critical threshold (threshold liability model), the value of which could be determined from the prevalence of PA among the affected and general populations (30).
The analyses were performed using statistical software (SAS, version 9.3; SAS Institute Inc). Two-sided P = .05 was considered statistically significant.
Results
Prevalence of PA among patients with affected first-degree family members vs the general population
Among all the 30 245 077 NHI beneficiaries (both alive and deceased between January 1, 1999, and December 31, 2015), 8 936 483 individuals who were registered without any identifiable relatives were excluded in 2015. There were 24 349 599 individuals classified into 4 373 116 families in 2015, with an average family size of 5.79 persons. Among them, there were 21 080 728 parent–child relationships, 15 802 182 full sibling pairs, and 285 736 twin pairs were identified.
We identified 7902 patients as having PA, giving a crude prevalence of PA among 0.03% of the general population. Women had a significantly higher prevalence (0.035%) than men (0.030%), with a female to male ratio of 1.2:1 (Table 1).
Baseline characteristics of individuals with affected first-degree relatives with pa and the general population.
| Women | Men | |||||
|---|---|---|---|---|---|---|
| ≥1 Affected Relative | General population | P | ≥1 Affected Relative | General population | P | |
| No. | 6939 | 12262442 | 7527 | 12087157 | ||
| Age, mean (SD), years | 36.1 (18.9) | 40.3 (21.0) | <.0001 | 34.8 (17.3) | 38.9 (20.9) | <.0001 |
| PA, n (%) | 21 (0.30) | 4301 (0.04) | <.0001 | 23 (0.31) | 3601 (0.03) | <.0001 |
| Place of residence, n (%) | <.0001 | <.0001 | ||||
| Urban | 5019 (72.33) | 77 33 956 (63.07) | 5286 (70.23) | 7308878 (60.47) | ||
| Suburban | 1598 (23.03) | 3 621 892 (29.54) | 1893 (25.15) | 3848284 (31.84) | ||
| Rural | 304 (4.38) | 871 433 (7.11) | 333 (4.42) | 895513 (7.41) | ||
| Unknown | 18 (0.26) | 35 161 (0.29) | 15 (0.2) | 34482 (0.29) | ||
| Income levels, No. (%) | <.0001 | <.0001 | ||||
| Quintile 1 | 1092 (15.74) | 2 060 626 (16.8) | 1267 (16.83) | 2310294 (19.11) | ||
| Quintile 2 | 923 (13.3) | 1 837 544 (14.99) | 913 (12.13) | 1506339 (12.46) | ||
| Quintile 3 | 1690 (24.36) | 3 655 373 (29.81) | 1776 (23.6) | 3206535 (26.53) | ||
| Quintile 4 | 1636 (23.58) | 2 409 990 (19.65) | 1556 (20.67) | 2240937 (18.54) | ||
| Quintile 5 | 1596 (23) | 2 296 692 (18.73) | 2012 (26.73) | 2821233 (23.34) | ||
| Unknown | 2 (0.03) | 2217 (0.02) | 3 (0.04) | 1819 (0.02) | ||
| Occupation, No. (%) | <.0001 | <.0001 | ||||
| Dependents of the insured individuals | 2539 (36.59) | 4 531 055 (36.95) | 2310 (30.69) | 3746218 (30.99) | ||
| Civil servants, teachers, military personnel and veterans | 286 (4.12) | 343 648 (2.8) | 439 (5.83) | 570777 (4.72) | ||
| Non-manual workers and professionals | 2447 (35.26) | 3 641 661 (29.7) | 2841 (37.74) | 3933917 (32.55) | ||
| Manual workers | 1062 (15.3) | 2 606 844 (21.26) | 1135 (15.08) | 2285790 (18.91) | ||
| other | 605 (8.72) | 1 139 234 (9.29) | 802 (10.65) | 1550455 (12.83) | ||
In the general population of Taiwan in 2015, a total of 14 466 individuals had at least 1 first-degree relative with PA: 10 234 with affected parents, 2298 with affected offspring, 1924 with affected siblings, and 22 with affected twins. Among the individuals with affected family members, 44 had PA, giving a prevalence of 0.3% among PA patients. For individuals with affected first-degree relatives with PA, the prevalence of PA was significantly higher than the age-specific PA prevalence in the general population; interestingly there were 2 peaks in their age of diagnosis among these PA patients with an affected relative (Fig. 1 and ref. (31); all supplementary material and figures are located in a digital research materials repository).
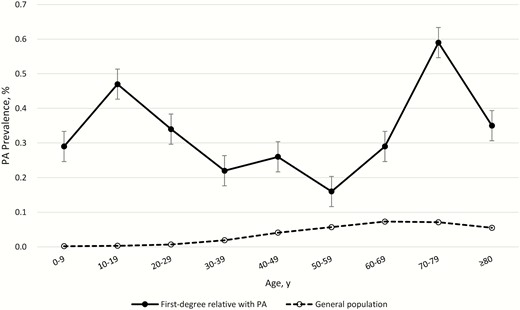
Age-specific prevalence of primary aldosteronism (PA) in individuals with a first-degree relative with PA and the general population in Taiwan in 2015.
RRs for PA in individuals with affected first-degree relatives
Stratified analysis of the prevalence (RR) of PA in individuals with affected first-degree relatives of specific types is presented in Table 2. Overall, having an affected first-degree relative with PA was associated with an adjusted RR (95% CI) of 11.60 (7.63–17.63). The relative risks for PA in PA patients with an affected first-degree relative compared with those without family history in terms of age showed young patients were more likely to have PA (Fig. 2). We further showed the positive exposure–response relationship between the number of affected first-degree relatives and relative risk of having PA (see ref. (31)).
Relative risks for pa in first-degree relatives.
| Type of affected relative | Sex of affected relative | Sex of individual | No. of cases | Prevalence (%) | Relative risks (95% confidence intervals)a |
|---|---|---|---|---|---|
| Any | Male | Male | 15 | 0.42 | 17.53 (8.71–35.29)* |
| Female | 8 | 0.24 | 8.38 (4.20–16.73)* | ||
| All | 23 | 0.34 | 12.72 (7.61–21.27)* | ||
| Female | Male | 8 | 0.2 | 8.13 (4.08–16.22)* | |
| Female | 13 | 0.36 | 12.94 (5.77–29.00)* | ||
| All | 21 | 0.27 | 10.56 (6.01–18.55)* | ||
| All | Male | 23 | 0.31 | 12.52 (7.49–20.93)* | |
| Female | 21 | 0.3 | 10.73 (6.11–18.85)* | ||
| All | 44 | 0.3 | 11.60 (7.63–17.63)* | ||
| Parent | Male | Male | 3 | 0.12 | 7.66 (2.48–23.70)* |
| Female | N/A | N/A | N/A | ||
| All | 3 | 0.07 | 4.25 (1.37–13.15)* | ||
| Female | Male | 4 | 0.13 | 6.65 (2.50–17.67)* | |
| Female | 3 | 0.12 | 6.41 (2.07–19.79)* | ||
| All | 7 | 0.12 | 6.53 (3.12–13.67)* | ||
| All | Male | 7 | 0.13 | 7.05 (3.37–14.74)* | |
| Female | 3 | 0.06 | 3.83 (1.24–11.84)* | ||
| All | 10 | 0.1 | 5.63 (3.04–10.43)* | ||
| Offspring | Male | Male | 4 | 0.76 | 12.62 (4.76–33.47)* |
| Female | 4 | 0.52 | 7.64 (2.88–20.29)* | ||
| All | 8 | 0.62 | 9.55 (4.80–19.01)* | ||
| Female | Male | N/A | N/A | N/A | |
| Female | 3 | 0.5 | 7.04 (2.27–21.82)* | ||
| All | 3 | 0.3 | 4.42 (1.43–13.66)* | ||
| All | Male | 4 | 0.43 | 7.03 (2.64–18.68)* | |
| Female | 7 | 0.51 | 7.39 (3.53–15.47)* | ||
| All | 11 | 0.48 | 7.27 (4.04–13.09)* | ||
| Sibling | Male | Male | 8 | 1.43 | 55.26 (20.72–147.37)* |
| Female | 4 | 0.88 | 33.91 (12.63–91.05)* | ||
| All | 12 | 1.18 | 45.48 (21.87–94.60)* | ||
| Female | Male | 4 | 0.83 | 31.32 (11.72–83.70)* | |
| Female | 7 | 1.63 | 64.70 (20.35–205.78)* | ||
| All | 11 | 1.21 | 46.44 (20.49–105.26)* | ||
| All | Male | 12 | 1.16 | 44.13 (21.22–91.76)* | |
| Female | 11 | 1.24 | 48.68 (21.47–110.36)* | ||
| All | 23 | 1.2 | 46.00 (25.30–83.62)* | ||
| Spouse | All | All | 13 | 0.31 | 5.33 (2.67–10.62)* |
*, P < .05.

The relative risks for primary aldosteronism (PA) in PA patients with an affected first-degree relative compare to those without family history in terms of age.
The RRs (95% CIs) for PA were associated with the degree of genetic distance between family relatives, with values of 46.00 (25.30–83.62) for siblings (with the highest genetic similarity), 5.63 (3.04–10.43) for parents, 7.27 (4.04–13.09) for offspring, and 5.33 (2.67–10.62) for spouses without genetic similarity.
Familial resemblance and heritability of PA
Using a threshold liability model, we estimated accountability for phenotypic variance of PA of 51.0% for genetic factors (heritability), 24.9% for shared environmental factors, and 24.1% for nonshared environmental factors. Therefore, familial transmission of PA patients with positive familial aggregation was 75.9%.
MACE
The prevalence and relative risk of MACE in relatives of patients with PA, as well as the relative contributions of heritability and shared/nonshared environmental factors to PA susceptibility or predisposition. PA patients with first degree relatives also with PA were associated with increased composite MACE (RR, 1.31; 95% CI, 1.24–1.40, P < .001) compared with those PA patients without a positive family history (Table 3).
Relative risks of major cardiovascular events (MACE) in first-degree relatives of patients with primary aldosteronism.
| Type of affected relative | Sex of individual | No. of cases | Prevalence (%) | Relative risks (95% confidence intervals)a |
|---|---|---|---|---|
| MACE | Male | 448 | 5.95 | 1.29 (1.19–1.40)* |
| Female | 397 | 5.72 | 1.32 (1.21–1.43)* | |
| All | 845 | 5.84 | 1.31 (1.24–1.40)* |
| Type of affected relative | Sex of individual | No. of cases | Prevalence (%) | Relative risks (95% confidence intervals)a |
|---|---|---|---|---|
| MACE | Male | 448 | 5.95 | 1.29 (1.19–1.40)* |
| Female | 397 | 5.72 | 1.32 (1.21–1.43)* | |
| All | 845 | 5.84 | 1.31 (1.24–1.40)* |
Discussion
From this study including more than 23 million people, we reported that first-degree relatives of those with PA have an 11.6-fold increased risk of PA compared with the general population, and that genetic relatedness is associated with the magnitude of risk of PA. Genetic and shared environmental factors play a major role (more than three- quarters) in the phenotypic variance for susceptibility to PA. The prevalence of PA was constantly higher in patients with a positive family history of PA throughout all ages than in those without a family history. More importantly, a positive family history of PA was associated with an increased risk of MACE relative to those PA patients without family history. There are both genetic and shared environmental factors contributing to familial aggregation.
Determinants of hypertension severity may include patient gender, gender of affected parent, degree of hybrid gene expression, and interactions with other genetic and environmental factors (8). The magnitude of the RR was associated with the genetic distance of the affected kinship, with siblings having the highest RR of 45.5 and spouse risk of 5.33 (shared environmental factor). These findings support the existence of a familial aggregation of PA coming from genetic factors and the shared environmental factors including the presentation of PA. Notably, the variability in clinical presentation of FH-I may be related to other hereditary factors that regulate blood pressure or environmental factors such as variations in dietary sodium intake (32). Finally, strong familial aggregation in PA has been reported (33, 34), but to the best of our knowledge, this is the first population-based study investigating the familial aggregation of PA while taking environmental factors into consideration.
Our results showed that gender did not attribute to different family risk; however, there is a slightly stronger male transmission. The presence of such an effect supports that PA is a multifactorial threshold model of inheritance in terms of the Carter effect (35).
The age-specific prevalence of familial aggregation in PA is constantly higher than in those with essential hypertension (EH). Specifically, there is mildly increased prevalence in younger and older patients. Recently, familial aldosteronism was found in the differential diagnosis of hypertensive monozygotic twins with early-onset hypertension (34). In contrast to sporadic PA, arterial hypertension in an autosomal dominant trait of FH-I that typically manifests at an early age (32). The prevalence of hypertensive children is as high as 3.1% with a variety of presentations (36). Furthermore, FH-II relatives with early-onset PA carrying the CLCN2 variant were also found in the early proband (12). Interestingly, FH-III is characterized by severe hypertension in early childhood associated with marked hyperaldosteronism (37). On the other hand, second-hit mutations in tumor nodules from familial bilateral macronodular adrenal hyperplasia kindreds with ARMC5 mutations are reported at older ages (38).
We found that only approximately 24.1% of the phenotypic variance was due to nonshared environmental factors. Compared with a 44% genetic contribution of the phenotypic variance in systemic lupus erythematosus (27), and 19.9% of atrial fibrillation (18), we identified 75.9% of familial transmission in PA. Therefore, our findings support that familial factors are predominant contributors to PA susceptibility.
Heritability in this study was estimated to be 51% among PA patients with family history, which is significantly higher than previous estimates of 38.1% about the aldosterone and renin ratio (ARR). ARR is used to screen for hyperaldosteronism. However, neither of the previous studies focus on PA patients nor identifies shared familial contributions to the risk of PA (17, 39). Indeed, in the Framingham Heart Study of aldosterone heritability levels, the proportion of variation in the population that is related to genetic differences was 11% and that of renin and ARR was 22% and 40% respectively (39). Overall, a higher percentage of patients with sporadic PA or low renin essential hypertension may have genetic alterations similar to the hereditary of familial PA.
Although recent efforts using genome-wide association studies have identified more than 10 susceptibility loci for PA, this explains only a small proportion of familial clustering. The “phantom heritability” of PA may be attributed to previous studies generally crediting this apparent gap to (1) undiscovered genetic variances, (2) a heritable epigenetic missing heritability or structural variation (40), and (3) genetic interactions among known or undiscovered loci (41). Furthermore, the currently missing heritability for disease could be due to rare variants (42). Therefore, our estimate of heritability could partly explain inflated estimates of phenotypic variance shown by the genetic data.
MACE
Our results showed that patients having PA with an affected first-degree relative with PA had a higher risk of a MACE than PA patients without familial history. PA patients showed an increased prevalence of coronary artery disease, nonfatal MI, heart failure arrhythmias, stroke, heart failure, and metabolic syndrome (3, 43, 44). In regard to MACE, our study strengthen the recommendation of the guidelines to screen all first-degree familial relatives of PA patients (15). A high plasma aldosterone level still has been shown to lead to a substantial risk of cardiovascular disease, including fatal stroke and sudden cardiac death, compared with patients with EH (45). FH-I/GRA patients display higher morbidity and mortality from cerebrovascular events and have increased risk of pre-eclampsia (46). Patients with GRA usually present hypertension in the first 2 decades of their lives, and show high levels of hybrid steroids (47). Given that it results in more than half of the genetic contribution of the phenotypic variance of PA, gene heritability could also play an important role in the familial aggregation of MACE. Further research should be conducted to study the PA role of disease causation. Our findings further suggest that PA patients with a family history should be irrelevant in choosing the management strategies for PA in terms of cardiovascular events prevention.
Study limitations.
There were still several limitations to our study. First, the diagnosis of PA, EH, and the morbidities were identified by validated ICD-9-CM codes and use of mineralocorticoid receptor antagonists. PA is underdiagnosed in the general population. Hypertensive spouses and first-degree relatives of PA patients may be more often screened for PA than hypertensive patients without family history. In this case they would be diagnosed more frequently but with a milder form of PA. Such a detection bias could explain the higher incidence of PA among PA relatives but not the higher cardiovascular risk in these patients. Because the use of medication is reimbursed by the insurance and routinely audited by the insurance administration and peer audits, this additional condition assured high values for both sensitivity and positive predictive value (48). However the prevalence of PA could be underestimated and must be interpreted with caution, because not all patients underwent adrenal venous sampling. Second, a limited number of twins and zygosity of twins are not recorded in the database; therefore, we cannot estimate heritability using a classic twin study design. The lower estimates may reflect the diverse environments (including diagnostic interpretation) that contribute to national data, compared with twin/family studies (49). Third, because we estimated heritability using the threshold liability model, the results are subject to the assumption that diseases result from underlying liability that is normally distributed in the population. Nevertheless, although this estimation is a potential admonition, data on other diseases such as schizophrenia support the validity of this model (49). Fourth, the NHI Database did not contain information on several factors, including body mass index, nutritional status, and laboratory findings in regard to MACE. Fifth, we studied only the Taiwanese population, and additional studies in other populations are required to clarify the generalizability of our observations.
Little is known about the clinical outcome of familial aggregation of PA. Our findings support the existence of a familial aggregation of PA coming from genetic factors and the shared environmental factors including the presentation of PA. Genetic and shared environmental factors play a major role (more than three-quarters) in the phenotypic variance for susceptibility to PA. The prevalence of PA was constantly higher in patients with a positive family history of PA throughout all ages than in those without a family history. Therefore, all hypertensive first-degree relatives of PA patients should undergo a screen test, and once PA is diagnosed, he/she should receive targeted treatments. Furthermore, given this patient’s young age and family history of early onset hypertension and possible MACE, the heritable cause of PA should be considered, and a genetic diagnosis would implicate screening and treatment of potentially affected family members.
Conclusions
Familial aggregation of PA was supported in this study, as we have shown that those with a positive family history of PA have a significantly higher PA prevalence than those with general hypertension. More specifically, genetic factors seemed to have a stronger contribution to the phenotypic variance of PA than shared environmental factors. Age at onset of PA in patients having a first-degree relative with PA was consistently higher than in PA patients not having a first-degree relative with PA. There was increased co-aggregation of MACE in first-degree relatives of people with PA. These findings suggest a strong genetic component in the susceptibility of PA, involving different kinships, and provide valuable information for future studies on genetic and familial risks of PA.
Abbreviations
- ARR
aldosterone and renin ratio
- CABG
coronary artery bypass graft
- CI
confidence interval
- FH
familial hyperaldosteronism
- GRA
glucocorticoid remediable aldosteronism
- MACE
major cardiovascular events
- MI
myocardial infarction
- PA
primary aldosteronism
- PASNA
primary aldosteronism with seizures and neurologic abnormalities
- RR
relative risk
Acknowledgments
The authors thank Mr. Eric B. Chueh of Case Western University, Cleveland, Ohio, USA for English editing.
Financial Support: The authors wish to acknowledge the support of the Maintenance project for the Center for Big Data Analytics and Statistics (Grant CORPG3G072, CMRPG3G1401, CORPG3G0231, CMRPG3F0833, CMRPG3H1391, CMRPG3J0031, CORPG3G0721, CORPG3H0071, CORPG3J0191, CORPG3J0201, CORPG3G0161), from Chang Gung Memorial Hospital for study design and monitoring, analysis, and interpretation of data. Part of the data was obtained via the Applied Health Research Data Integration Service from the National Health Insurance Administration. This study was further supported by the Taiwan National Science Council (106-2314-B-002 -166 -MY3, 107-2314-B-002 -026 -MY3, 104-2314-B-002-125-MY3), National Taiwan University Hospital (106-FTN20, 106-P02, UN106-014, 106-S3582, 105-P05, VN105-04, 105-S3061, VN104-07, 108-S4231), and Ministry of Science and Technology (MOST) of the Republic of China (Taiwan) (grant number, MOST 106-2321-B-182-002).
Membership of the Taiwan Primary Aldosteronism Investigation (TAIPAI) Study Group: Tai-Shuan Lai; Shao-Yu Yang; Kao-Lang Liu; Chin-Chen Chang; Bo-Chiag Lee; Shuo-Meng Wang; Kuo-How Huang; Po-Chih Lin; Yen-Hung Lin; Lian-Yu Lin; Shih-Cheng Liao; Ruoh-Fang Yen; Ching-Chu Lu (National Taiwan University Hospital, Taipei, Taiwan); Chieh-Kai Chan (NTUH Hsin-Chu branch, Hsin-Chu, Taiwan); Leay-Kiaw Er; Ya-Hui Hu; Chia-Hui Chang; Che-Hsiung Wu; Yao-Chou Tsai (Taipei Tzu Chi Hospital, Taipei, Taiwan); Shih-Chieh Jeff Chueh (Cleveland Clinic Institute of Urology and Kidneys, Ohio, USA); Chen-Hsun Ho (Taipei Medical University-Shuang Ho Hospital, New Taipei, Taiwan); Wei-Chieh Huang (New Taipei City Hospital, New Taipei, Taiwan); Ying-Ying Chen (MacKay Memorial Hospital, Taipei, Taiwan); Vin-Cent Wu (National Taiwan University Hospital, Taipei, Taiwan, Director of Coordinating Center).
Additional Information
Disclosure Summary: No competing interest was declared. No financial conflict of interest exists.
References
