


Abstract
The peptide hormone insulin-like factor 3 (INSL3) is a marker for Leydig cell function and the clinical use of serum INSL3 measurements has been suggested by several groups.
(1) To establish a reference range for liquid chromatography–tandem mass spectrometry (LC-MS/MS) of serum INSL3 in healthy boys and men; and (2) to compare the associations of serum INSL3 and testosterone (T) to pubertal stage, lifestyle factors, diurnal variation, body composition, and human chorionic gonadotropin (hCG) stimulation.
In a reference range based on LC-MS/MS analysis of serum from 1073 boys and men, INSL3 increased from levels close to the detection limit (0.03 µg/L) in prepubertal boys to a maximum mean level of 1.3 µg/L (95% CI, 0.9-2.7) in young men (19-40 years of age) and decreased slightly in older men (0.1 µg/L per decade). Serum T, but not INSL3, was associated with body mass index or body fat percentage and with alcohol consumption. Smoking was positively associated with serum T, but negatively associated with INSL3. There were significant diurnal variations in both INSL3 and T in men (P < 0.001), but serum INSL3 varied substantially less, compared with serum T (± 11% vs ± 26%). Mean serum INSL3 increased after hCG stimulation, but less than T (+ 17% vs + 53%). In both healthy men and in patients suspected of testicular failure, baseline serum INSL3 was more closely associated to the hCG-induced increase in serum T than baseline T itself.
Measurement of serum INSL3 by LC-MS/MS has promise as a marker of testicular disorders.
Insulin-like factor 3 (INSL3) is a member of the insulin/insulin-like growth factor/relaxin superfamily of peptide hormones (1). INSL3 is produced by the testicular Leydig cells and the Theca cells of the ovaries. The molecular target for INSL3 is the receptor relaxin family peptide receptor 2 (RXFP2). Mutations in the INSL3 or RXFP2 genes results in improper testicular descent during embryogenesis in rodents and is a rare cause of cryptorchidism in humans (2, 3). Postnatally, INSL3 may regulate male germ cell survival (4), bone metabolism (5), and muscle growth (6). The circulating concentration of INSL3 is a candidate diagnostic marker for developmental and reproductive disorders in men and women (7) and has primarily been studied as a candidate marker for Leydig cell function. Serum INSL3 reflects Leydig cell maturity and function (8) and INSL3 synthesis is affected by suppression of the hypothalamic-pituitary-gonadal axis (9). The circulating level of INSL3 can be reduced in patients with hypogonadism, including patients with Klinefelter syndrome (10) and Kallmann syndrome (11). Although it is clearly documented that serum INSL3 can be reduced in men with testicular failure, it is not known how or if serum INSL3 measurements can complement the established biochemical markers for hypogonadism. Testosterone (T)—the other major secretory product of the Leydig cells—is the most important marker for hypogonadism and androgen deficiency, but interpretation of the circulating levels of T can be challenging due to its association with lifestyle factors and body composition (12, 13). So far, few studies have evaluated the impact of age (14), diurnal variation (15), and obesity on serum INSL3 (16). We recently developed and validated a mass spectrometry (MS)-based assay for serum INSL3 (17) and the method has since achieved accreditation status according to the ISO 15189 standard for medical laboratories. In the present study we present the first reference range for serum INSL3 in healthy boys and men and compare INSL3 and T in relation to age, pubertal stage, diurnal variation, obesity, smoking, alcohol intake, and human chorionic gonadotropin (hCG)-testing.
Methods and Materials
Subjects
In total, 1557 serum samples from 1231 boys and men from 5 cohorts were analyzed for INSL3 concentrations: Cohort (1) 398 boys aged 10.0 to 21.8 years from The Copenhagen Puberty Study (www.edmarc.net/puberty-cohort.html) (18, 19); Cohort (2) 373 men aged 17.8 to 27.6 years from an ongoing cross-sectional study of young Danish men (20); Cohort (3) 302 men aged 31.4 to 60.9 years from the Health2008 study—a population based cross-sectional study conducted at The Center for Clinical Research and Prevention, Copenhagen, Denmark (21), including a detailed questionnaire and a DXA scan, as previously described (22); Cohort (4) 24 men (aged 20 to 40 years) who had blood samples drawn every 3 hours for 24 hours (23); and Cohort (5) 134 men (aged 20 to 80 years), including 65 healthy men and 69 men with suspected testicular failure, who had an hCG test performed. An injection of 5000 IU hCG (Pregnyl) was given in the gluteal muscle and blood samples were drawn for INSL3 and T measurement before injection and 72 hours after injection (24). Some data on T in cohorts 1, 2, 3, and 5 have previously been reported (19-21, 24).
Clinical examinations
In all cohorts, participants were examined for their general health status, including height and weight, according to the respective study protocols. Body mass index (BMI) was calculated as weight in kilograms divided by height in meters squared. Pubertal stages (G1-G5) were assessed in Cohort 1 according to Tanners classification, as well as by assessment of testicular volume by orchidometry, as previously described (19, 25).
Hormone analysis
All blood samples were drawn from an antecubital vein, clotted and centrifugated, and serum was stored at −20°C until analysis. Serum INSL3 was determined by liquid chromatography–tandem mass spectrometry (LC-MS/MS) as previously described (17). The limit of detection and quantification was 0.06 and 0.15 µg/L, respectively, and the inter-day relative standard deviation (RSD) was < 15%. As previously reported, serum INSL3 was found to be stable during short-term and long-term storage and during freeze/thaw cycles (17). T was analyzed by LC-MS/MS as previously described (26). The quantification limit was 0.012 nmol/L, and inter-day variation expressed as the RSD was < 6%. The INSL3 and T methods have achieved accreditation status according to the standard ISO 15189 for medical laboratories.
Statistical methods
For assessment of diurnal variation, reference charts were developed using the Generalized Additive Models for Location, Scale and Shape (GAMLSS). In the analysis, the data was summarized in 3 smoothed age-dependent curves: L, M and S, of which the L-curve adjusts age-dependent skewness, the M-curve corresponds to the age-dependent median and the S-curve is approximately the age-dependent coefficient of variation (CV). The method was based on the Box-Cox power transformation, which transformed the data to follow a Gaussian distribution for each age. GAMLSS analysis were performed using R version 2.15.2 of the GAMLSS package. The method allows back-calculation to obtain selected percentiles in the original distribution. In the reference charts, we show the 2.5th, 16th, 50th, 84th and 97.5th percentiles corresponding to mean − 2*SD, mean − 1*SD, mean, mean + 1*SD, and mean + 2*SD, respectively. To assess whether INSL3 and T showed diurnal rhythm, a one-harmonic cosinor model was used. The model is ln(analyte_it) = a_i + b*SIN(2πt/24 + c) + epsilon_it where the analyte is INSL3 or T, i and j represent respectively the individual and the hour at which the measurement was taken. The parameter a_i allows each individual to have his own general level from which the diurnal variation acts. The parameter b is the amplitude of the diurnal variation. An individual mean level, the mesor, is the rhythm-adjusted mean value of the cosinor curve. The amplitude is the difference between mesor and peak or between mesor and nadir. Confidence intervals (CIs) were calculated using the delta method. The cosinor analyses were done in Proc Mixed in SAS (SAS Institute Inc., Cary, NC). Other statistical analyses, including linear regression analyses, means, CIs, correlation coefficients, and R2 were calculated in Excel (Microsoft, 2016).
Ethical considerations
All participants had received verbal and written information about the studies before consent for participation was given. A written, informed consent form was signed by the participants and for those younger than 18 years by their parents. The cohort studies were approved by the ethical committees of the Capital Region of Denmark (RegionH): Cohort 1; no. KF 01 282214 and V200.1996/90, the study is registered in ClinicalTrials.gov (identifier NCT01411527), Cohort 2; no. H-KF-289428, Cohort 3; no. H-KA20060011, Cohort 4; no. H-B-2008–011, Cohort 5; no. H-2-2012-092.
Results
INSL3 according to age and pubertal development
Reference ranges for INSL3 (5-60 years of age) and T (0-60 years of age) for boys/men are shown in Fig. 1A and 1B. INSL3 increased with increasing age from undetectable levels in boys aged 5-10 years to a maximum mean level of 1.3 µg/L (95% CI, 0.9-2.7) in young adult males (19-40 years). At older ages, INSL3 levels decreased slightly to 1.2 µg/L (95% CI, 0.9-2.5) in men 50 to 60 years of age. INSL3 correlated significantly with T (R2 = 0.4; P < 0.001) (Fig. 1C) in 1009 subjects. INSL3 was positively associated with increasing genital stages (G1-G5) and increased in parallel with changes of T (Fig. 2). Furthermore, INSL3 and T increased with increasing testicular volume and with a large interindividual variation for both hormones (Fig. 3A and 3B).
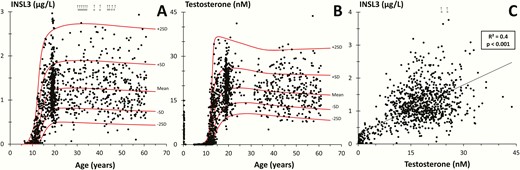
(A) Insulin-like factor 3 (INSL3) and (B) testosterone (T) as a function of age in 1073 and 1462 healthy boys and men, respectively. Red solid lines represent means, ± 1 SD and 2 SD. (C) INSL3 concentration versus T concentrations in 1009 subjects. Line represents regression line (R2 = correlation coefficient). (A and C): The empty circles and arrows at the top indicate men with INSL3 levels above the shown range.
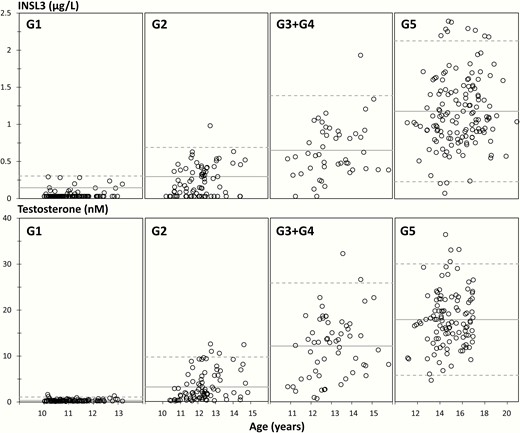
Insulin-like factor 3 (INSL3) (top panels) and testosterone (T) (lower panels) concentrations according to age within each genital stage (G1, G2, G3 + G4, and G5) in 366 and 387 healthy boys and adolescents, respectively, aged 10.0 to 21.8 years. Full lines represent means and dotted lines represent 95% prediction interval.
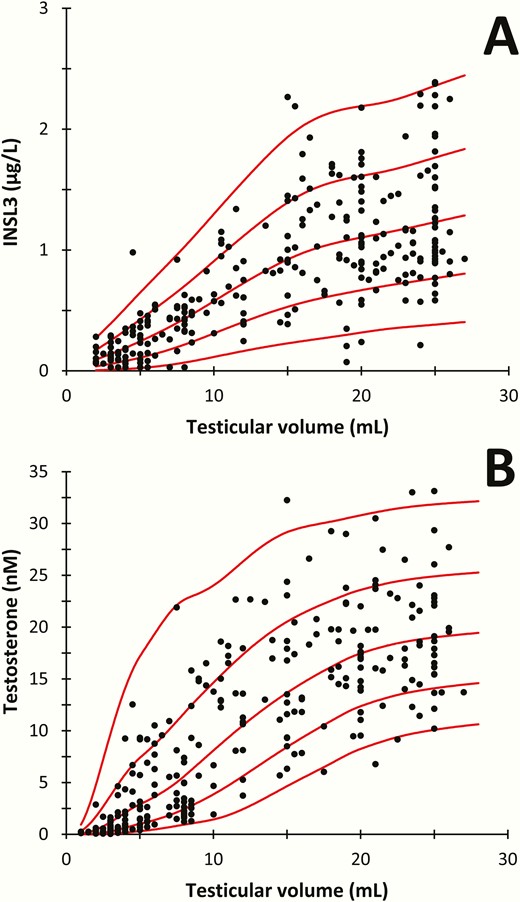
(A) Serum concentrations of insulin-like factor 3 (INSL3) and (B) testosterone as functions of mean testicular volume (mL) assessed by orchidometer in 223 healthy boys and adolescents aged 10.0 to 21.8 years.
INSL3 according to adult age, body composition, smoking, and alcohol
The reference range included 302 healthy Danish men (aged 31-60 years) from the well-characterized Cohort 3. In this cohort, INSL3 declined modestly, but significantly, with increasing age (P < 0.02), whereas T did not change with increasing age in this group (Fig. 4A and 4B). In Cohort 3, serum INSL3 was not associated with changes in BMI or body fat percentage by DXA, whereas T concentrations decreased markedly with both increasing BMI and body fat percentage (P < 0.001) (Fig. 4C-4F). Mean serum INSL3 in Cohort 3 was 14% lower in the group of self-identified daily smokers compared with never smokers (1.25 vs 1.45 µg/L; P < 0.05), whereas mean serum T was 14% higher in smokers than in nonsmokers (21.1 vs 18.5 nM; P < 0.005). In Cohort 3, serum INSL3 was not associated with self-reported alcohol intake, whereas mean T was 13% higher in the group who reported they consumed alcohol 7 days per week compared with the group of men that reported alcohol consumption of 0 or 1 days per week (19.8 vs 17.3 nM; P < 0.02).
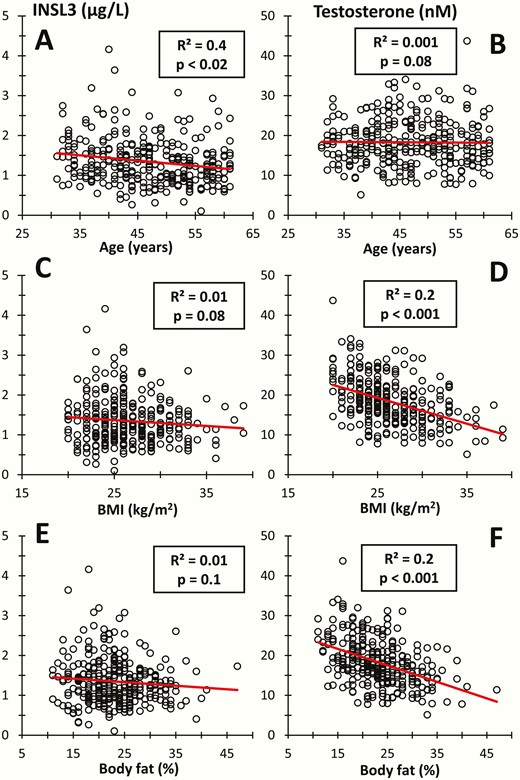
Insulin-like factor 3 (INSL3) and testosterone in 302 healthy adult men versus (A and B) age, (C and D) body mass index (BMI), and (E and F) body fat percentage by DXA scan. Lines represent regression lines (R2 = correlation coefficient).
Diurnal variation
There were significant diurnal variations in serum concentrations of INSL3 and T (P < 0.001) in Cohort 4 (Fig. 5A and 5B). The mean INSL3 level was maximally 10% above the total mean in the morning (0600 h) and 11% below the total mean in the afternoon (1500 h), while T was maximally 25% above the total mean in the morning (0600 h) and 26% lower in the evening (2100 h) (Fig. 5C).
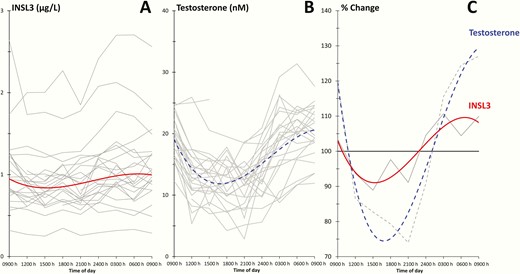
(A and B): Diurnal variation in insulin-like factor 3 (INSL3) and testosterone (T) concentrations in 24 healthy men. Grey lines represent values from individual subjects, and red and blue lines represent fitted curves of INSL3 and T, respectively. (C): Grey lines represent average of all individuals and red and blue lines are fitted curves for INSL3 and T, respectively, and plotted relative to the total average.
hCG stimulation
In Cohort 5 (n=134), consisting of healthy men (n = 65) and male patients with suspected testicular failure (n = 69), the mean serum INSL3 level increased with 17% (95% CI, −5% to +52%) from baseline to 72 hours after hCG stimulation (1.4 vs 1.7 µg/L; P < 0.04) (Fig. 6A), whereas the mean T level increased with 53% (95% CI, +39% to +86%; P < 0.001) (Fig. 6B). The hCG-induced change in serum INSL3 was dependent on the baseline INSL3 concentration. In the lowest (baseline INSL3 < 0.7 µg/L) and second lowest (baseline INSL3: 0.7-1.3 µg/L) quartiles, the mean serum INSL3 did not change significantly after hCG stimulation (Fig. 6A, red and orange lines). In the third (baseline INSL3: 1.3-2.0 µg/L) and fourth (baseline INSL3: 2-4.4 µg/L) quartiles, the mean serum INSL3 increased significantly after hCG stimulation (+19% and +20%, respectively; P < 0.001) (Fig. 6A, green and blue lines). In comparison, T increased in all participating men and in all quartiles (+44% to +61%; P < 0.001) (Fig. 6B). An overview of the change in T as a function of baseline INSL3 for each of the 134 men is shown in Fig. 6C. Baseline INSL3 and baseline T was associated to the change in T in all 134 men (R2 = 0.4; P < 0.001 and R2 = 0.2; P < 0.001, respectively) (Fig. 6D and E, black lines). Baseline INSL3 was associated to the change in T in both the group of patients suspected of testicular failure (R2 = 0.3) and in the healthy men (R2 = 0.2) (Fig. 6D, red and blue dots, respectively). In comparison, baseline T showed weaker association with change in T among the patients (R2 = 0.1), and no association in the group of healthy men (Fig. 6E, red and blue dots, respectively). We observed a single outlier with relatively high baseline INSL3, but relatively low change in T (Fig. 6D, red empty circle). Removing the outlier increased the association in the patient group between baseline INSL3 and change in T from R2 = 0.3 to R2 = 0.4, whereas the association between baseline T and change in T remained relatively low (R2 = 0.1). The change in INSL3 was positively correlated to the change in T (R2 = 0.3; P < 0.001) (Fig. 6F).
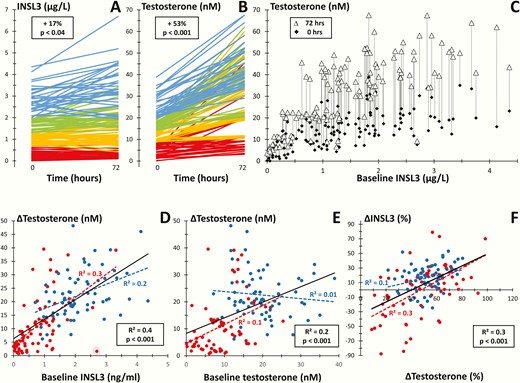
(A and B): Serum concentrations of insulin-like factor 3 (INSL3) (A) and testosterone (T) (B) before (0) and after (72 hours) human chorionic gonadotropin (hCG) injection (5000 IU intramuscularly) in 134 healthy men or male patients suspected of testicular failure. Colors show quartiles of baseline values and percentages show changes in mean concentrations. (C): Baseline and stimulated serum T in 134 men as functions of baseline serum INSL3. (D and E): hCG-induced changes in serum T as functions of baseline serum INSL3 (D) and baseline T (E), respectively. (F): Percental change in serum INSL3 as a function of serum T following hCG testing. (D, E, and F): Blue dots: healthy men (n = 65); red dots: male patients (n = 69); blue line: regression line of healthy men; red line: regression line of patients; black line: regression line of total group of healthy men and patients (n = 134); (R2 = correlation coefficient); a single outlier is indicated by the empty red circle (D).
Discussion
We here describe serum INSL3 reference ranges throughout life in 1073 healthy boys and men and show the associations of serum INSL3 to pubertal stage and testicular volume in boys and adolescents. In men, serum T, but not serum INSL3, was associated with BMI, body fat percentage, and alcohol intake. Serum INSL3 was lower in smokers than nonsmokers, whereas T was higher. In addition, we found that serum INSL3 showed diurnal variation, although much less so than T. Finally, baseline serum INSL3 was closer associated to the increase in serum T after hCG stimulation than baseline T.
We show that serum INSL3 increases during puberty in agreement with previous studies using immunoassays (27-29). INSL3 also increases in parallel to increasing testicular volume. Testicular size is mostly derived from germ and Sertoli cells and not primarily from Leydig cells. However, the Leydig cell pool and its functionality determined by circulating T is significantly associated with testicular volume in pubertal boys (30) as well as in adult men (31). The mean serum INSL3 level was 1.3 µg/L in young men (19-40 years) and INSL3 decreased slightly with older age (~0.1 µg/L per decade). With a reference range in place we propose that the validated LC-MS/MS method (17) for serum INSL3 could be introduced as a clinical marker. Many larger biochemical departments have introduced high-throughput LC-MS/MS methodologies for clinical measurement of small molecules (< 900 Da); however, macromolecules are more challenging to measure by MS-based methods; in particular, proteins and peptides below < 1 ug/L can be difficult to quantitate in plasma/serum by MS. Previously, we reported that the limit of detection (LOD) in LC-MS/MS measurements of serum INSL3 is 0.06 ug/L and the limit of quantification (LOQ) is 0.15 ug/L (17) (the LOD was defined as 4 times the standard deviation of 6 measurements of a pool of serum from 4 women (> 50 years old) and the LOQ was defined as the lowest concentration level where the results of 5 measurements resulted in a deviation below 20%). In a new spiking experiment, we find that the LC-MS/MS method can detect recombinant INSL3 spiked in a pool of serum collected from women (> 50 years of age) down to at least 0.03 ug/L (unpublished data). As such, the LOD has been changed to 0.03 ug/L, but the LOQ remains at 0.15 ug/L. In comparison, the LOD of an in-house time-resolved fluorescent immunoassay (TRFIA) was originally 0.06 ug/L (10), and subsequently lowered to 0.01 ug/L (32). The sensitivity of a method for serum INSL3 is important for its possible clinical utility. For example, using TRFIA we have previously shown that serum INSL3 increases in parallel with serum T during early puberty initiation in boys (29). The performance of the LC-MS/MS method for detection of early puberty is currently unknown. The time and workload associated with the LC-MS/MS method for serum INSL3 is also important for its possible clinical utility and is only slightly higher as compared to our established routine methods for androgens (26) and less than the workload associated with routine measurement of estrogens (33). With the current setup, each batch includes 66 serum samples (and 5 calibrants and 9 QC samples) and takes less than 1 working day for 1 person to prepare for overnight LC-MS/MS measurement. Thus, the throughput, time, and workload with LC-MS/MS of serum INSL3 is like other routine established LC-MS/MS methods. We emphasize that the throughput, sensitivity, and reproducibility of LC-MS/MS of serum INSL3 may depend on the LC-MS/MS platform. In 3 years, we have measured INSL3 in > 2000 serum samples on the Vantage LC-MS/MS platform and the total CV of LC-MS/MS of serum INSL3 was < 15%, including 3 individually prepared batches of calibrants. In comparison, the long-term CV of LC-MS/MS of serum steroids is < 10% when using the newer Quantiva LC-MS/MS platform (26, 33). To our knowledge, the throughput and reproducibility in a routine-like setting has not been investigated for immuno-based measurement of serum INSL3. Another crucial issue is influence from preanalytical conditions. As previously reported, we have found that serum INSL3 is stable for at least 2 days when stored at room temperature and stable for at least 3 days when stored at 4°C, and that there is no effect on serum INSL3 in samples subjected to at least 4 freeze/thaw cycles (17). Serum INSL3 is also stable during freeze/thaw cycles, according to immunoassay (10). We previously observed good correlation between INSL3 levels in 67 serum samples that were first measured by immunoassay and then stored for 3 years at −80°C before re-analysis by LC-MS/MS (17). The long-term stability of serum INSL3 is further supported by our recent experiment finding that serum INSL3 is stable when stored at −20°C for at least 3 months (unpublished results). In addition, the measured serum INSL3 level in healthy Danish men (the reference range men) is in close agreement with a previous large-scale study that used the TRFIA to measure INSL3 in 1160 Australian men (30-80 years of age) (14). We note that only 2 large-scale studies of serum INSL3 have been published so far and even though the 2 studies were performed in 2 different laboratories, on 2 different cohorts and with 2 different assays, both studies report a mean INSL3 level of 1.3 µg/L in younger men and a subsequent slight decrease with older age. In comparison, the reported reference ranges for T vary considerably among laboratories and assays, and this is partly responsible for the challenges in defining an internationally accepted lower limit for normal levels of circulating T (12).
We found that serum INSL3 was not associated with BMI or body fat percentage determined by DXA, whereas T decreased significantly with increasing obesity. Similarly, in the study of the Australian cohort there was no correlation between BMI and plasma INSL3, whereas T decreased with increasing BMI (14, 34). In contrast, a study using a commercial immunoassay on serum from adult Italian men detected a decrease in serum INSL3 with obesity (16). We also found that serum INSL3, but not serum T, decreased slightly with increasing age (31 to 60 years), in cohort 3. We acknowledge that most large-scale population-based studies report a 1% to 2% annual decline in T. In the Australian cohort, age appeared not to be associated with serum T when adjusting for physical and lifestyle factors, whereas INSL3 also in this study decreased with older age (14, 34). This supports the notion that serum INSL3 directly reflects a decrease in the Leydig cell function with aging, whereas T is partly rescued by a parallel increase in luteinizing hormone (LH). We also found that INSL3 was not associated with alcohol intake, whereas T was increased in association with alcohol consumption, and that serum INSL3 was reduced in smokers, whereas T was increased in smokers. For the purpose of this study, smoking and alcohol intake was analyzed as independent variables. The observed associations between INSL3 and T versus smoking and alcohol intake agree with the study of the Australian cohort (14, 34). In addition, the observation of increased T in smokers is in agreement with several other studies (13, 35, 36).
T is released in a pulsatile manner where a low basal release is superimposed by larger bursts, and there is significant diurnal variation of circulating T. To distinguish a transient T decrease from permanently impaired Leydig cell functionality, resulting in T deficiency, it is therefore recommended that “ . . . clinicians should measure total testosterone concentrations on 2 separate mornings . . . ” (12). Only a single study has previously examined the diurnal variation of INSL3 in humans—this study used a commercial radioimmunoassay and observed no significant diurnal variation, whereas T showed significant diurnal variation in the same samples (15). We observed a significant diurnal variation of circulating INSL3 in adult men, in parallel with T, which supports that INSL3 is not constitutively expressed by adult human Leydig cells. Importantly, we found that INSL3 fluctuated substantially less compared to T (± 11% vs ± 26%). In our clinical setting we aim to collect serum intended for T measurements in the morning, but in practice, samples are often collected hours later. Based on our study, mean T decreased on average 28% from 0900 h to 1200 h, whereas in the same time interval INSL3 decreased on average only 9%.
We found that only men with a relatively high baseline INSL3 had a significant increase in serum INSL3 72 hours after hCG stimulation, while no significant increase was observed in those with a baseline INSL3 concentration below average (< 1.3 µg/L). Some previous studies of humans, animals, and cultured Leydig cells conclude that INSL3 is not acutely influenced by LH/hCG stimulation, whereas other studies report an acute increase in INSL3 after stimulation with LH/hCG. Our results suggest that the conflicting results may partly be explained by different states of the Leydig cells in different studies. In comparison, we observed that hCG stimulation caused a consistent and significant increase in T in all the participants of our study. Thus, both during normal diurnal variation and after hCG stimulation, the changes in serum INSL3 were relatively small and/or less consistent among the participants, compared to the more prominent changes in serum T. The same underlying mechanism may also explain why a slight increase in LH in older men would suffice to (largely) rescue serum T levels, but not serum INSL3 levels. The increase in T after hCG stimulation is believed to reflect the Leydig cells maximum capacity for secreting T, which represents the condition of the Leydig cells. Interestingly, we found that baseline INSL3 was more closely associated to the absolute increase in serum T than baseline T. This suggests that serum INSL3 may predict Leydig cell capacity. Serum INSL3 may also be influenced by the little understood mechanism of export of INSL3 from cells/tissue and by the half-life of INSL3 in solution.
In conclusion, we present reference ranges for INSL3 by LC-MS/MS according to age, pubertal stage, and testicular volume in healthy boys and men. Our results suggest that serum INSL3 may be a more direct and sensitive marker for Leydig cell function, as compared with serum T. It remains to be uncovered how serum INSL3 may add diagnostic value compared to that of T in men suspected of testicular disorders.
Abbreviations
- BMI
body mass index
- CV
coefficient of variation
- DXA
dual-energy x-ray absorptiometry
- hCG
human chorionic gonadotropin
- INSL3
insulin-like factor 3
- LC-MS/MS
liquid chromatography–tandem mass spectrometry
- LH
luteinizing hormone
- LOD
limit of detection
- LOQ
limit of quantification
- T
testosterone
- TRFIA
time-resolved fluorescent immunoassay
Acknowledgments
We thank all participants in the cohort studies, who provided serum samples, as well as the staff involved in the projects, including the recruitment procedures, physical examinations, collection, and analysis of samples.
Financial Support: This project was supported by Innovation Fund Denmark (14-2013-4), and The ReproUnion collaboration, co-financed by the European Union, Interreg V ÖKS (NYPS-ID 20200407).
Additional Information
Disclosure Summary: The authors have nothing to disclose.
Data Availability: All data generated or analyzed during this study are included in this published article or in the data repositories listed in References.
References
