


Abstract
Human height is an inheritable, polygenic trait under complex and multilocus genetic regulation. Familial short stature (FSS; also called genetic short stature) is the most common type of short stature and is insufficiently known.
To investigate the FSS genetic profile and develop a polygenic risk predisposition score for FSS risk prediction.
The FSS participant group of Han Chinese ancestry was diagnosed by pediatric endocrinologists in Taiwan.
The genetic profiles of 1163 participants with FSS were identified by using a bootstrapping subsampling and genome-wide association studies (GWAS) method.
Genetic profile, polygenic risk predisposition score for risk prediction.
Ten novel genetic single nucleotide polymorphisms (SNPs) and 9 reported GWAS human height-related SNPs were identified for FSS risk. These 10 novel SNPs served as a polygenic risk predisposition score for FSS risk prediction (area under the curve: 0.940 in the testing group). This FSS polygenic risk predisposition score was also associated with the height reduction regression tendency in the general population.
A polygenic risk predisposition score composed of 10 genetic SNPs is useful for FSS risk prediction and the height reduction tendency. Thus, it might contribute to FSS risk in the Han Chinese population from Taiwan.
Human height is an inheritable, polygenic trait under complex and multilocus genetic regulation (1–3). Genetic predisposition to human height has been widely explored using genome-wide association studies (GWAS) in multi-ethnic populations (4–14). Among these studies, approximately 700 single nucleotide polymorphisms (SNPs) in 420 genetic loci were reported. These genetic loci were associated with tyrosine phosphatase family proteins, insulin-like growth factor, skeletal development, mitosis, fibroblast growth factors, Wnt/β-catenin pathway, hedgehog signaling, and cancer-associated pathways, among others, highlighting the polygenic nature of human height.
Short stature is defined as a body height less than the third percentile or less than 2 standard deviations below the mean height for the corresponding age and gender according to the growth standards for height of the population (15). Bone homeostasis is a physiological process and the balance between bone remodeling and bone formation (16). Bone homeostasis is also a cellular physiological process with osteoclastogenesis and osteogenesis maintained by osteoclasts and chondrocytes, respectively (17). Osteoclasts and chondrocytes play important roles in the growth plate as well as in human height regulation (18, 19). The role of bone homeostasis in short stature remains to be elucidated. In addition, familial short stature (FSS; also called genetic short stature) is the most common type of short stature and is only caused by genetic factors (20–22). However, the genetic profile for FSS and its molecular influence in bone biology remains to be investigated (1).
In this study, we investigated the genetic predisposition to FSS in Han Chinese people in Taiwan using a bootstrapping subsampling and GWAS method (23, 24). We found 10 novel and 9 human height GWAS-reported SNPs robustly associated with FSS risk. A height reduction regression tendency in the general population was also observed between cumulative genetic predisposition score and human height regardless of gender.
Participants and Methods
Ethics and consent
This study is a cross-sectional study on the clinical, biochemical, and genetic findings collected from participants with FSS sequentially identified from the Children’s Hospital, China Medical University, Taichung, Taiwan, from August 1999 to September 2018. This study was approved by the institutional review board and the ethics committee of the Human Studies Committee of China Medical University Hospital. Written informed consent was obtained from the participants, their parents, or legal guardians according to institutional requirements and Declaration of Helsinki principles (25).
Participants
The participant group used in this study was diagnosed by pediatric endocrinologists in Taiwan (Fig. 1 and Supplementary Fig. S1) All supplementary material and figures are located in a digital research materials repository (26). The participant group included a cohort with FSS (N = 1163). All recruited participants were of Han Chinese ancestry and diagnosed with FSS (1, 20, 22). The selection criteria for FSS was (1) (a) height less than the third percentile (Supplementary Fig. 7) (2, 26), (b) (father and/or mother) less than the third percentile (3), (c) bone age appropriate for chronologic age (4), (d) normal onset of puberty (5), (e)normal annual growth rate, and (6) (f) normal results of clinical biochemistry examination. Excluded individuals were those with all other abnormal morphology and karyotyping results, abnormal bone age or puberty stage, or abnormal serum or plasma levels of clinical biochemistry examinations for growth hormone–insulin-like growth factor 1(GH-IGF1) axis, thyroid function, or precocious puberty (Supplementary Fig. S1) (26). There were 1163 participants with FSS in the current study.
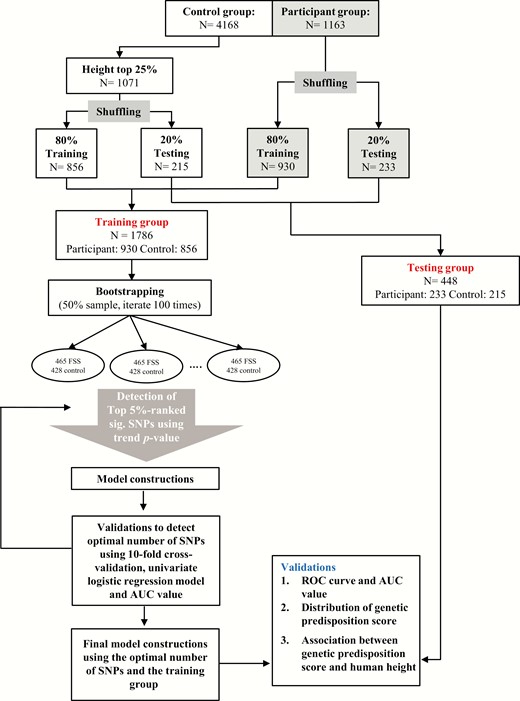
Flow diagram showing the analysis for this study. Abbreviations: AUC, area under the curve; FSS, familial short stature; N, number; ROC, receiver operating characteristic; SNP, single nucleotide polymorphism.
In this study, the control group consisted of 4168 individuals from the Taiwan Biobank (TW-Biobank; http://www.twbiobank.org.tw/new_web/index.php) and our type 2 diabetes cohorts (Fig. 1 and Supplementary Fig. 6) (26). Furthermore, the selection criteria for control groups (N = 1071) were (1) height exceeding the 75th percentile for age and gender of the general population in Taiwan, (2) no history of FSS, and (3) age < 61 years. All participant and control groups in this study were of Han Chinese origin based on principal component analysis of genome-wide data (Supplementary Fig. S2) (26).
Genotyping and quality control
Genomic deoxyribonucleic acid was extracted from the blood samples of participants according to standard protocols using the Qiagen genomic deoxyribonucleic acid isolation kit (Qiagen, Taichung, Taiwan). Each participant with FSS (N = 1163) was genotyped at the National Genotyping Centre at Academia Sinica (Taipei, Taiwan) using the Axiom genome-wide CHB array plate, according to the manufacturer’s procedure. For the control group from the Taiwan Biobank, the GWAS data of each sample was genotyped using the Axiom genome-wide TWB array plate. For the control group from our cohorts with type 2 diabetes, the GWAS data of each patient with type 2 diabetes was genotyped using the Axiom genome-wide TWB array plate, the Affymetrix genome-wide human SNP array 6.0, and the Illumina HumanHap550-Duo BeadChip according to the manufacturer’s procedure.
Because GWAS data were from different genotyping platforms, genotype imputations were performed in both participants with FSS and control groups according to a 2-step genotype imputation approach. We used SHAPEIT2 to pre-phase the study genotypes into full haplotypes (27). We then performed imputation using IMPUTE2 and the Phase I 1000 Genomes Project reference panel (June 2011 interim release) consisting of 1094 phased individuals from multiple ancestry groups (the 1000 Genomes Project Consortium, 2010) (28). Finally, we used the GTOOL software (http://www.well.ox.ac.uk/~cfreeman/software/gwas/gtool.html) to homogenize strand annotation by merging the imputed results obtained from each set of genotyped data.
Genotype and imputed genotype data were quality controlled, and genetic variants were excluded from further analysis if (1) (a) only 1 allele appeared in participants and/or control groups (2); (b) the total call rate was less than 95% for both participants and control groups (3); (c) the minor allele frequency was less than 0.5% in the control groups in the Han Chinese population (4); and (d) genetic variants significantly departed from Hardy-Weinberg equilibrium proportions (P < 0.01).
Genetic predisposition score calculation
The genetic predisposition score (also known as polygenic risk score or genetic risk score) is calculated by multiplying each beta coefficient (log odds ratio [OR]) value by the number of the corresponding risk allele under the additive model for each individual and then summing the products for the risk alleles identified from the multiple susceptible genetic variants (29). In this study, the genetic predisposition score was calculated based on the 10 genetic variants (SNPs). Each genetic variant was given a weightage based on the average effect size (beta coefficient) for the FSS obtained from our study (Table 1). The genetic predisposition score was calculated by multiplying each beta coefficient by the number of corresponding risk alleles (risk allele homozygote [the risk genotype is coded as “2”], risk allele heterozygote [the risk genotype is coded as “1”], and nonrisk allele homozygote [the nonrisk genotype is coded as “0”] according to the additive inheritance model) and then summing the products from these 10 genetic variants weighted by their estimated effect sizes (log OR).
Ten Novel Genetic Variants Associated With FSS Risk
| Training Group (Participant: 930 and Control: 856) | Testing Group (Participant: 233 and Control: 215) | Total Groups (Participant: 1163 and Control: 1071) | |||||||||||
|---|---|---|---|---|---|---|---|---|---|---|---|---|---|
| Genetic variant (rs ID) | Gene | Chr | Position | Risk allele | OR | 95% CI | P Value | OR | 95% CI | P Value | OR | 95% CI | P Value |
| rs202128628 | 2 | 91971930 | T | 9.89 | (5.43- 18) | 6.79E-14 | 8.70 | (3.03- 25.01) | 5.88E-05 | 9.59 | (5.7 - 16.14) | 1.80E-17 | |
| rs116988614 | COL6A5 | 3 | 130092364 | G | 16.24 | (11.4- 23.12) | 6.62E-54 | 12.64 | (7.06- 22.66) | 1.51E-17 | 15.32 | (11.33 - 20.73) | 3.52E-70 |
| rs2375843 | LOC105374144 | 3 | 145352404 | C | 3.87 | (3.33- 4.55) | 1.40E-70 | 4.62 | (3.36- 6.34) | 2.60E-21 | 4.00 | (3.45 - 4.55) | 3.95E-90 |
| rs525537 | 3 | 165355602 | G | 5.63 | (4.55- 7.14) | 4.01E-61 | 5.23 | (3.53- 7.75) | 1.37E-16 | 5.56 | (4.55 - 6.67) | 5.40E-76 | |
| rs367599822 | UGT2B17 | 4 | 69412874 | A | 4.12 | (4.84- 3.51) | 4.69E-67 | 4.44 | (3.21- 6.15) | 2.74E-19 | 4.18 | (3.62 - 4.82) | 1.36E-84 |
| rs7659854 | IQCM | 4 | 150692140 | C | 5.71 | (4.93- 6.61) | 2.42E-120 | 5.37 | (4.04- 7.13) | 4.73E-31 | 5.64 | (4.95 - 6.42) | 1.44E-149 |
| rs13183322 | 5 | 109237379 | C | 1.93 | (1.65- 2.25) | 7.01E-17 | 1.77 | (1.31- 2.4) | 2.25E-04 | 1.90 | (1.65 - 2.18) | 7.76E-20 | |
| rs117002249 | 5 | 145793167 | T | 10.21 | (5.56- 20) | 4.53E-13 | 6.12 | (2.32- 16.16) | 2.50E-04 | 9.09 | (5.26 - 14.29) | 3.37E-16 | |
| rs7033295 | 9 | 2407693 | G | 4.94 | (4- 6.25) | 2.61E-43 | 4.53 | (2.94- 6.99) | 7.92E-12 | 4.76 | (4 - 5.88) | 1.42E-53 | |
| rs199690933 | PGM5P2 | 9 | 69132306 | T | 5.04 | (3.36- 7.57) | 5.05E-15 | 5.55 | (2.27- 13.55) | 1.71E-04 | 5.13 | (3.55 - 7.41) | 3.88E-18 |
P value was expressed in exponential notation (The E is standard scientific notation for power of 10; for example: 6.79E-14 means 6.79 x 10⁻¹⁴).
OR calculation was conducted according to the defined risk alleles.Abbreviations: Chr, chromosome; CI, confidence interval; FSS, familial short stature; OR, odds ratio.
Statistical analysis
All the genotyped and imputed GWAS results of participants with FSS and their control groups were used for association studies using a regression framework implemented in PLINK under the additive inherited genetic model (30). The difference in allelic frequency in the additive model between the participants and control groups was measured by odds ratios (ORs) with 95% confidence intervals (CIs) using logistical regression models (Tables 1–2 and Supplementary Tables 1–6 and 8–9) (26). All data management and statistical analyses were performed using PLINK and SAS software (version 9.4; SAS Institute, Cary, NC, USA).
Nine Human Height-Related Genetic Variants Associated With FSS Risk
| Training Group (Participant 930 and Control: 856) | Testing Group (Participant 233 and control: 215) | Total groups (Participant 1,163 and control: 1,071) | ||||||||||||||
|---|---|---|---|---|---|---|---|---|---|---|---|---|---|---|---|---|
| Genetic Variant (rs ID) | Gene | Chr | Position | Risk Allele | Reference | PMID Number | Population | OR | 95% CI | P Value | OR | 95% CI | p value | OR | 95% CI | p value |
| rs2421992 | DNM3 | 1 | 172241251 | C | Wood AR et al, 2014 | 25282103 | European | 4.35 | (3.85-5.00) | 5.72E-93 | 5.00 | (3.7 - 6.67) | 1.37E-27 | 4.55 | (4.00 - 5.00) | 8.78E-119 |
| rs4974480 | ANAPC13 | 3 | 134178562 | A | Wood AR et al, 2014 | 25282103 | European | 1.33 | (1.14-1.54) | 3.05E-04 | 1.55 | (1.15 - 2.10) | 4.33E-03 | 1.37 | (1.20 - 1.57) | 6.21E-06 |
| rs13131350 | LCORL | 4 | 17877487 | G | He M et al, 2015 | 25429064 | European, East Asian | 1.30 | (1.12-1.49) | 3.92E-04 | 1.40 | (1.06 - 1.85) | 1.83E-02 | 1.32 | (1.16 - 1.50) | 2.31E-05 |
| rs7763064 | GPR126 | 6 | 142797289 | A | Lango Allen H et al, 2010 | 20881960 | European | 1.23 | (1.07-1.41) | 3.26E-03 | 1.19 | (0.91 - 1.55) | 1.99E-01 | 1.22 | (1.08 - 1.38) | 1.36E-03 |
| rs10858250 | QSOX2 | 9 | 139119215 | A | He M et al, 2015 | 25429064 | European, East Asian | 1.23 | (1.05-1.45) | 8.53E-03 | 1.37 | (1.00 - 1.85) | 5.08E-02 | 1.27 | (1.10 - 1.47) | 1.21E-03 |
| rs11170631 | ATF7-ATP5G2 | 12 | 54041192 | T | Okada Y et al, 2010 | 20189936 | Japanese | 1.35 | (1.18-1.56) | 1.57E-05 | 1.43 | (1.09 - 1.89) | 1.18E-02 | 1.37 | (1.20 - 1.56) | 6.08E-07 |
| rs258324 | CDK10 | 16 | 89754255 | G | He M et al, 2015 | 25429064 | East Asian | 1.19 | (1.03-1.39) | 1.61E-02 | 1.32 | (0.99 - 1.79) | 6.14E-02 | 1.22 | (1.08 - 1.39) | 2.80E-03 |
| rs8094261 | CABLES1 | 18 | 20746728 | G | Kim JJ et al, 2010 | 19893584 | Korean | 1.38 | (1.16-1.64) | 2.57E-04 | 1.33 | (0.94 - 1.88) | 1.05E-01 | 1.37 | (1.17 - 1.6) | 6.46E-05 |
| rs4911494 | UQCC1 | 20 | 33971914 | T | Soranzo N et al, 2009 | 19343178 | European | 1.33 | (1.15-1.54) | 1.26E-04 | 1.22 | (0.89 - 1.67) | 2.08E-01 | 1.32 | (1.15 - 1.49) | 6.12E-05 |
OR calculation was conducted according to the defined risk alleles. Deviation from the additive model was tested. A P value for the additive test < 0.05 in the training group was considered significant.
Abbreviations: Chr, chromosome; CI, confidence interval; FSS, familial short stature; ID, identifier; PMID, PubMed identifier; OR, odds ratio.
For haplotype block analysis, the Lewontin D′ and R2 values were used to evaluate the intermarker coefficient of linkage disequilibrium (LD) in both participants with FSS and control groups (31). The CI for LD was estimated using a resampling procedure and was used to construct the haplotype blocks (Supplementary Fig. S3) (26, 32, 33).
The risk prediction model predicts the health outcome by using several predictor variables based on the observed patient’s characteristics (34). Risk prediction was evaluated by the area under the receiver operating characteristic (ROC) curves (AUCs). The AUC ranged from 0.5 (total lack of discrimination) to 1.0 (perfect discrimination). AUCs were calculated for the predicted risks of 10 novel, 9 reported, and combined SNPs, respectively (Figs. 2a and 2b).

Receiver operating characteristic (ROC) curves, area under the curve (AUC) values, and distribution of the genetic predisposition score for familial short stature (FSS) among training and testing groups, respectively. (a) ROC curves and AUC values for 10 novel single nucleotide polymorphisms (SNPs; Novel), 9 reported SNPs (Report), and 10 novel and 9 reported SNPs (Novel + Report) in the training group. The 10 novel SNPs showed the AUC value (AUC = 0.949); the 9 reported SNPs showed the AUC value (AUC = 0.955); the 10 novel + 9 reported SNPs showed the AUC value (AUC = 0.954). (b) ROC curves and AUC values for 10 novel SNPs (Novel), 9 reported SNPs (Report), and 10 novel + 9 reported SNPs (Novel + Report) in the testing group. The 10 novel SNPs showed the AUC value (AUC = 0.940); the 9 reported SNPs showed the AUC value (AUC = 0.869); the 10 novel and 9 reported SNPs showed the AUC value (AUC = 0.948). (c) The distribution of the genetic predisposition score from 10 novel SNPs between FSS and control groups in the training group (FSS: gray square; Controls: white square). (d) Distribution of the genetic predisposition score from 10 novel SNPs between FSS and control groups in the testing group (FSS: black square; Controls: white square).
For the linear human height curve model, participants with the genetic predisposition score calculated from the 10 novel SNPs (Fig. 3a) and 9 human height-related SNPs (Fig. 3b) were used as continuous variables in a linear regression with human height (cm) as the dependent variable, respectively.
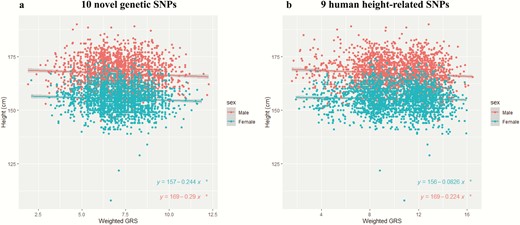
Association between genetic predisposition score (GRS) and human height for male and female participants. Human height (cm) values are shown with respect to genetic predisposition score values. The mean ± 95% confidence interval was plotted. *P value < 0.05. (a) Participants with their genetic predisposition score of 10 novel single nucleotide polymorphisms (SNPs) and human height information were recruited and divided into male and female participants (male participants*, N = 2146; female participants*, N = 2022). (b) Participants with their genetic predisposition score of 9 human height-related SNPs and human height information were recruited and divided into male and female participants (Male participants*, N = 2146; female participants*, N = 2022).
Results
Bootstrap ranking identifies 10 novel and 9 human height GWAS-reported SNPs robustly associated with FSS
The flowchart of enrollment of participants with FSS is shown (Supplementary Fig. S1) (26). Participants for controls were recruited when their body heights exceeded that of the top 75th percentile of the general population in Taiwan. All the participants and control groups were of Han Chinese ancestry and were located in the East Asian population using principal component analysis (Supplementary Fig. S2) (26).
As shown in Fig. 1, participants with FSS and their control groups were randomly shuffled and assigned into the training (80% of the total population) and testing (20% of the total population) groups. For the training group, 930 participants and 856 control participants served as the discovery stage for subsequent model construction and validation to obtain an optimal number of SNPs using AUC values. Bootstrapping 50% subsampling and GWAS analyses iterated 100 times were performed (Fig. 1) (23, 24). The top 5%-ranked significant SNPs were obtained using the Cochran-Armitage trend P value. In the SNP list, there were 155 SNPs with P values < 1.00–10 under the Cochran-Armitage trend model (Supplementary Table S1) (26). For the testing group, 233 participants and 215 control participants served as the examination stage for validation including the ROC curve and AUC values, distribution of genetic predisposition scores, and association between genetic predisposition scores and human height (Fig. 1).
To obtain the optimal number of SNPs for the risk prediction model in the testing group, 10-fold cross-validation, univariate logistic regression model, and AUC value were obtained for the training group (Fig. 1; Supplementary Fig. S5) (26). These resulted in 10 novel SNPs (Table 1). The pair-wise LD for the 10 novel SNPs was also considered to prevent a miscalculation of the cumulative effect of these identified SNPs (Supplementary Fig. S3) (26, 31–33). SNPs with strong LD (D′ > 0.8) were excluded. These results suggest that these 10 novel SNPs were independent from each other, and thus were used to obtain AUC values, distribution of genetic predisposition scores, and association between genetic predisposition scores and human height (Figs. 2 and 3). In the training group, the highest AUC value for the 10 novel SNPs was observed (Fig. 2a; AUC = 0.949). In the testing group, the highest AUC value for 10 novel SNPs was observed (Fig. 2b; AUC = 0.940). These 10 novel SNPs within the 5 closest genes were rs202128628 and rs116988614 in COL6A5; rs2375843 in LOC105374144 (a non-coding ribonucleic acid gene); rs525537 and rs367599822 in UGT2B17; rs7659854 in IQCM; and rs13183322, rs117002249, rs7033295, and rs199690933 in PGM5P2 (Table 1).
Furthermore, genetic predisposition to human height has been reported (4–14). To investigate the associations between these known GWAS human height-related SNPs and FSS risk, we then evaluated their associations using the P value under the Cochran-Armitage trend model in our training group. There were 678 human height-related genetic variants investigated in this study (Supplementary Table S2) (26). There were 114 SNPs with a P value for the additive model of < 0.05 in the training group (Supplementary Table S2) (26). After validation using MALDI-TOF mass spectrometry-based SNP genotyping and LD analysis (not shown), the resultant re-selected 9 SNPs are summarized in Table 2. After replication in the testing group, these 9 SNPs were associated with FSS risk with a P value for the additive model of < 0.05 in the total groups. These 9 genetic variants within the 9 closest genes were rs2421992 in DNM3, rs4974480 in ANAPC13, rs13131350 in LCORL, rs7763064 in GPR126, rs10858250 in QSOX2, rs11170631 in ATF7-ATP5G2, rs258324 in CDK10, rs8094261 in CABLES1, and rs4911494 in UQCC1.
ROC curve and AUC value in risk prediction model for FSS
Figures 2a and 2b show the ROC curves for risk prediction for FSS based on the 10 novel, 9 reported, and combined SNPs in the training and testing groups, respectively. In the training group, the AUC was 0.949 (95% CI, 0.939-0.958) for prediction based on the 10 novel SNPs; 0.860 (0.842-0.877) for 9 reported SNPs; and 0.954 (0.946-0.936) for the combined 10 novel and 9 reported SNPs (Fig. 2a).
To ensure robust analysis, the testing group was also applied for final validation and evaluation of the performance of risk prediction models for FSS. In the testing group, the AUC was 0.940 (95% CI, 0.920-0.961) for prediction based on the 10 novel SNPs; 0.869 (0.835-0.903) for 9 reported SNPs; and 0.948 (0.929-0.967) for the combined 10 novel and 9 reported SNPs (Fig. 2b). There was no significant increase in the AUC with the combined 10 novel and 9 reported SNPs when compared with that with the 10 novel SNPs in the training and testing groups, respectively (Figs. 2a and 2b). These results suggest that the 10 novel SNPs are important for FSS risk prediction.
Distribution of genetic predisposition score
Table 1 shows the OR (beta coefficient) associated with the risk allele for each of the 10 novel SNPs in a logistic regression model. In this study, the genetic predisposition score was calculated based on summing of the risk alleles from these 10 novel SNPs by multiplying each beta coefficient (log OR) by the number of corresponding risk allele under the additive model. The frequency distribution of individuals carrying the calculated genetic predisposition score between groups with FSS and control groups is shown in the training and testing groups, respectively (Figs. 2c and 2d). There were significant differences in the distributions of genetic predisposition scores in both the training and testing groups. In the training group, 88.8% had their genetic predisposition score ≥ 9 from FSS, whereas 0.0% had their genetic predisposition score ≥ 9 from the control groups. Similarly, in the testing group, 85.8% had their genetic predisposition score ≥ 9 from FSS, whereas 0.0% had their genetic predisposition score ≥ 9 from the control groups.
The distributions of genetic predisposition score for FSS and control groups were also divided into quartiles (quartile 1-quartile 4; Table 3). Individuals in quartile 1 served as a reference. There was a continuous increasing trend in FSS risk with cumulative genetic predisposition score (P < 0.0001; Cochran-Armitage trend test). Compared with individuals in quartile 1, those in quartiles 2 and 3 showed association with increased FSS risk in a dose-dependent manner (quartile 2: OR, 3.02 [2.16-4.21]; quartile 3: OR, 23.56 [16.93-32.79]). There were no individuals with quartile 4 in the control groups (0.0%); however, there were 543 individuals (64.7%) with quartile 4 in the FSS group. These results suggest that there was a cumulative effect of these 10 novel SNPs on FSS risk.
Cumulative Effect of the 10 Novel Genetic Variants Associated With FSS Risk
| FSS (%) | Controls (%) | ||||
|---|---|---|---|---|---|
| N = 1163 | N = 1071 | ||||
| Quartile of Genetic Score | N (%) | N (%) | OR | 95% CI | P Value |
| Quartile 1 (score ≤ 7.0) | 57 (4.9%) | 496 (46.3%) | Ref | Ref | Ref |
| Quartile 2 (7.0 < score ≤ 8.7) | 146 (12.6%) | 421 (39.3%) | 3.02 | 2.16-4.21 | < 0.0001 |
| Quartile 3 (8.7 < score ≤ 14.4) | 417 (35.9%) | 154 (14.4%) | 23.56 | 16.93-32.79 | < 0.0001 |
| Quartile 4 (score > 14.4) | 543 (64.7%) | 0 (0%) | > 999 | 0.001-999 | 0.934 |
| Cochran-Armitage trend test | < 0.0001 |
The cumulative effect was investigated in the combination of the training and testing groups. The FSS 10 novel genetic variants and their respective risk genotypes were shown in Table 1. Quartile of genetic score was calculated using the cumulation of the 10 genetic variants described in materials and methods. Abbreviations: CI, confidence interval; FSS, familial short stature; N, number; OR, odds ratio; Ref, reference.
Association between genetic predisposition score and human height
The association between genetic predisposition score and human height was also investigated to explore their linear regression when stratified by gender (male: N = 2146; female: N = 2022; Fig. 3a and 3b). Figure 3a shows plots of the genetic predisposition score of males (N = 2146) calculated from these 10 novel genetic variants and the corresponding human height information (cm). The regression line indicated that a 1-unit difference in genetic predisposition score was associated with a reduction of 0.29 cm in height (slope = −0.29; P = 0.00265; human height = 169 cm − 0.29 cm × genetic predisposition score) (Fig. 3a). For females (N = 2022), the regression line indicated that a 1-unit difference in genetic predisposition score was associated with a reduction of 0.244 cm in human height (slope = −0.244; P = 0.009331; human height = 157 cm − 0.244 cm × genetic predisposition score) (Fig. 3a).
Figure 3b shows plots of the genetic predisposition score of males (N = 2146) from 9 human height-related SNPs and the corresponding human height information (cm). The regression line indicated that a 1-unit difference in genetic predisposition score was associated with a reduction of 0.224 cm in height (slope = −0.224; P < 0.0001; human height = 169 cm − 0.224 cm × genetic predisposition score) (Fig. 3b). For females (N = 2022), the regression line indicated that a 1-unit difference in genetic predisposition score was associated with a reduction of 0.0826 cm in height (slope = −0.0826; P = 0.009572; human height = 156 cm − 0.0826 cm × genetic predisposition score) (Fig. 3b). These results suggest that the 10 novel and 9 reported genetic SNPs were associated with height reduction.
Discussion
Osteoclasts and chondrocytes play important roles in growth plate as well as human height regulation. In the growth plate, osteoclast activity regulates the mineralization of highly differentiated hypertrophic chondrocytes (18). Chondrocytes also play important roles in bone growth and homeostasis of the growth plate in bone biology (19). In this study, we identified 10 novel and 9 reported GWAS human height-related SNPs associated with FSS risk. These 10 novel SNPs are a genetic biomarker for FSS risk prediction and are associated with a height reduction regression tendency.
In our previous study, there were 978 participants with FSS and 1129 control participants with their height above the top 75th percentile (1). There were 1033 SNPs in 14 human height GWAS used to evaluate the difference between participants with FSS and control participants (1). As shown, there were 34 SNPs associated with FSS (call rate > 95%, P > 0.05 for Hardy-Weinberg equilibrium, and P < 5.00E-05 (0.05/1033) for the additive model). The LD among these 34 SNPs was determined and the resultant re-selected 13 SNPs were then used for polygenic risk score calculation. The design of the current study included 930 participants with FSS and 856 control participants with their height above the top 75th percentile. In this study, 678 human height-related SNPs were investigated (Supplementary Table S2) (26). There were 114 SNPs with a P value for the additive model of < 0.05 in the training group (Supplementary Table S2) (26). After validation using MALDI-TOF mass spectrometry-based SNP genotyping and LD analysis (not shown), the resultant re-selected 9 SNPs are shown. After replication in the testing group, these 9 SNPs were associated with FSS risk with a P value for the additive model < 0.05 in total groups. These 9 SNPs were then used for FSS risk prediction and height association. Therefore, owing to the differences in number of the human height GWAS-related SNPs, participant number, control number, and, selection for P value for the additive model used in this study, it may result in the elimination from the current paper of the 10 other Taiwanese genes associated with FSS listed in our previous study.
The 10 FSS novel SNPs were mapped to genes such as COL6A5, LOC105374144, UGT2B17, IQCM, and PGM5P2. The 10 novel SNPs were suitable for distinguishing between the FSS and control subgroups (non-FSS) (Supplementary Figs., 6–7 andSupplementary Table 3) (26). However, these SNPs were not suitable for distinguishing between the 97th percentile control and short groups including the third percentile control and 25th percentile control groups (Supplementary Table 5) (26). Among these genes, we identified genetic variants in COL6A5 within at least 2 SNPs (rs116988614 and rs117620786). COL6A5 encodes a member of the supramolecular assembly of collagen VI (ColVI) of the collagen family (35). ColVI is encoded by 6 different genes, COL6A1, COL6A2, COL6A3, COL6A4, COL6A5, and COL6A6. ColVI is involved in the formation of the extracellular matrix of articular cartilage and fetal bone. In the fetal stage, ColVI is located in discrete fibrils in the fetal bone during development (36). In the adult stage, ColVI is mainly located in the pericellular matrix of the cartilage to maintain the integrity of chondrocytes (37). In addition, soluble ColVI has been used as an important stimulant for the expansion and proliferation of chondrocytes (38). Alternative expression or mutations of genes encoding ColVI are associated with changes in bone mineral density, atopic dermatitis, familial neuropathic chronic itch, and musculoskeletal abnormalities such as Bethlem myopathy, Ullrich congenital muscular dystrophy, osteopenia, and other bone and cartilage disorders (39–41).
We also observed that the genetic variant rs367599822, located in UGT2B17, was associated with FSS risk. UGT2B17 encodes the uridine 5'-diphospho-glucuronosyltransferase [UDP]-2B17 protein (42), which is involved in testosterone metabolism and assists in transferring UDP-glucuronic acid to testosterone to increase its renal excretion (43). UGT2B17 is also associated with body mass index, fat mass, male insulin sensitivity, bone mineral density, osteoporosis, and prostate cancer (44–48). Individuals with homozygous deletions of UGT2B17 had significantly higher concentrations of total serum testosterone and estradiol than those with 1 or 2 copies of this gene (47). Both sex hormones are required for cancellous bone mass and integrity (49–53). In early puberty, both sex hormones stimulate fast pubertal growth in human height along with growth hormone (GH) and insulin-like growth factor (IGF)-1 (54). Testosterone increases the width of the epiphyseal growth plate by promoting osteoblast proliferation and differentiation and inhibiting osteoclast activity and apoptosis (50, 51, 55). Estradiol produced from testosterone promotes osteoclast apoptosis and inhibits osteoclast activity (52, 53). At the end of puberty, high levels of estradiol promote the fusion of the epiphyseal growth plate by stimulating chondrocyte maturation and inhibiting its proliferation (56). Therefore, UGT2B17 may affect human height as well as FSS by modulating serum levels of sex hormones and regulating bone and chondrocyte metabolism. Biological studies warrant further investigations in the role of UGT2B17 in the cell proliferations and differentiations of chondrocyte/osteocyte progenitor cells.
Genetic variant rs7659854 in IQCM (also known as LOC285423), encoding IQ motif containing M, was associated with FSS risk. However, its biological function remains to be elucidated. Recently, the genetic variants located with this gene were associated with hypothyroidism (57). Hypothyroidism is an endocrine disorder, in which the thyroid gland does not produce sufficient thyroid hormone. Thyroid hormone, as well as GH, IGF-1, and androgens, can stimulate chondrogenesis and also regulate proliferation and/or differentiation of multiple cell types in bone, including chondrocytes, osteoblasts, and osteoclasts (58). Therefore, hypothyroidism is also associated with short stature (59, 60). Furthermore, we identified a genetic variant rs199690933 in PGM5P2 to be associated with FSS. PGM5P2 encodes phosphoglucomutase 5 pseudogene 2, which is involved in pathological processes in the fibroblast-like synoviocytes from patients with rheumatoid arthritis (61). However, the roles of PGM5P2 in adult height and FSS remain unclear and further functional characterization is required.
The 9 human height-related genetic variants were associated with FSS and were mapped to the genes DNM3, ANAPC13, LCORL, GPR126, QSOX2, ATF7-ATP5G2, CDK10, CABLES1, and UQCC1. The 7 of 9 human height-related SNPs were suitable for distinguishing between the FSS and taller groups including the 97th percentile, 75th percentile, and 50th percentile control groups (Supplementary Figs, 6–7 and Supplementary Table 4) (26). However, these 9 SNPs might not be suitable for distinguishing between the FSS and shorter groups including the 25th percentile and 3rd percentile control groups (Supplementary Table 4) (26). The 5 of 9 human height-related SNPs might be suitable for distinguishing between the 97th percentile control and shorter groups including the FSS, 3rd percentile control groups, and 25th percentile control groups (Supplementary Table 6) (26). Network cluster analysis revealed functions of these genes, which are mainly related to cancer, organismal injury and abnormalities, and reproductive system disease (Supplementary Fig. S4) (26). DNM3 encodes a member of the family of guanosine triphosphate-binding proteins that associate with microtubules and are involved in vesicular transport and megakaryocyte development (62, 63). Genetic variants in DNM3 are associated with human height (4, 10, 64). ANAPC13 encodes a component of the anaphase-promoting complex, a large ubiquitin-protein ligase that controls cell cycle progression by regulating the degradation of cell cycle regulators such as cyclin B (65, 66). Genetic variants in ANAPC13 are associated with human height (5, 7). Genetic variant rs13131350 within LCORL was associated with FSS in our study (1) and was also reported in a meta-analysis study of GWAS of adult height in East Asians (64). GPR126 encodes a G-protein–coupled receptor, genetic variations that are associated with human height (4, 10, 14, 64). Similarly, genetic variations in QSOX2, which encodes a member of the sulfhydryl oxidase/quiescin-6 family (67) are associated with human height (4, 9, 64, 68). ATF7 encodes activating transcription factor 7 and is involved in cell cycle regulation and proliferation (69); genetic variants of ATF7 are associated with human height (9, 64, 70). SNPs in ATP5G2, which encodes a mitochondrial ATP synthase (71), are also associated with human height (9, 64). We detected one FSS-associated SNP (rs258324) in CDK10 (1), which was also reported in a human height GWAS (64). Genetic variations rs4308051 and rs8094261 (1) in CABLES1 are associated with FSS in Han Chinese people in Taiwan and have also been reported in human height GWAS (1, 4, 8, 13, 64). UQCC1 encodes ubiquinol-cytochrome c reductase complex assembly factor 1, a transmembrane protein involved in fibroblast growth factor-regulated growth control, bone growth, and development (72). SNPs in UQCC1 are associated with human height (6, 7, 10, 14, 64, 73). Therefore, FSS may partially overlap with human height-related genetic variants, which are related to height-reducing effects.
An initial GWAS was also performed between the 97th percentile and 25th percentile control groups (Supplementary Tables 7–8) (26). The top 53 significant SNPs were found between the 97th percentile control and 25th percentile control groups (P < 1.00E-5). There were no overlapping SNPs between the top 155 FSS-related SNPs (P < 1.00E-10) and these top 53 SNPs (Supplementary Tables 1 and 8) (26). These results suggested that there are distinct different genetic profiles between the FSS and 97th percentile control groups.
Plachy et al (74) reported that there are 14 genes with missense mutations that have been identified in 33 participants with severe FSS using whole-exome sequencing. As Plachy et al reported, the authors chose 33 participants with severe FSS (their height –2.5 SD or less in both the patients and the shorter parent), which was suggested as a monogenic condition (74). Whole-exome sequencing analysis was then performed for the participants with severe FSS (74). In addition, among these 33 participants with severe FSS, 21 (64%) of them were born small for gestational age. And among these 33 participants, 23 (70%) of them were classified with GH deficiency. In our study, we recruited participants with FSS of Han Chinese ancestry. The selection criteria for FSS was (1) (a) height less than the third percentile (Supplementary Fig. 7) (2, 26) (b) the parents' (father and/or mother) height less than the third percentile (3), (c) bone age appropriate for chronologic age (4), (d) normal onset of puberty (5), (e) normal annual growth rate, and (6) (f) normal results of clinical biochemistry examination. Excluded individuals were those with all other abnormal morphology and karyotyping results, abnormal bone age or puberty stage, or abnormal serum or plasma levels of clinical biochemistry examinations for the GH-IGF1 axis, thyroid function, or precocious puberty (Supplementary Fig. S1) (26). Therefore, the FSS participant characteristics may account for the differences between these 2 studies. Furthermore, we found that genetic variants in 9 of these 14 genes were associated with FSS risk between our 1163 participants with FSS and 1071 control participants (the 75th height percentile) (Supplementary Table 9 and Supplementary Fig. 8) (26). These 9 genes include COL11A1, FLNB, FGFR3, TRHR, COL2A1, HMGA2, ACAN, IGF1R, and NF1. These results suggested that, in addition to mutations in these genes, there might also be a combined effect of multiple genetic variants (polygenic effect) for developing the FSS risk.
The main limitations of our study are the small number of individuals with FSS since these individuals’ body heights are below the third percentile of the population. We may have small effect sizes. Nevertheless, our study is the first comprehensive investigation of FSS genetic profile. Ten novel and 9 reported GWAS human height-related SNPs were revealed to be associated with FSS risk. These 10 novel genetic SNPs exhibited cumulative effect as genetic predisposition score and facilitated FSS risk prediction. A height reduction regression tendency in the general population was also observed between cumulative genetic predisposition score and human height regardless of gender. Our work found the FSS genetic characteristics and their bone metabolic association with the height-reduction effect.
Supplementary Information
Supplementary Text
Supplementary Figure 1–8
Supplementary Table 1–9
Lin, Ying-Ju et al. (2020), To Be or Not To Be Short: Genetic Architecture Associated with Familial Short Stature, v4, Dryad, Dataset, https://doi.org/10.5061/dryad.vhhmgqnpk
(https://datadryad.org/stash/share/k3ezX3L4ShiSQxWkNCUfgkFe_Dp5JBmLvZkRpi1XcYk)
Abbreviations
- AUC
area under the curve
- CI
confidence interval
- FSS
familial short stature
- GWAS
genome-wide association studies
- GH
growth hormone
- IGF-1
insulin-like growth factor
- LD
linkage disequilibrium
- OR
odds ratio
- ROC
receiver operating characteristic
- SNP
single nucleotide polymorphism
Acknowledgements
We thank the National Center for Genome Medicine of the National Core Facility Program for Biotechnology, Ministry of Science and Technology, for technical and bioinformatics support. We also thank Drs. Kuan-Teh Jeang and Willy W.L. Hong for technical help and suggestions.
Financial Support: This study was supported by grants from the China Medical University (CMU108-MF-32, CMU108-S-15, and CMU108-S-17), the China Medical University Hospital (DMR-109–145, DMR-109–188, and DMR-109–192), and the Ministry of Science and Technology, Taiwan (MOST 105-2314-B-039 -037 -MY3, MOST 106-2320-B-039 -017 -MY3, and MOST 108-2314-B-039-044-MY3). We are grateful to Health Data Science Center, China Medical University Hospital for providing administrative, technical, and funding support.
Additional Information
Disclosure Summary: The authors have no conflicts of interest to disclose.
Ying-Ju Lin and Chi-Fung Cheng contributed equally to this work.
Data Availability
Restrictions apply to the availability of data generated or analyzed during this study to preserve patient confidentiality or because they were used under license. The corresponding author will on request detail the restrictions and any conditions under which access to some data may be provided.
References
World Medical A. World Medical Association Declaration of Helsinki: ethical principles for medical research involving human subjects. JAMA. 2013;310(20):2191–2194.
