


Abstract
The increased incidence of thyroid cancer globally over the past several decades is principally attributed to small, indolent papillary thyroid cancers. A possible concomitant increase in thyroid cancer-specific mortality remains debated.
The changes in thyroid cancer incidence and incidence-based mortality were assessed using a large population-based cohort over an 18-year period.
A retrospective analysis of all thyroid cancers reported in the California Cancer Registry was performed (2000–2017). Age-adjusted incidence and incidence-based mortality rates were analyzed using a log-linear model to estimate annual percent change.
We identified 69 684 individuals (76% female, median age 50 years) diagnosed with thyroid cancer. The incidence of thyroid cancer increased across all histological subtypes (papillary, follicular, medullary, and anaplastic) and all tumor sizes. The incidence increased from 6.43 to 11.13 per 100 000 person-years (average increase 4% per year; P < 0.001) over the study period. Thyroid cancer-specific mortality rates increased on average by 1.7% per year (P < 0.001). The increased mortality rates were greater in men (2.7% per year, P < 0.001) and patients with larger tumors (2-4 cm) (3.4% per year, P < 0.05).
Data from this statewide registry demonstrate that the incidence of thyroid cancer is increasing, and that this phenomenon is not restricted to small papillary thyroid cancers. Rising incidence in thyroid cancers of all sizes with concurrent increase of incidence-based mortality in men and those with larger tumors suggest a true increase in clinically significant disease.
The rising incidence of thyroid cancer in recent decades has been reported globally across multiple epidemiologic studies. In the United States, the incidence of thyroid cancer is increasing by 3.6% per year on average, mainly driven by cases of papillary thyroid cancer (PTC) (1). This phenomenon has been mainly attributed to the detection of small, indolent tumors on imaging studies (2, 3). Such patients with indolent disease may experience better outcomes and improved quality of life when they are managed nonoperatively, as opposed to the conventional treatment paradigm involving surgery and possibly radioactive iodine (2–5). Despite general acknowledgement that thyroid cancer overdiagnosis (the incidental discovery of “illness” that is almost certain not to cause poor health or decreased life expectancy) is occurring worldwide, the fact that large thyroid cancers are found more frequently today suggests that overdiagnosis alone may not fully explain the observed trends (1, 6–8).
Analyses of thyroid cancer–specific mortality rates in the United States have yielded inconsistent results. Although 1 study showed a stable rate of thyroid cancer mortality of approximately 0.5 deaths per 100 000 from 1973 to 2002 (2), another study using the same database reported a 1.1% increase in mortality per year overall and 2.9% increase per year for PTC from 1994 to 2013 (1).
Utilizing a large statewide cancer registry, we analyzed trends in thyroid cancer incidence and incidence-based mortality in California from 2000 to 2017. The objective of our study was to ascertain changes in incidence and mortality as a function of clinical and demographic factors as well as tumor size, histology, and stage.
Materials and Methods
Data source
The California Cancer Registry is a mandatory cancer reporting system capturing all healthcare institutions across the state of California in the United States. Thyroid ancer (all subtypes) diagnoses entered into the registry from January 1, 2000 to December 31, 2017 were abstracted using International Classification of Disease for Oncology, 3rd Edition (ICD-O-3) code C73. Cases were classified according to histological subtypes (ICD-0 histological codes): PTC (8050, 8260, 8340–8344, 8450–8460), follicular thyroid cancer (8290, 8330–8335), medullary thyroid cancer (8345, 8510–8513), and anaplastic thyroid cancer (8020–8035). Tumor size was recorded as Extent of Disease-10 codes from 2000–2003 and as Collaborative Staging codes from 2004–2017. Individual-linked mortality data, including cause of death, were obtained from the National Center for Health Statistics and the California Department of Public Health, Center for Health Statistics. The study was approved by the University of California, Los Angeles Institutional Review Board and the California Committee for the Protection of Human Subjects.
Statistical analysis
Overall incidence and incidence-based mortality were calculated over the full study period. In addition, annual incidences were calculated as the number of thyroid cancer diagnoses over the total annual California population, as recorded by the United States Census Bureau. Annual incidence-based mortality rates were calculated as number of thyroid cancer deaths in California divided by the total population of California obtained from annual census data collected by the American Community Survey, an annual national survey sampling a representative, randomized subset of the US population. Patients were stratified into subgroups on the basis of demographic variables and tumor characteristics (histological subtype, staging, and size) at time of diagnosis. Poorly differentiated thyroid cancers were grouped as “other” histological subtype. All rates were age-adjusted to the 2000 California census population and expressed per 100 000 person years. Unknown tumor characteristics were calculated and reported separately from known values.
Trends in overall incidence and incidence-based mortality were examined by calculating their average annual percent change (APC). The average APC represents the extent of change in incidence and mortality rates over the full study period. A log-linear model was used to estimate the average APC of incidence-based mortality, stratifying by age and time to death following diagnosis. Values with P < 0.05 were used to determine statistical significance.
Results
The cohort comprised 69 684 individuals (76.3% female, 78.2% Caucasian) with thyroid cancer (Table 1). The median age at diagnosis was 50 years (interquartile range [IQR], 38–61 years). PTC was the most common histological subtype (87.8%), followed by follicular (7.2%) and medullary (1.8%) thyroid cancers. Within the study period, 2562 thyroid cancer-specific deaths occurred. The majority of deaths (75.2%) were observed in patients over the age of 60. Although PTC was the most commonly diagnosed subtype, thyroid cancer–specific mortality was more evenly distributed across multiple histological subtypes: papillary (45.2%), anaplastic (21.6%), and follicular (11%).
Thyroid Cancer Incidence (2000–2017) and Incidence-Based Mortality (2000–2017)
| Incidence | Incidence-Based Mortality | |||||||
|---|---|---|---|---|---|---|---|---|
| Thyroid Cancer | Papillary Thyroid Cancer | Thyroid Cancer | Papillary Thyroid Cancer | |||||
| Cases, No (%) | Ratea (95%CI) | Cases, No (%) | Ratea (95%CI) | Deaths, No (%) | Ratea (95%CI) | Deaths, No (%) | Ratea (95%CI) | |
| Overall | 69684 (100) | 10.06 (9.99-10.14) | 61203 (100) | 8.86 (8.79–8.94) | 2562 (100) | 0.34 (0.33-0.36) | 1157 (100) | 0.16 (0.15–0.16) |
| Sex | ||||||||
| Male | 16546 (23.7) | 4.68 (4.61-4.75) | 13845 (22.6) | 3.94 (3.87–4) | 1039 (40.6) | 0.27 (0.26-0.29) | 506 (43.7) | 0.13 (0.12–0.15) |
| Female | 53138 (76.3) | 15.42 (15.29-15.55) | 47358 (77.4) | 13.78 (13.65-13.9) | 1523 (59.4) | 0.41 (0.39-0.43) | 651 (56.3) | 0.18 (0.16–0.19) |
| Race | ||||||||
| White | 54506 (78.2) | 10.55 (10.46-10.63) | 47868 (78.2) | 9.29 (9.21–9.37) | 1981 (77.3) | 0.36 (0.34-0.37) | 911 (78.7) | 0.16 (0.15–0.17) |
| Black | 2694 (3.9) | 5.5 (5.29-5.71) | 2151 (3.5) | 4.41 (4.22–4.59) | 127 (5.0) | 0.24 (0.2-0.29) | 41 (3.5) | 0.08 (0.05–0.1) |
| Asian | 11276 (16.2) | 11.65 (11.43-11.87) | 10118 (16.5) | 10.52 (10.31-10.72) | 449 (17.5) | 0.39 (0.35-0.43) | 201 (17.4) | 0.18 (0.15–0.2) |
| Other b | 1208 (1.7) | 3.75 (3.54-3.97) | 1066 (1.7) | 3.31 (3.12–3.51) | NRc | NRc | NRc | NRc |
| Ethnicity | ||||||||
| Hispanic | 18843 (27) | 7.12 (7.02-7.23) | 16916 (27.6) | 6.42 (6.33–6.52) | 642 (25.1) | 0.21 (0.19-0.23) | 346 (29.9) | 0.11 (0.1–0.12) |
| Non-Hispanic | 50841 (73) | 11.55 (11.45-11.65) | 44287 (72.4) | 10.1 (10.01-10.19) | 1920 (74.9) | 0.4 (0.38-0.42) | 811 (70.1) | 0.17 (0.16–0.18) |
| Age at Diagnosis, year | ||||||||
| <20 | 1433 (2.1) | 0.77 (0.73-0.81) | 1254 (2.0) | 0.68 (0.64–0.71) | NRc | NRc | NRc | NRc |
| 20–39 | 18061 (25.9) | 9.32 (9.18-9.45) | 16586 (27.1) | 8.56 (8.43–8.69) | 73 (2.8) | 0.01 (0.01-0.01) | 33 (2.9) | 0.01 (0–0.01) |
| 40–59 | 30504 (43.8) | 17.5 (17.3-1 7.69) | 27548 (45.0) | 15.8 (15.61-15.99) | 563 (22) | 0.08 (0.07-0.09) | 291 (25.2) | 0.04 (0.04–0.05) |
| 60–79 | 17210 (24.7) | 20.06 (19.76-20.36) | 14233 (23.3) | 16.59 (16.32-16.87) | 1316 (51.4) | 0.17 (0.16-0.18) | 622 (53.8) | 0.08 (0.08–0.09) |
| 80+ | 2476 (3.6) | 11.89 (11.43-12.36) | 1582 (2.6) | 7.6 (7.23–7.97) | 607 (23.7) | 0.08 (0.07-0.09) | 209 (18.1) | 0.03 (0.02–0.03) |
| Thyroid Cancer Characteristics At Diagnosis | ||||||||
| Histological subtype | ||||||||
| Papillary | 61203 (87.8) | 8.86 (8.79-8.94) | 1157 (45.2) | 0.16 (0.15-0.16) | ||||
| Follicular | 5044 (7.2) | 0.72 (0.7-0.74) | 282 (11.0) | 0.04 (0.03-0.04) | ||||
| Medullary | 1250 (1.8) | 0.18 (0.17-0.19) | 172 (6.7) | 0.02 (0.02-0.03) | ||||
| Anaplastic | 705 (1.0) | 0.09 (0.09-0.1) | 554 (21.6) | 0.07 (0.07-0.08) | ||||
| Other d | 1482 (2.1) | 0.2 (0.19-0.22) | 397 (15.5) | 0.05 (0.05-0.06) | ||||
| Papillary Thyroid Cancer, SEER Historic Stage A | ||||||||
| Localized | 43478 (62.4) | 6.26 (6.21-6.32) | 38219 (62.4) | 5.51 (5.46–5.57) | 243 (9.5) | 0.03 (0.03-0.04) | 128 (11.1) | 0.02 (0.01–0.02) |
| Regional | 20940 (30.0) | 3.06 (3.02-3.1) | 19677 (32.2) | 2.89 (2.84–2.93) | 683 (26.7) | 0.09 (0.08-0.1) | 432 (37.3) | 0.05 (0.05–0.06) |
| Distant | 3671 (5.3) | 0.51 (0.49-0.52) | 2220 (3.6) | 0.31 (0.3–0.32) | 1443 (56.3) | 0.19 (0.18-0.2) | 545 (47.1) | 0.07 (0.07–0.08) |
| Unknown e | 1595 (2.3) | 0.23 (0.22-0.24) | 1087 (1.8) | 0.16 (0.15–0.17) | 193 (7.5) | 0.03 (0.02-0.03) | 52 (4.5) | 0.01 (0.01-0.01) |
| Papillary Thyroid Cancer, Tumor size, cm | ||||||||
| ≤1 | 21530 (30.9) | 3.09 (3.05-3.13) | 20861 (34.1) | 2.99 (2.95–3.03) | 104 (4.1) | 0.01 (0.01-0.02) | 77 (6.7) | 0.01 (0.01-0.01) |
| >1 to ≤2 | 18638 (26.7) | 2.71 (2.67-2.75) | 17429 (28.5) | 2.54 (2.5–2.57) | 180 (7.0) | 0.02 (0.02-0.03) | 137 (11.8) | 0.02 (0.02-0.02) |
| >2 to ≤4 | 16630 (23.9) | 2.42 (2.39-2.46) | 14016 (22.9) | 2.05 (2.02–2.09) | 560 (21.9) | 0.07 (0.07-0.08) | 347 (30.0) | 0.05 (0.04–0.05) |
| >4 | 7894 (11.3) | 1.13 (1.1-1.15) | 5281 (8.6) | 0.77 (0.74–0.79) | 1089 (42.5) | 0.15 (0.14-0.15) | 392 (33.9) | 0.05 (0.05–0.06) |
| Unknown e | 4992 (7.2) | 0.71 (0.69-0.73) | 3616 (5.9) | 0.52 (0.5–0.54) | 629 (24.6) | 0.08 (0.08-0.09) | 204 (17.6) | 0.03 (0.02–0.03) |
Abbreviations: CI, confidence interval; NR, Not Represented; SEER, Surveillance, Epidemiology, and End Results.
aRates were calculated as number of cases or deaths per 100 000 person years and age adjusted to the 2000 California standard population.
bIncludes American Indian, Native or Pacific Islander, and two or more races
cNot Represented (not enough data for analysis)
dIncludes other specified and poorly differentiated thyroid cancer
eIncludes values which are missing from the data or unknown at time of diagnosis.
The overall thyroid cancer incidence ranged from 6.43 to 11.13 per 100 000 person-years with an increase of 10.06 diagnoses (95% CI, 9.99–10.14) per 100 000 person-years observed from 2000 to 2017 (Table 1). The average annual incidence of thyroid cancer in women was 15.42 (95% CI, 15.29–15.55) diagnoses per 100 000 person years, and that of men was 4.68 (95% CI, 4.61–4.75) diagnoses per 100 000 person years. Analysis of APC showed that incidence rates rose, on average, 4% per year (P < 0.001) over the study period (Supplemental Table 1: Trends in Annual Thyroid Cancer Incidence) (9). The incidence rate peaked at 12.73 (95% CI, 12.38–13.07) in 2015 and then declined slightly (Fig. 1A). Incidence rates increased similarly among men (APC, 4%; P < 0.001) and women (APC, 4.1%; P < 0.001) and across all racial and ethnic groups (Supplemental Table 1: Trends in Annual Thyroid Cancer Incidence). Papillary, medullary, and anaplastic histological subtypes showed increasing incidence rates (Fig. 1A), while the incidence of follicular carcinoma remained stable. Further analysis of PTCs by stage (localized, regional, distant) demonstrated increasing incidence rates of localized (APC, 4.1%; P < 0.001) and regional cancers (APC, 6%; P < 0.001) but not distant cancers (APC, −1.7%; P < 0.05) (Fig. 1B). Significant increases in thyroid cancer incidence rates were observed across PTC sizes: ≤ 1 cm (APC, 5.8%; P < 0.001), 1–2 cm (APC, 5.4%; P < 0.001), 2–4 cm (APC, 3.9%; P < 0.001), and > 4 cm (APC, 4.6%; P < 0.001) (Fig. 1C). In order to reduce the effects of arbitrary tumor size cutoff values in our analysis, we further subdivided tumor size by 0.5 cm increments, which approximates tumor size as a continuous variable (Fig. 2). The pattern of increasing incidence rates was evident across all tumor sizes with the greatest increase in tumors ≤ 2 cm.
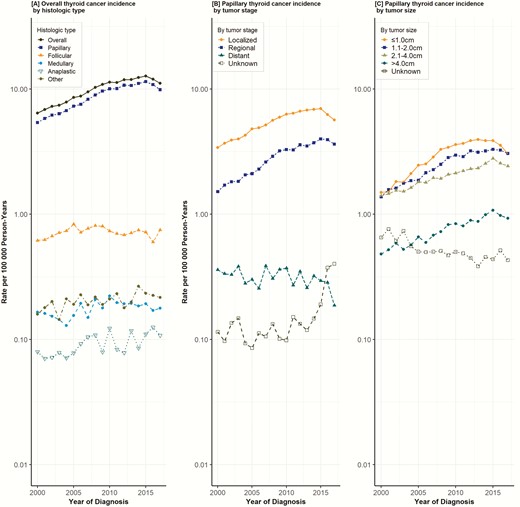
Trends in annual thyroid cancer incidence. Data points represent the incidence rate (cases per 100 000 person-years). The slope of the lines represents the annual percent change (APC). All rates were adjusted to the 2000 California standard population.
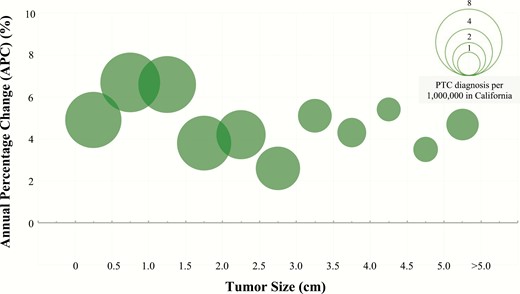
Annual percent change (APC) of papillary thyroid cancer incidence by tumor size. Changes in PTC incidence rates represented by APC. Each bubble represents number of PTC diagnoses per 1 000 000 in California from 2000 to 2017.
With respect to incidence-based mortality, an average annual mortality rate of 0.34 deaths (95% CI, 0.33–0.36) per 100 000 person-years was observed over the study period (Table 1). Although men accounted for 23.7% of new thyroid cancer cases, they accounted for 40.6% of thyroid cancer deaths. Overall thyroid cancer incidence–based mortality increased 1.7% per year (P < 0.001) (Supplemental Table 2: Trends in Annual Thyroid Cancer Mortality Rates) (9). Mortality rates increased for both papillary (APC 2.3%; P < 0.001) and anaplastic thyroid cancers (APC 3.5%; P < 0.001) but decreased for medullary thyroid cancers (APC −3.8%; P < 0.05) while follicular thyroid cancer remained stable (Fig. 3A). An increase in thyroid cancer mortality rates among men was observed (APC, 2.7%; P < 0.001) (Fig. 3B). Increasing mortality rates were observed among PTCs with regional stage (APC, 6%; P < 0.05), but no changes in PTC incidence-based mortality were found among localized or distant stages (Fig. 3C). Increased mortality rates were observed in PTC diagnosed at tumor sizes: 1–2 cm (APC, 5.1%; P < 0.05), 2–4 cm (APC, 3.4%; P < 0.05) and > 4 cm (APC, 2.6%; P < 0.05) (Fig. 3D). The mortality rates of women and patients with tumors ≤ 1 cm remained stable (Supplemental Table 2: Trends in Annual Thyroid Cancer Mortality Rates).
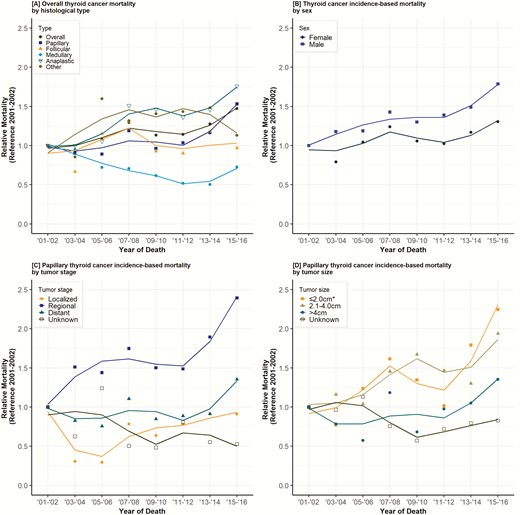
Trends in annual thyroid cancer mortality rates. Data points represent the mortality rate (deaths per 100 000 person-years). The slope of the lines represents the annual percent change (APC). All rates were adjusted to the 2000 California standard population. *Tumor sizes ≤ 1.0 cm and 1.1–2.0 cm combined due to the small number of reported cases in each group.
Discussion
In this analysis of almost 70 000 thyroid cancer patients in California from 2000 to 2017, we found that 2 components have contributed to the rising incidence of thyroid cancer. We observed that the bulk of new thyroid cancer diagnoses were attributed to small PTCs ≤ 2 cm in diameter. At the same time, we observed a consistent increase in the diagnosis of larger and more aggressive tumors, which correlated with increases in incidence-based mortality amongst men and patients with larger (> 1 cm) tumors.
Previous studies have examined whether the recent rising incidence of thyroid cancer can be attributed to overdiagnosis or if there is a true biological increase of this disease. In 2006, Davies et al initially reported that tumors ≤ 1 cm accounted for 49% of all PTC diagnoses throughout the United States from 1988 to 2002 using data from the Surveillance, Epidemiology and End Results (SEER) program (which represents 10% of the US population, as drawn from California [San Francisco and Oakland], Connecticut, Georgia [Atlanta only], Hawaii, Iowa, Michigan [Detroit only], New Mexico, Utah, and Washington [Seattle and Puget Sound region]). Mortality during this time remained stable as reported by National Vital Statistics data (2). In 2014, the same investigators reported that from 2008 to 2009, the incidence of tumors ≤ 1 cm (39%) was greater than that of tumors > 2 cm (33%) (3). Both studies suggested that increased rates of imaging and utilization of fine-needle aspiration biopsy contributed to the more frequent detection of smaller tumors.
In contrast, we observed increased disease incidence at all PTC sizes, including larger tumors > 4 cm, which would be difficult to attribute to radiographic discovery alone, a finding that has been reported by other groups (1, 6, 8, 10–12). It is possible that over the years we have been discovering a reservoir of preexisting cancers; however, if so, we would expect stabilization of thyroid cancer incidence which we has not occurred. A previous analysis of the California Cancer Registry from 1988–2009 reported increasing incidences of thyroid cancer amongst all demographic categories, tumor characteristics, and socioeconomic strata, leading the authors to posit potential environmental triggers of thyroid cancer (8). This older analysis of the California Cancer Registry did not analyze mortality rates (8). Similarly, our study found universal increases in thyroid cancer incidence when stratified by racial and ethnic groups. Considering the socioeconomic differences and impact on access to care with higher rates of screening, the universal increasing incidence rates are unlikely to be attributed to increasing diagnostic imaging alone. The reported increased incidence rates in that previous analysis may in part have contributed to the recent rise in thyroid cancer-specific mortality. This observation may be a result of the long-term survival typically found amongst thyroid cancer patients. This is further supported by pronounced increasing mortality amongst those greater than 60 years of age, with cancer diagnosis peaking at age 50. Yet, similar to our findings, prior studies using other databases have also found increasing incidence-based mortality over recent decades. Lim et al reported overall increased incidence-based mortality (a relative increase of 1.1%) using the SEER database from 1994–2013 (1). However, upon subgroup analysis, they found that only smaller tumors demonstrated significant increased incidence-based mortality. Our findings demonstrate overall increasing incidence-based mortality primarily in association with large tumors. Furthermore, the increased incidence of tumors > 1 cm paralleled trends in mortality from these tumors. These findings suggest a true biological explanation for the rise in thyroid cancer incidence across all sizes in our cohort.
The increasing incidence of thyroid cancer can potentially be explained by complex environmental, dietary, and/or genetic factors (13). The most well-studied risk factor of thyroid cancer is ionizing radiation exposure at a young age. A possible contributing factor to our observed trends in incidence is cumulative radiation exposure from the increase in medical and dental imaging procedures conducted in the United States (14). A recent study reported the potential role of obesity in contributing to the rising incidence of PTCs. From 1995 to 2015, obesity was shown to confer 1.3 times increased risk of PTC and greater than 5 times increased risk of developing larger PTCs (> 4 cm) (15). Another study reported that increased nitrate levels in drinking water was associated with increased thyroid cancer rates in men but not women (16). High biomarkers of nitrate, a reported thyroid-specific disruptor associated with a higher risk of thyroid cancer, has been found among agricultural communities (17). Given California’s large agricultural industry, these environmental exposures are a possible explanation for the increased incidence and mortality in our cohort. Our findings also show the incidence of follicular thyroid cancer has remained stable, while some studies analyzing the SEER database (which captures an incomplete subset of California) have reported increasing rates of follicular thyroid cancer (1, 6, 18). In addition to the differences in the cohort studies, it is possible that varying environmental exposures may account for potential regional variation of differing histopathologic profiles in the United States. A recent review of geographic influences in the global rise of thyroid cancer reported that the rise in overall global mortality and incidence of larger tumor may be in part associated with world-wide iodine intake (19). Increased iodine intake particularly in higher income countries may contribute to the increase of BRAFV600E-mutated PTC cases (20).
Increasing thyroid cancer–specific mortality despite better treatment and earlier diagnosis may be partly explained by a shift in the molecular profile of PTCs. With increasing incidence rates of thyroid cancer, the presence of a BRAFV600E mutation has greatly risen relative to other common genetic profiles such as KRAS and RET/PTC3 rearrangements and has also been associated with a more aggressive phenotype (20, 21). One retrospective, multicenter study reported that BRAFV600E-positive PTCs are associated with higher mortality compared to BRAF wild type PTCs (hazard ratio 2.66; 95% CI, 1.30–5.3) (22). The increasing incidence of these more aggressive mutations may contribute to an increase in thyroid cancer-specific mortality. This study also reported that amongst BRAFV600E-mutated PTCs, greater increases in mortality were observed for cancers of larger size, advanced stage, and those with distant metastases. Similarly, our analysis found increases in thyroid cancer–specific mortality rates amongst patients with regional and distant disease but not those with localized disease. The changing molecular profile of thyroid cancer to more aggressive mutations could account for increasing mortality, particularly in advanced-stage disease.
The California Cancer Registry encompasses a large and culturally diverse population living within a geographically heterogeneous land mass. Strengths of this population-based cohort study are its size and use of comprehensively linked data containing demographics, diagnostic, treatment, and outcome information within this unique dataset. Analysis of incidence-based mortality ensures appropriate attribution of deaths to thyroid cancer. The previously discussed findings by Lim et al have been critiqued as arising from misattribution of a small number of unrelated deaths to thyroid cancer when in fact they were attributable to treatment of the thyroid cancer itself (23). In addition, the aforementioned commentary suggests possible attribution bias, or the incorrect assignment of death due to thyroid cancer when in fact it was unrelated (23). However, because cancer databases are fundamentally reliant on correct coding of causes of death, the questions of misattribution cannot be answered either affirmatively or negatively.
We observed stabilizing thyroid cancer incidence from 2015–2017. While the cause of this is uncertain, increased awareness of the problem of overdiagnosis may have played a role (24, 25). Our study was limited by a relatively narrow follow-up period, small number of cases in some subgroups, and an inability to compare absolute mortality rates, which were difficult to assess within discrete datasets due to the study design. We accounted for these limitations by stratifying our analysis by time to death from diagnosis and reporting trends in disease-specific mortality as relative rates due to the relatively low occurrence of mortality in thyroid cancer patients. We acknowledge possible errors in estimates from the last year of the study period due to potential delayed reporting from healthcare institutions.
In summary, the increased incidence of thyroid cancer in California is due in part to more sensitive detection and diagnosis of what is usually an indolent disease. However, this data also suggests a true biological rise, as evidenced by the concurrent rise in incidence and incidence-based mortality amongst larger PTCs. Future investigations are warranted to better understand the complex etiologies, contributors, and risk factors for this increasing trend.
Abbreviations
- APC
annual percent change
- CI
confidence interval
- IQR
interquartile range
- SEER
Surveillance, Epidemiology, and End Results
- PTC
papillary thyroid cancer
Acknowledgments
Financial Support: None
Additional Information:
Disclosure Summary: The authors have nothing to disclose.
Data Availability: All data generated or analyzed during this study are included in this published article or in the data repositories listed in References.
References
