


Abstract
Type 2 diabetes has been linked with an increased risk of Alzheimer’s disease (AD). Studies on the association between metformin use and AD have reported conflicting results.
To investigate whether metformin use modifies the association between diabetes and incident, clinically verified AD.
Nested case-control study.
All community-dwelling people in Finland.
Cases were all community-dwelling Finns with AD diagnosed from 2005 to 2011 and with diabetes diagnosed ≥ 3 years before AD (n = 9862). Cases were matched with up to 2 control persons by age, sex, and diabetes duration (n = 19 550).
Cumulative metformin exposure was determined from reimbursed dispensings over a 10- to 16-year period. Adjusted odds ratios (aORs) were calculated using conditional logistic regression to estimate associations, with adjustment for potential confounders.
A total of 7225 (73.3%) cases and 14528 (74.3%) controls received metformin at least once. Metformin use (ever use) was not associated with incident AD (aOR 0.99; 95% confidence interval [CI], 0.94–1.05). The adjusted odds of AD were lower among people dispensed metformin for ≥ 10 years (aOR 0.85; 95% CI, 0.76–0.95), those dispensed cumulative defined daily doses (DDDs) of < 1825–3650 (aOR 0.91; 95% CI, 0.84–0.98) and > 3650 DDDs (aOR 0.77; 95% CI, 0.67–0.88), and among persons dispensed an average of 2 g metformin daily (aOR 0.89; 95% CI, 0.82–0.96).
In this large national sample we found no evidence that metformin use increases the risk of AD. Conversely, long-term and high-dose metformin use was associated with a lower risk of incident AD in older people with diabetes.
There are 44 million people living with dementia worldwide and dementia is the second leading cause of death in people aged 70 years and older (1). Alzheimer’s disease (AD) results in considerable individual, carer, and societal burden (2). Type 2 diabetes has been linked to the development of AD in experimental, clinical, and epidemiological studies (3, 4). A systematic review of 20 observational cohort studies demonstrated that the risk of AD was 56% greater in people with type 2 diabetes than in individuals without diabetes (4). Hypothesized mechanisms for this association include brain insulin resistance and impaired insulin signaling, hyperglycemia, hypoglycemic episodes, inflammation, vascular changes, and impaired amyloid metabolism (5, 6). An estimated 826 000 AD cases worldwide are directly attributable to type 2 diabetes, and thus a 10% reduction in the incidence of diabetes could potentially prevent 81 000 people developing AD (7). The number of people with type 2 diabetes who develop AD will likely grow as prevalence of diabetes continues to increase, particularly in low- and middle-income countries (8). Research is needed to elucidate factors that modify or ameliorate the association between type 2 diabetes and AD risk.
Most clinical guidelines recommend metformin as the first-line medication for type 2 diabetes because it is low-cost, generally well-tolerated, and not associated with weight gain. Metformin is the most commonly prescribed glucose-lowering medication in North America, the United Kingdom, and Australia (9, 10, 11). Metformin is a biguanide that reduces gluconeogenesis in the liver and improves insulin resistance, resulting in lower plasma glucose levels (12). Metformin likely crosses the blood-brain barrier and has been implicated in neuropathological changes suggestive of improved cognitive function in some, but not all, preclinical studies (13). Altered gut microbiota composition, which may play a role in AD pathogenesis, has been observed among metformin users (14, 15).
Recent meta-analyses investigating the relationship between metformin use and dementia reported conflicting results (13, 16, 17). None of the meta-analyses undertook subgroup analyses for people with AD. Three previous longitudinal studies have investigated associations between metformin use and AD (18, 19, 20) and 2 of these studies (18, 19) linked metformin use with an increased risk of AD. However, methodological limitations with existing studies, which included the use of non-population based samples, comparison groups which may not reflect real world treatment practices, inadequate adjustment for the duration of diabetes or prior medication use, and limited exploration of dose-response relationships, may have influenced study findings. Furthermore, in several studies the primary outcome of dementia diagnosis was not verified by neurologists or geriatricians using objective clinical criteria and not all studies accounted for the latency period for AD.
Comprehensive data are therefore needed to explore the possible impact of metformin use on the development of AD. The objective of this study was to investigate whether metformin use modifies the association between diabetes and incident, clinically diagnosed AD.
Materials and Methods
Study design and data source
A nested case-control study was undertaken within the national Medication Use and Alzheimer’s disease (MEDALZ) study (21). The MEDALZ study includes linked register data for all Finns diagnosed with AD from January 2005 to December 2011, who were community-dwelling at diagnosis (n = 70 718), and up to 4 comparison persons without AD (n = 282 862), matched by age, sex, and region of residence. People with AD were identified using the Special Reimbursement Register, which includes details of all persons with AD in Finland who are eligible for reimbursement for antidementia medications. Finnish guidelines recommend antidementia medications to be prescribed to all people diagnosed with AD unless contraindicated (22). All submissions for special reimbursement are reviewed to ensure the diagnosis of AD is consistent with predefined diagnostic criteria derived from the National Institute of Neurological and Communicative Diseases and Stroke/Alzheimer’s Disease and Related Disorders Association (NINCDS-ADRDA) and the Diagnostic and Statistical Manual of Mental Disorders, 4th Edition (DSM-IV) criteria (21). Written confirmation of the AD diagnosis from a geriatrician or neurologist must also be provided. Data available for MEDALZ participants include all subsidized medication purchases obtained from the national Prescription Register (1995–2012), clinically verified chronic diseases from the Special Reimbursement Register (1972–2012), hospitalizations listed in the Hospital Discharge register (1972–2012) and socioeconomic and mortality data from Statistics Finland (2005–2012).
Identification of cases
Cases were MEDALZ participants who had been diagnosed with diabetes at least 3 years before a clinically verified diagnosis of AD. The 3-year lag period was applied to avoid protopathic bias as the oncoming diagnostic process of AD increases the incidence of comorbid diagnoses and impacts medication use (23). Persons with entitlement to higher reimbursement of diabetes medication granted by the Special Reimbursement Register and/or purchases of diabetes medication (defined using the World Health Organization Anatomical Therapeutic Chemical (ATC) classification code (24) A10, excluding guar gum (A10BX01)) were considered to have diabetes. Diabetes diagnosis date was defined either as the date of entitlement for reimbursement or the first purchase of diabetes medication, whichever occurred first.
Identification of controls
At the date of AD diagnosis (index date), each case was matched with up to 2 community-dwelling persons with diabetes identified from the MEDALZ study. Controls were matched by age (±1 year), sex, and diabetes duration (±1 year). Controls could not have received a diagnosis of AD or reimbursement for a dementia medication for at least 3 years after the index date. We excluded 184 persons diagnosed with AD for whom no controls were identified.
Exposure(s) of interest
Metformin use from 1995 was determined from the national Prescription Register. Metformin use was determined using ATC codes A10BA02, A10BD02, A10BD03, A10BD05, A10BD07, A10BD08, and A10BD10 (24), and categorized as no use, use only during the 3-year lag period, or any use prior to the lag period. We considered cases and controls who received metformin only during the lag period in a separate category because they did not have sufficient duration of use prior to the index date but were not never users to reduce risk of protopathic bias as described above.
Among those who received metformin between 1995 and the lag date (ever users), we also determined: (A) cumulative duration of use, (B) the cumulative number of metformin defined daily doses (DDDs) received during the observation period and (C) the cumulative number of metformin DDDs divided by the cumulative duration of metformin use in days to assess dose-response relationships. We applied the PRE2DUP drug use model to the national Prescription Register to construct metformin exposure time periods (25). Agreement between PRE2DUP modeled use and oral diabetes medication use reported in a patient interview was very good (kappa 0.97; 95% CI, 0.93–1.00) (26). Cumulative duration of use was derived by summing durations of all metformin use periods for each person and categorized as use prior to the lag period of < 1, 1 to < 5, 5 to <10, or ≥ 10 cumulative years; cumulative dose received was categorized as > 0–365, > 365–1825, > 1825–3650 and > 3650 DDDs; and cumulative DDDs divided by cumulative duration of use was categorized as > 0–0.5, > 0.5–1.0, and > 1.0 DDDs/day. The DDD for metformin is 2 g (24).
Potential confounders
Region of residence at the index date was determined using information from the Social Insurance Institute of Finland. Occupational social class was determined using information from Statistics Finland (21). History of renal disease, cardiovascular disease, and psychiatric disorders were identified from the Finnish Special Reimbursement Register and the Hospital Discharge Register (27). Prescription Register data were screened from 1995 to identify dispensings for antihypertensives or HMG Co-A reductase inhibitors (statins). Psychiatric disorders were assessed using register data from 1972 until 5 years prior to the index date, since increased point estimates for associations between psychiatric disorders and diagnosis of AD have been observed with a lag period of less than 5 years (23). All other covariates were determined using data recorded until the start of the 3-year lag period.
Details of all reimbursed diabetes medications (excluding metformin) between 1995 and the index date were extracted using the ATC codes outlined in our online supplementary material (27). The PRE2DUP method was applied to construct separate variables for use of sulfonylureas, insulin, and other diabetes medications. Sulfonylureas and insulin were reimbursed throughout the entire study period.
Statistical analyses
Analyses were undertaken using SAS v9.4 (SAS Institute, Cary, North Carolina). Chi square tests were used to compare categorical variables. Wilcoxon rank sum tests were used to compare continuous variables with skewed distributions. Conditional logistic regression models were used to estimate unadjusted and adjusted odds ratios (aORs) and 95% confidence intervals (CIs) for associations between metformin and incident AD, adjusting for potential confounders described above. In each adjusted model, the same method to categorize metformin exposure was applied to adjust for use of sulfonylurea, insulin and other diabetes medications. Correlations between medication exposure and potential confounders were assessed with Spearman’s correlation, which showed no evidence of collinearity.
Because the lookback period for ascertaining medication use among people diagnosed with AD in 2011 was longer than for people diagnosed in 2005, we undertook sensitivity analyses in which the lookback period commenced 10 years prior to the index date. The 3-year lag period was also maintained, meaning medication exposure was assessed over a 7-year window for all participants. We conducted additional sensitivity analyses in which all models were stratified by age at the index date (categorized as < 75, 75 to < 85, > 85 years), age at diabetes diagnosis (< 60, 60 to < 80, > 80 years) and duration of diabetes at the index date (< 5, 5 to <10, > 10 years).
Ethical considerations
Formal ethical approval was not required in Finland in accordance with Finnish legislation because study participants were not contacted and pseudonymized data were supplied for analysis. The study was registered with the Monash University Human Research Ethics Committee.
Results
Overall, 9862 people with AD and 19 550 matched controls were included, with a median age of 81 years and median diabetes duration of 10 years (Table 1). Cases were more likely to have atrial fibrillation and coronary artery disease, and less likely to have received antihypertensive therapy than controls, although the overall prevalence of cardiovascular diseases was similar among cases and controls. Psychiatric disorders were slightly more common among cases than controls.
Characteristics of Individuals Diagnosed With Alzheimer’s Disease (cases) and Individuals Without Alzheimer’s Disease (controls)
| Characteristic | Individuals With AD (N=9862) | Individuals Without AD (N=19 550) | P Value |
|---|---|---|---|
| Age, median years (IQR) a | 80.6 (76.3–84.4) | 80.6 (76.3–84.4) | Matched |
| Female, n (%) a | 5892 (59.7%) | 11 702 (59.9%) | Matched |
| Duration of diabetes, median years (IQR) a | 9.9 (6.2–14.8) | 9.8 (6.1–14.7) | Matched |
| History of cardiovascular disease, n (%) b | 7734 (78.4%) | 15495 (79.3%) | 0.097 |
| Stroke | 1028 (10.4%) | 2049 (10.5%) | 0.880 |
| Hypertension | 5701 (57.8%) | 11872 (60.7%) | <0.001 |
| Coronary artery disease | 3576 (36.3%) | 6829 (34.9%) | 0.024 |
| Chronic heart failure | 1812 (18.4%) | 3546 (18.1%) | 0.621 |
| Atrial fibrillation | 1259 (12.8%) | 2246 (11.5%) | 0.001 |
| Peripheral arterial disease | 449 (4.6%) | 910 (4.7%) | 0.694 |
| History of renal failure, n (%) b | 61 (0.6%) | 131 (0.7%) | 0.604 |
| History of psychiatric disorders, n (%) c | 576 (5.8%) | 975 (5.0%) | 0.002 |
| Depression | 406 (4.1%) | 679 (3.5%) | 0.006 |
| Bipolar disorder | 55 (0.6%) | 75 (0.4%) | 0.034 |
| Schizophrenia | 206 (2.1%) | 370 (1.9%) | 0.252 |
| Antihypertensive (ever use), n (%) b | 8742 (88.6%) | 17560 (89.8%) | 0.002 |
| HMG Co-A reductase inhibitor (statin), ever use, n (%) b | 5416 (54.9%) | 10619 (54.3%) | 0.329 |
| Diabetes medication use | |||
| Sulfonylurea | |||
| Ever use, n (%) | 7254 (73.6%) | 14254 (72.9%) | 0.239 |
| Cumulative duration of use, median years (IQR) | 5.4 (2.6–8.1) | 5.3 (2.5–8.0) | 0.127 |
| Cumulative dose, median, DDDs (IQR) | 2050 (765–3900) | 2050 (750–3850) | 0.705 |
| Insulin | |||
| Ever use, n (%) | 2902 (29.4%) | 5931 (30.3%) | 0.107 |
| Cumulative duration of use, median years (IQR) | 5.7 (2.4–8.8) | 5.6 (2.3–8.6) | 0.122 |
| Cumulative dose, median DDDs (IQR) | 1641 (525–3375) | 1613 (525–3338) | 0.867 |
| Other diabetes medication d | |||
| Ever use, n (%) | 1608 (16.3%) | 3195 (16.3%) | 0.934 |
| Cumulative duration of use, median years (IQR) | 0.9 (0.2–2.7) | 0.9 (0.2–2.5) | 0.921 |
| Cumulative dose, median DDDs (IQR) | 200 (67–600) | 200 (67–567) | 0.992 |
| Glitazones | |||
| Ever use, n (%) | 521 (5.3%) | 1130 (5.8%) | 0.080 |
| Cumulative duration of use, median years (IQR) | 0.8 (0.3–1.9) | 0.9 (0.3–1.9) | 0.764 |
| Cumulative dose, median DDDs (IQR) | 243 (75–616) | 243 (84–597) | 0.952 |
Abbreviations: AD, Alzheimer’s disease; DDD, defined daily dose; IQR, interquartile range.
a Determined at the index date
b Determined using all available history up to 3 years prior to index date
c Determined using all available history up to 5 years prior to index date
d Including glitazones
Metformin was dispensed to 7225 (73.3%) cases and 14 528 (74.3%) controls at least once. Among those receiving metformin, the cumulative duration of use was similar among controls (median 3.8 years; interquartile range (IQR), 1.4–6.9) and cases (median 3.7 years; IQR, 1.4–6.8) (P = 0.243). People with AD received a lower cumulative metformin dose over the study period (median 875 DDDs [IQR, 275–1880] versus 925 DDDs [IQR, 300–1050]; P = 0.003).
No overall association between metformin use (ever use) and AD was observed (aOR 0.99; 95% CI, 0.94–1.05) (Table 2, Fig. 1). Examination of the cumulative duration of metformin use showed ≥ 10 years exposure was associated with a reduced odds of AD (aOR 0.85; 95% CI, 0.76–0.95). In the model assessing cumulative dose received, doses of < 1825–3650 and > 3650 DDDs were associated with a reduced odds of AD (aOR 0.91; 95% CI, 0.84–0.98 and aOR 0.77; 95% CI, 0.67–0.88, respectively). There was some evidence of a dose-response relationship, with exposure > 1.0 DDDs/day (ie, > 2 g/day on average) associated with a reduced odds of AD (aOR 0.89; 95% CI, 0.82–0.96). Conversely, metformin use during the lag period only was associated with an increased odds of AD in all models, with a similar measure of association observed each time, and low-dose exposure of > 0–0.5 DDDs/day was associated with increased odds of AD (Table 2, Fig. 1).
Associations Between Metformin Use and Incident Alzheimer’s Disease
| Unadjusted Analyses | Adjusted Analysesa | |||||
|---|---|---|---|---|---|---|
| Metformin Exposure | Individuals With AD (N=9862), n (%) | Individuals Without AD (N=19 550), n (%) | OR (95% CI) | P Value | OR (95% CI) | P Value |
| Any use | ||||||
| No use | 1839 (18.7%) | 3625 (18.5%) | Reference | Reference | ||
| Use only during lag periodb | 798 (8.1%) | 1397 (7.2%) | 1.14 (1.05–1.25) | 0.002 | 1.12 (1.03–1.23) | 0.008 |
| Yes | 7225 (73.3%) | 14528 (74.3%) | 0.99 (0.94–1.05) | 0.812 | 0.99 (0.94–1.05) | 0.775 |
| Cumulative duration of use | ||||||
| No use | 1839 (18.7%) | 3625 (18.5%) | Reference | Reference | ||
| Use only during lag periodb | 798 (8.1%) | 1397 (7.2%) | 1.15 (1.06–1.25) | 0.001 | 1.13 (1.03–1.23) | 0.007 |
| >0 to <1 year | 1456 (14.8%) | 2815 (14.4%) | 1.05 (0.98–1.13) | 0.168 | 1.05 (0.97–1.13) | 0.206 |
| 1 to <5 years | 2980 (30.2%) | 6038 (30.9%) | 0.99 (0.93–1.05) | 0.787 | 0.98 (0.92–1.05) | 0.599 |
| 5 to <10 years | 2290 (23.2%) | 4574 (23.4%) | 0.99 (0.92–1.05) | 0.682 | 0.98 (0.92–1.05) | 0.652 |
| ≥10 years | 499 (5.1%) | 1101 (5.6%) | 0.85 (0.76–0.95) | 0.004 | 0.85 (0.76–0.95) | 0.005 |
| Cumulative dose received | ||||||
| No use | 1839 (18.7%) | 3625 (18.5%) | Reference | Reference | ||
| Use only during lag periodb | 798 (8.1%) | 1397 (7.2%) | 1.15 (1.06–1.26) | 0.001 | 1.13 (1.03–1.23) | 0.007 |
| >0–365 DDDs | 2166 (22.0%) | 4149 (21.2%) | 1.07 (1.00–1.14) | 0.054 | 1.07 (1.00–1.14) | 0.069 |
| >365–1825 DDDs | 3187 (32.3%) | 6395 (32.7%) | 0.99 (0.94–1.05) | 0.803 | 0.98 (0.92–1.05) | 0.563 |
| >1825–3650 DDDs | 1578 (16.0%) | 3299 (16.9%) | 0.92 (0.86–0.99) | 0.026 | 0.91 (0.84–0.98) | 0.010 |
| >3650 DDDs | 294 (3.0%) | 685 (3.5%) | 0.79 (0.69–0.90) | <0.001 | 0.77 (0.67–0.88) | <0.001 |
| Cumulative DDDs/cumulative duration of use | ||||||
| No use | 1839 (18.7%) | 3625 (18.5%) | Reference | Reference | ||
| Use only during lag periodb | 798 (8.1%) | 1397 (7.2%) | 1.15 (1.05–1.25) | 0.002 | 1.12 (1.03–1.22) | 0.009 |
| >0–0.5 DDDs/day | 1721 (17.5%) | 3104 (15.9%) | 1.11 (1.04–1.19) | 0.002 | 1.11 (1.04–1.19) | 0.002 |
| >0.5–1.0 DDDs/day | 4344 (44.1%) | 8849 (45.3%) | 0.98 (0.92–1.03) | 0.382 | 0.97 (0.92–1.03) | 0.320 |
| >1.0 DDDs/day | 1160 (11.8%) | 2575 (13.2%) | 0.89 (0.83–0.96) | 0.003 | 0.89 (0.82–0.96) | 0.003 |
Abbreviations: AD, Alzheimer’s disease; CI, confidence interval; DDD, defined daily dose; OR, odds ratio.
a Adjusted for region of residence, occupational social class, cardiovascular disease (stroke, hypertension, coronary artery disease, chronic heart failure, atrial fibrillation, peripheral arterial disease), psychiatric disorders (bipolar, schizophrenia, depression), renal disease, statin use, antihypertensive use, and use of sulfonylureas, insulin and other diabetes medications.
b Individuals who were only exposed to metformin during the 3-year lag period
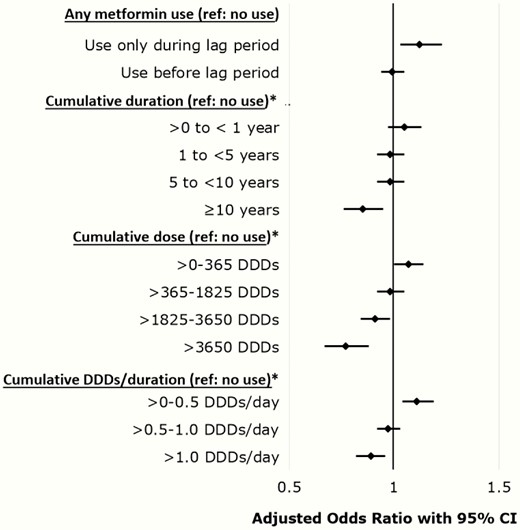
Adjusted odds ratios with 95% confidence intervals for multivariable models evaluating associations between metformin use and incident Alzheimer’s disease.
Similar results were obtained from sensitivity analyses where the lookback period to assess metformin exposure commenced 10 years prior to the index date (Table 3). The shorter lookback period meant we were unable to assess associations between cumulative duration of metformin use ≥ 10 years and cumulative dose > 3650 DDDs. Stratification by age at index date, age at diabetes diagnosis, and duration of diabetes resulted in small sample sizes across each category of metformin exposure and no significant associations were observed (results not shown).
Sensitivity Analyses for the Associations Between Metformin Use and Incident Alzheimer’s Disease With Lookback Period to Assess Metformin Exposure Commencing 10 Years Prior to Index Date for All Cases and Controls
| Unadjusted Analyses | Adjusted Analysesa | |||||
|---|---|---|---|---|---|---|
| Metformin Exposure | Individuals With AD (N=9862), n (%) | Individuals Without AD (N=19 550), n (%) | OR (95% CI) | P Value | OR (95% CI) | P Value |
| Any use | ||||||
| No use | 1977 (20.1%) | 3871 (19.8%) | Reference | Reference | ||
| Use only during lag periodb | 828 (8.4%) | 1446 (7.4%) | 1.14 (1.05-1.24) | 0.003 | 1.12 (1.03-1.22) | 0.011 |
| Yes | 7057 (71.6%) | 14233 (72.8%) | 0.98 (0.93-1.04) | 0.514 | 0.98 (0.93-1.04) | 0.489 |
| Cumulative duration of use | ||||||
| No use | 1977 (20.1%) | 3871 (19.8%) | Reference | Reference | ||
| Use only during lag periodb | 828 (8.4%) | 1446 (7.4%) | 1.14 (1.05-1.24) | 0.002 | 1.12 (1.03-1.22) | 0.011 |
| >0 to <1 year | 1421 (14.4%) | 2756 (14.1%) | 1.04 (0.97-1.12) | 0.301 | 1.03 (0.96-1.11) | 0.404 |
| 1 to <5 years | 3026 (30.7%) | 6172 (31.6%) | 0.98 (0.92-1.03) | 0.393 | 0.97 (0.91-1.03) | 0.252 |
| 5 to <10 years | 2610 (26.5%) | 5305 (27.1%) | 0.96 (0.90-1.03) | 0.226 | 0.96 (0.90-1.02) | 0.212 |
| Cumulative dose received c | ||||||
| No use | 1977 (20.1%) | 3871 (19.8%) | Reference | Reference | ||
| Use only during lag periodb | 828 (8.4%) | 1446 (7.4%) | 1.14 (1.05-1.24) | 0.002 | 1.12 (1.03-1.22) | 0.009 |
| >0-365 DDDs | 2118 (21.5%) | 4050 (20.7%) | 1.06 (1.00-1.13) | 0.072 | 1.06 (0.99-1.14) | 0.075 |
| >365-1825 DDDs | 3342 (33.9%) | 6737 (34.5%) | 0.98 (0.93-1.04) | 0.468 | 0.97 (0.91-1.03) | 0.322 |
| >1825 DDDs | 1597 (16.2%) | 3446 (17.6%) | 0.89 (0.83-0.95) | 0.001 | 0.88 (0.82-0.95) | <0.001 |
| Cumulative DDDs/cumulative duration of use c | ||||||
| No use | 1977 (20.1%) | 3871 (19.8%) | Reference | Reference | ||
| Use only during lag periodb | 828 (8.4%) | 1446 (7.4%) | 1.14 (1.05-1.24) | 0.002 | 1.12 (1.03-1.22) | 0.011 |
| >0-0.5 DDDs/day | 1639 (16.6%) | 3010 (15.4%) | 1.08 (1.02-1.16) | 0.017 | 1.08 (1.01-1.16) | 0.022 |
| >0.5-1.0 DDDs/day | 4103 (41.6%) | 8257 (42.2%) | 0.98 (0.93-1.04) | 0.503 | 0.98 (0.92-1.04) | 0.420 |
| >1.0 DDDs/day | 1315 (13.3%) | 2966 (15.2%) | 0.87 (0.81-0.93) | <0.001 | 0.86 (0.80-0.93) | <0.001 |
Abbreviations: AD, Alzheimer’s disease; CI, confidence interval; DDD, defined daily dose; OR, odds ratio.
a Adjusted for region of residence, occupational social class, cardiovascular disease (stroke, hypertension, coronary artery disease, chronic heart failure, atrial fibrillation, peripheral arterial disease), psychiatric disorders (bipolar, schizophrenia, depression), renal disease, statin use, antihypertensive use, and use of sulfonylureas, insulin and other diabetes medications.
b Individuals who were only exposed to metformin during the 3-year lag period
c Metformin defined daily dose (DDD) is 2 g
Discussion
The main finding of this large national study was that there was no association between metformin use (ever use) and incident AD. Conversely, long-term and high-dose metformin use was associated with lower risk of incident AD. These results provide important reassurance to clinicians and people living with type 2 diabetes regarding the safety of this widely prescribed first-line medication.
Our findings are in contrast to a previous Taiwanese matched cohort study in which people newly diagnosed with type 2 diabetes who received ≥ 90 days of metformin at baseline had a greater risk of AD compared to nonusers (adjusted hazard ratio (aHR) 2.13; 95% CI, 1.20–3.79) (19). Our findings are also contrary to a previous UK case-control study that reported an increased risk of AD among people receiving 10 to 29 metformin prescriptions (aOR 1.47; 95% CI, 1.03–2.09) or ≥ 60 prescriptions (aOR 1.71; 95% CI, 1.12–2.60) compared with nonusers (18). However, there was no evidence of a consistent dose response effect, as the odds of AD in people who received 30 to 59 prescriptions was not significantly different from nonusers. Only 9% of people included in the UK study were diagnosed with type 2 diabetes, and the cases and controls were not matched on diabetes status, which likely further influenced findings. Our finding of no increased risk of incident AD with metformin use is similar to a previous retrospective cohort study involving 71 433 Taiwanese people with type 1 or type 2 diabetes that showed that neither metformin monotherapy nor combination therapy were associated with incident AD (20).
In the present study, metformin initiation in the 3-year lag period was consistently associated with an increased AD risk. This is consistent with a growing body of evidence highlighting the importance of using an appropriate time window in studies evaluating risk factors for incident dementia and is unlikely to reflect causality (23). Prodromal symptoms of AD lead to increased contact with healthcare personnel and screening for alternative causes of cognitive impairment, such as changes in blood glucose levels, thus increasing the likelihood of metformin initiation. This finding has implications for the interpretation of previous studies examining associations between metformin use and AD, where there was no lag period between metformin exposure and the primary outcome. It is therefore possible that findings in previous studies may be explained by a medication exposure assessment period too close to the measurement of the outcome of AD.
Cumulative use of metformin ≥ 10 years, cumulative exposure of ≥ 1825 DDDs (ie, ≥ 3650 g metformin) and average daily doses of ≥ 2 g metformin over a 10- to 16-year period were associated with a reduced risk of AD. Potential explanations for these associations may include a reduction in the macrovascular complications of type 2 diabetes, or reduced inflammation and enhanced neuronal survival consistent with results of some preclinical studies (13, 28). Although encouraging, we suggest the associations in the present study are interpreted cautiously because there were relatively few people exposed to long-term or high-dose metformin in our study. Metformin prescribing is also contentious in older people with mild to moderate renal impairment (29). In a recent primary care study involving Finns with type 2 diabetes, 77 (32.6%) of the 236 participants aged ≥ 70 years had an estimated glomerular filtration rate less than 60 mL/min/1.73 m2 (30). Glycemic control, renal function, obesity, and perceived risk of adverse events impact treatment decisions in older people with type 2 diabetes. Metformin may be preferentially prescribed in people with type 2 diabetes who are overweight or obese because it does not cause weight gain. We do note, however, that some of the comorbidities that we adjusted for in the adjusted analyses likely served as proxies and may have captured some of the anticipated variation in body mass index (BMI). We adjusted for renal failure but were not able to assess each participant’s renal function or glycemic control, nor how these may have influenced medication exposure.
This national study assessed cumulative metformin exposure over a 10- to 16-year lookback period for each participant and identified important dose-response relationships with long-term and high-dose metformin use. This is a key methodological strength but still may not reflect lifetime metformin use for all people diagnosed with diabetes in midlife. Because persons with diabetes included in this study had to survive long enough to develop AD, the median age at diabetes diagnosis was higher than observed in a recent study of Finns newly diagnosed with type 2 diabetes (70 years versus 63 years) (31). However, protective associations between long-term metformin use and AD may be greater in people with type 2 diabetes at an earlier age. Results from a subgroup analysis of a cohort study showed that US veterans aged < 75 years at the time of diabetes diagnosis who received metformin monotherapy for at least 2 years had a lower risk of dementia compared with people who received sulfonylurea monotherapy (28). Two recent US studies that included people with type 2 diabetes who were aged 50 years and older also suggest metformin use may be associated with a reduced risk of dementia in comparison with sulphonylurea use in younger people (32, 33).
Our study has a number of strengths. The AD diagnoses were verified by neurologists or geriatricians using objective clinical criteria as described above and the positive predictive values were high. Metformin exposure was assessed in 4 different ways (ever use, cumulative duration, cumulative DDDs, and DDDs per day) over a 10- to 16-year look-back period to provide the most comprehensive evaluation of possible dose-response relationships between metformin use and development of AD to date. We were also able to control for use of other glucose-lowering medications during the study period. It is possible residual confounding still exists, however, and we recognize glycemic response to metformin use is variable (12). To reduce the risk of immortal time bias, we conducted sensitivity analyses in which the medication exposure period was restricted to 10 years before the index date for all participants and associations remained. However, the case-control design meant we were unable to restrict the study sample to people with newly-diagnosed diabetes or include only people newly initiated on glucose-lowering therapy. We accounted for diabetes duration, which is a key limitation of several previous studies, but it is possible that prior metformin use may have affected some of the disease or medication covariates adjusted for in this study. We adjusted for macrovascular complications such as stroke, coronary artery disease, and peripheral arterial disease that may influence diabetes treatment and development of AD, but we did not have information on lifestyle factors, BMI, nonpharmacological approaches to diabetes management or medications dispensed during inpatient hospital stays. We adjusted for renal failure, but lacked laboratory results needed to adjust for glycemic control and estimated glomerular filtration rate. People admitted to a long-term care facility (LTCF) during the study period were excluded because the Prescription Register does not include information about medications dispensed to residents of LTCFs. Before 2000, the Special Reimbursement Register did not record International Classification of Diseases codes specifying the type of diabetes diagnosed for an individual. However, the median age of 70 years at diabetes diagnosis suggests most people had type 2 diabetes. Residual confounding would also be minimized since people with early onset type 1 diabetes would likely be matched as people with AD and controls were matched on diabetes duration, and metformin is not indicated for treatment of type 1 diabetes.
Findings of this nationwide study suggest that metformin use is not associated with increased AD risk among community-dwelling older people with diabetes, which is contrary to previous studies. The apparent association with an increased AD risk in previous studies may be explained by an exposure assessment period too close to the outcome and/or inclusion of people without diabetes. These findings add to the growing body of evidence that choice of glucose-lowering medication, dose, and treatment duration in people with type 2 diabetes may be important in reducing the risk of dementia or delaying onset of symptoms. More population-based research using large registries with access to additional clinical information, such as renal function and glycemic control, is needed to explore associations in people with midlife diabetes treated with metformin and incident AD. Because metformin initiation immediately prior to AD diagnosis was associated with increased AD risk in our study, we also suggest latency periods are necessary in future observational studies evaluating risk factors for incident dementia.
Abbreviations
- AD
Alzheimer’s disease
- aOR
adjusted odds ratio
- BMI
body mass index
- CI
confidence interval
- DDD
defined daily dose
- IQR
interquartile range
- LTCF
long-term care facility
Acknowledgments
We gratefully acknowledge Ms CE Ooi for assistance with manuscript formatting.
Financial Support: JKS was supported by Australia’s National Health and Medical Research Council (NHMRC) Cognitive Decline Partnership Centre (GNT9100000) and an NHMRC Early Career Fellowship (APP1156439). JSB was supported by an NHMRC Boosting Dementia Research Leadership Scheme Fellowship (APP1140298).
Author Contributions: JKS and MK contributed equally to this work. Study concept: JKS, MK, JSB, SH; study design: all authors; data acquisition and analysis: JKS, MK, AMT, HT, AT, SH; interpretation of the data: all authors; wrote first draft of manuscript: JKS; critical review of manuscript for important intellectual content: all authors. All authors read and approved the final version of the manuscript. Guarantor: JKS
Additional Information
Disclosure Summary: HT, JT, and AT have participated in research projects funded by Janssen and Eli Lilly with grants paid to the institution where they were employed. JT has received personal fees from the Finnish Medicines Agency (Fimea), European Medicines Agency (EMA), Eli Lilly, Janssen-Cilag, Lundbeck, and Otsuka; and has received grants from the Stanley Foundation and Sigrid Jusélius Foundation. SH has received fees from Swedish Research Council. Other authors declare no conflicts of interest.
Data Availability: The data used for this study are not available for public access.
References
Author notes
Co-first authorship; these authors contributed equally to this work.
