


Abstract
Aging is accompanied by inhibited fat cell mobilization of fatty acids through lipolysis, which may contribute to decreased energy expenditure in elderly subjects. However, the influence of menstrual status is unknown.
To investigate the role of menstrual status on changes in lipolysis induced by aging.
A longitudinal investigation with a mean 13-year interval.
Ambulatory study at a clinical academic unit.
Eighty-two continuously recruited women between 24 and 62 years of age and with body mass index 21 to 48 kg/m2 at first examination. Twenty-nine women continued to have normal menstruation, 42 developed irregular menstruation/menopause, and 11 had a perimenstrual/menopausal phenotype already at the first examination.
Lipolysis measured as glycerol release from isolated subcutaneous fat cells incubated in vitro.
On average, body weight/body fat mass levels did not change over time. In all 3 groups, aging was associated with a similar decrease in spontaneous (basal) and catecholamine-stimulated lipolysis. The latter was due to decreased signal transduction through stimulatory beta adrenoceptors and increased alpha-2-adrenoceptor–mediated antilipolytic effects. Gene microarray data from adipose tissue at baseline and follow-up (n = 53) showed that a limited set of lipolysis-linked genes, including phosphodiesterase-3B, were altered over time, but this was independent of menstrual status. Fat cell size also decreased during aging, but this could not explain the decrease in lipolysis.
In women, the rate of fat cell lipolysis decreases during aging due to multiple alterations in spontaneous (basal) and catecholamine-induced lipolysis. This is independent of changes in menstrual status or fat cell size.
Introduction
Aging affects a plethora of body functions in older adults among which decreased energy expenditure is an important feature (1,2). Mobilization of fatty acids through hydrolysis of triglycerides (lipolysis) in fat cells is a key event in energy expenditure because it provides a source of energy in catabolic states and during physical/mental stress. Human fat cells display a specific hormonal regulation of lipolysis among species as reviewed (3–6). Only catecholamines and natriuretic peptides have acute and pronounced stimulatory effects in adults. As discussed, the catecholamine-induced signals to lipolysis differ between human and rodent adipocytes (3,4,7). In the latter, stimulatory beta-3 adrenoceptors, which activate the cyclic adenosine monophosphate (AMP) pathway, are most important. In humans, these effects are predominantly mediated by beta-1 and beta-2 adrenoceptors. In addition, human fat cells are equipped with antilipolytic alpha-2 adrenoceptors, which inhibit the cyclic AMP pathway. Thus, in human fat cells, the net effect of catecholamines on lipolysis is dependent of the balance between alpha- and beta-adrenoceptor–mediated signaling (7).
Few reports have addressed the influence of aging on fat cell lipolysis. In a small cross-sectional study in men, it was observed that noradrenaline-induced lipolysis was decreased in the elderly men owing to impaired beta-adrenoceptor–lipolytic effects (8). In another small but longitudinal study, decreased noradrenaline-stimulated lipolysis was observed over time (9). Although these studies suggest that aging impairs catecholamine-stimulated lipolysis due to changes in beta-adrenoceptor signaling, many questions remain to be answered. One is the possible effect of alpha-2-adrenoceptor signaling (3). Another important influencing factor in women is the development of menopause. When a perimenopausal/menopausal state is reached, the sex hormone levels are markedly altered. Sex hormones, in turn, have strong effects on lipolysis regulation as discussed (10). So far, the effect of menstrual status has only been investigated in cross-sectional studies, usually comparing younger women having regular menstruation with elderly women with irregular menstruation or having reached a perimenopausal or postmenopausal state (11–13). Conflicting results have been reported showing increased (11), decreased (12), or unchanged (13) fat cell lipolysis in women reaching menopausal status. These discrepancies may be due to the cross-sectional design and inherent difficulties to distinguish between age-specific and menstrual-specific effects. Finally, lipolysis rates are influenced by the cellular lipid content, reflected by fat cell size, as discussed (3,14). If the latter has an impact on lipolysis during aging is not known. In order to answer the questions above, we examined 82 women twice within approximately a 13-year interval. For the investigations, we used isolated fat cells obtained from the abdominal subcutaneous region and incubated them in vitro.
Methods
Subjects
The women (n = 82) were investigated twice between 2004 and 2019 with a 7- to 16-year interval (mean 13 years). The cohort was subdivided according to menstrual status at baseline and follow-up. One subgroup (n = 11) had irregular or no menstruation already at first examination. One group developed this phenotype during the course of the study (n = 42). A third group had regular menstruation at both examinations (n = 29). Some of the women were investigated previously for another purpose (9). Medication use at baseline was uncommon, and none were on antihypertensive or lipid-lowering therapies. At follow-up, one subject in each subgroup was on statin treatment (atorvastatin or simvastatin), and 2 women in the developing menopause subgroup were on beta blockers (metoprolol and bisoprolol). Metformin use was reported at the follow-up visit by 1 subject in the group with menopause at baseline and 2 among those developing menopause over time. The study was explained in detail to each woman and informed written consent was obtained. The study was approved by the regional board of ethics and is registered at clinicaltrials.gov as NCT02227043.
Procedures
The procedures have been detailed before (9). In brief, the women came to the laboratory in the morning after an overnight fast. They responded to questionnaires relating to physical activity and eating behavior Bulimic Investigatory Test, Edinburgh-A (BITE-A) as described previously (15). Height, weight, and circumferences of hip and waist were determined. A venous blood sample was obtained for routine clinical chemistry measures as described (16). Body fat content was determined by bioimpedance. Finally, a subcutaneous fat biopsy (about 1 gram of tissue containing 106 fat cells) was obtained from the umbilical area using needle aspiration with local anesthesia.
Adipose determinations
Lipolysis was examined as described (17). This assay is robust and has been used for 30 years (18). Detailed descriptions of how we perform and analyze lipolysis data have been published (8,9,17,18). In brief, adipose tissue was subjected to collagenase treatment to obtain isolated fat cells. These cells (about 1000 cells per vial) were incubated for 2 hours in the absence (basal) or presence of 10-fold increasing concentrations of noradrenaline (range 10-12 to 10-4 mol/L), isoprenaline (range 10-9 to 10-5 mol/L), or the phosphodiesterase-resistant cyclic AMP analog dibutyryl cyclic AMP (range 10-5 to 10-3 mol/L). The alpha-2A-adrenoceptor–mediated inhibition of lipolysis in relation to natural hormone effects cannot be determined using alpha-2 agonists such as clonidine. This is because it would require concomitant activation with noradrenaline (a combined alpha- and beta-adrenoceptor agonist). Instead, as was shown already in the 1980s (19,20), the difference between isoprenaline and noradrenaline is a valid estimate of the alpha-2A effect. After incubation, an aliquot of the medium was removed for analysis of glycerol, which is an endpoint of lipolysis. Values at maximum effective concentration of lipolytic agents were used. This concentration differs between subjects, making it most practical to only analyze the maximum effects instead of presenting individual concentration response curves (about 1300 curves in the present study). Unlike the other endpoint, fatty acids, glycerol is not re-utilized by fat cells to an important extent. One portion of the isolated fat cells was used for determination of mean fat cell size and weight as described and discussed in detail previously (21). There is no consensus how to express lipolysis rates. Herein we used the 2 most common denominators, which are per-weight unit and per number of incubated fat cells. The number of incubated fat cells was calculated as total lipid weight of the sample divided by mean fat cell weight. The same technical staff performed all the lipolysis experiments at both time points of the investigation. Our lipolysis assays and protocols are highly reproducible and remain stable over time as demonstrated in Fig. S1 (showing assay stability over the period 2004–2019) (all supplementary material and figures are located in a digital research materials repository (22)).
Gene microarrays
The amount of tissue available was too small to allow investigation of protein expression. However, in 53 women, sufficiently large samples of subcutaneous abdominal white adipose tissue were obtained (at both baseline and follow-up) to allow isolation of ribonucleic acid (RNA). Six of these women reported irregular/no menstruation, 20 had regular menstruation at both time points, and 27 had gone from regular to irregular/no menstruation, respectively. Total RNA was extracted from frozen white adipose tissue samples, and RNA quality was assessed and ensured using the Bioanalyzer (Agilent; Santa Clara, CA). Samples were then analyzed using the Affymetrix ClariomTM D arrays (Thermo Fisher Scientific; Waltham, MA); baseline transcriptomic data have been described in detail (9,23). In brief, amplified and biotinylated sense-strand deoxyribonucleic acid targets were generated from total RNA using the WT Plus Kit (Thermo Fisher, Waltham, MA). Measured 5.5 µg fragmented and biotinylated sense-strand deoxyribonucleic acid targets were hybridized to the arrays in a GeneChip Hybridization Oven (Thermo Fisher, Waltham, MA) 645 at 45°C for 16 to 18 hours. Arrays were washed and stained in a GeneChip Fluidics Station 450 prior to scanning in the Affymetrix GeneChip Scanner (Thermo Fisher, Waltham, MA). The data set is deposited at the Gene Expression Omnibus (GEO accession number: GSE126963; https://www.ncbi.nlm.nih.gov/geo/). Data were analyzed with packages available from Bioconductor. Normalization and calculation of gene expression were performed with the Robust Multichip Average expression measure using the oligo package (24). Prior to further analysis, a nonspecific filter was applied to include only coding genes with log2 (expression signal) >4.8 in at least 25% of all samples. After this filtering step, we obtained a list of 13 679 genes. Using a compiled list of 67 lipolysis genes (25), 61 of them were in the filtered gene list and used for downstream analysis. A limma package (26) was used to identify differentially the expressed lipolysis gene with a model to correct the batch effects and block for the subjects.
Statistics
Values are mean [standard deviation] in text or tables and individual in the figure. They were compared by 2-sided, paired t tests and single or multiple linear regression. A P value <0.05 was considered statistically significant. We estimated statistical power prior to termination of the study. We could detect an effect size of 0.3 for lipolysis in 30 paired samples with 80% power at P < 0.05.
Results
Clinical data with women who had stable menstruation throughout the study or changed from normal to irregular menstruation or menopause are shown in Table 1. In neither group did body mass index or body shape (waist-to-hip ratio) change during the study. At follow-up, there was a minor but significant reduction in body fat levels in the group retaining regular menstruation. While reported physical activity at baseline was similar, the group with regular menstruation showed a slight increase at follow-up. Eating behavior at baseline was similar between groups although the women entering menopause reported a small improvement. Some minor changes in glucose/lipid levels were observed at the follow-up investigations, but these could not be explained by addition of medications as very few subjects were on treatment with antidiabetic, antihypertensive, or lipid-lowering medications (see Methods).
Clinical Data on Women With Different Menstrual Dynamics
| Menstrual Dynamics | ||||||
|---|---|---|---|---|---|---|
| Regular Menstruation (n = 29) | Change From Regular to Irregular/Menopause (n = 42) | |||||
| Measure | First Exam | Second Exam | P Value | First Exam | Second Exam | P Value |
| Age, years | 31 ± 5 | 45 ± 6 | 42 ± 5 | 55 ± 5 | - | |
| Body mass index, kg/m2 | 33 ± 7 | 32 ± 8 | 0.07 | 32 ± 5 | 32 ± 7 | 0.77 |
| Body fat impedance, % | 50 ± 11 | 45 ± 12 | 0.03 | 48 ± 10 | 47 ± 12 | 0.37 |
| Waist-to-hip ratio | 0.89 ± 0.07 | 0.90 ± 0.08 | 0.64 | 0.92 ± 0.08 | 0.93 ± 0.09 | 0.32 |
| Physical activity | 1.7 ± 0.7 | 2.3 ± 0.6 | 0.0003 | 1.8 ± 0.7 | 1.9 ± 0.7 | 0.36 |
| BITE-A | 7.9 ± 4.9 | 7.3 ± 5.9 | 0.16 | 7.3 ± 5.7 | 5.1 ± 4.6 | 0.01 |
| P-glucose, mmol/L | 5.1 ± 0.4 | 5.5 ± 0.6 | 0.0003 | 5.4 ± 0.9 | 4.7 ± 0.8 | 0.53 |
| P-cholesterol, mmol/L | 4.7 ± 0.9 | 4.6 ± 0.8 | 0.53 | 4.6 ± 0.9 | 4.7 ± 0.8 | 0.53 |
| P-HDL cholesterol, mmol/L | 1.1 ± 0.2 | 1.4 ± 0.3 | <0.0001 | 1.3 ± 0.4 | 1.6 ± 0.4 | < 0.0001 |
| P-triglycerides, mmol/L | 1.3 ± 0.8 | 0.8 ± 0.4 | 0.002 | 1.1 ± 0.5 | 1.0 ± 0.5 | 0.16 |
| S-insulin, mU/L | 11 ± 6 | 10 ± 6 | 0.32 | 11 ± 5 | 12 ± 11 | 0.45 |
Values are mean ± SD. They were compared by paired t test.
Abbreviations: BITE-A, Bulimic Investigatory Test, Edinburgh-A; HDL, high-density lipoprotein; P, plasma (fasting); S, serum (fasting); SD, standard deviation.
The fat cell data for the 2 aforementioned subgroups are shown in Table 2. Similar effects of aging were observed in both groups. Basal and noradrenaline-induced rates of lipolysis were markedly reduced at the second examination irrespective of whether lipid weight or cell number was used as a denominator. Noradrenaline acts through prolipolytic beta adrenoceptors as well as antilipolytic alpha-2 adrenoceptors. When lipolysis was induced by the selective beta-adrenoceptor agonist isoprenaline or the cyclic AMP-analog dibutyryl cyclic AMP (acting at the level of protein kinase A), there was also a significant decrease in lipolysis rate over time in both groups when expressed per cell. However, when lipolytic rates were expressed per lipid weight, there was no effect of aging. We also examined the alpha-2 adrenoceptor antilipolytic activity as the ratio of isoprenaline divided by noradrenaline-stimulated lipolysis. This represents beta-adrenoceptor stimulation alone divided by beta plus alpha-2 stimulation and is independent of how the lipolysis rate is calculated (per cell or lipid weight). The higher the ratio, the stronger is the antilipolytic effect (a ratio of 1 indicates no antilipolytic action of noradrenaline). The alpha/beta ratio was markedly increased at the second examination in both groups. Finally, fat cell volume was smaller at the second examination compared with the first examination. Because fat mass did not decrease over time despite decreased fat cell volume, it is likely that fat cell number (not measured) had increased. For many statistically significant lipolysis results, the average effect size (1.0 minus ratio of after/before) was ≥ 0.3, thus within the limit for 80% statistical power.
Fat Cell Data in Women With Different Menstrual Dynamics
| Lipolysis Measure | Regular Menstruation (n = 29) | Change From Regular to Irregular Menstruation or Menopause (n = 42) | ||||
|---|---|---|---|---|---|---|
| First Exam | Second Exam | P Value | First Exam | Second Exam | P Value | |
| Basal/g lipid | 1.5 ± 0.9 | 0.7 ± 0.4 | <0.0001 | 1.2 ± 0.7 | 0.7 ± 0.4 | 0.003 |
| Basal/107 cells | 10.0 ± 7.8 | 3.0 ± 2.3 | <0.0001 | 8.7 ± 5.7 | 5.2 ± 4.3 | 0.001 |
| Noradrenaline/g lipid | 4.2 ± 2.0 | 2.4 ± 1.0 | <0.0001 | 3.2 ± 2.3 | 2.0 ± 1.1 | 0.008 |
| Noradrenaline/107 cells | 25.1 ± 10.9 | 10.2 ± 5.2 | <0.0001 | 20.5 ± 9.3 | 13.0 ± 10.0 | 0.0004 |
| Isoprenaline/g lipid | 5.3 ± 2.9 | 5.0 ± 2.5 | 0.13 | 5.0 ± 3.0 | 4.3 ± 2.0 | 0.17 |
| Isoprenaline/107 cells | 33.6 ± 14.3 | 20.4 ± 8.4 | <0.0001 | 30.1 ± 9.5 | 24.9 ± 15.5 | 0.006 |
| Dibutyryl cyclic AMP/g lipid | 5.0 ± 2.6 | 4.6 ± 2.5 | 0.10 | 4.5 ± 3.1 | 4.0 ± 2.0 | 0.38 |
| Dibutyryl cyclic AMP/107 cells | 29.7 ± 13.4 | 18.2 ± 7.0 | <0.0001 | 27.3 ± 9.4 | 22.8 ± 15.1 | 0.20 |
| Isoprenaline/noradrenaline | 1.4 ± 0.5 | 2.3 ± 1.0 | <0.0001 | 1.7 ± 0.6 | 2.5 ± 1.8 | 0.002 |
| Fat cell volume, picolitres | 701 ± 202 | 509 ± 219 | <0.0001 | 719 ± 204 | 644 ± 251 | 0.04 |
Values are mean ± SD and compared with paired t test. Lipolysis is expressed as glycerol release (µmoles/2 hours).
Abbreviations: AMP, adenosine monophosphate; g, grams; SD, standard deviation.
It is less likely that we had sufficient statistical power to make fully valid examinations of the small group of subjects having a perimenopausal/menopausal state at both examinations. Nevertheless, the findings were analyzed, and the outcome was similar as with the other 2 groups. Clinical data are shown in Table 3. Anthropometric measures did not change over time in a significant way, and the same was true for glucose, lipids, and insulin. The fat cell data are displayed in Table 4. When expressed per gram of lipid, no measured rates of lipolysis were significantly changed at the second examination. On the other hand, all rates of lipolysis expressed per cell were significantly lower at the second examination compared with the first examination. In this group, the alpha-2 adrenergic effect was not influenced by aging. There was a borderline significant decrease in fat cell volume by aging.
Clinical Data on Women With Irregular or No Menstruation at Both Examinations
| Measure (n = 11) | First examination | Second examination | P Value |
|---|---|---|---|
| Age, years | 43 ± 11 | 56 ± 11 | - |
| Body mass index, kg/m2 | 37 ± 8 | 32 ± 5 | 0.09 |
| Body fat by impedance, % | 55 ± 12 | 48 ± 9 | 0.10 |
| Waist-to-hip ratio | 0.95 ± 0.07 | 0.93 ± 0.09 | 0.19 |
| Physical activity | 1.9 ± 0.7 | 2.1 ± 0.8 | 0.51 |
| BITE-A | 5.9 ± 7.4 | 4 ± 3.9 | 0.32 |
| P-glucose, mmol/L | 5.8 ± 1.4 | 5.6 ± 0.6 | 0.63 |
| P-cholesterol, mmol/L | 4.6 ± 0.9 | 4.4 ± 0.9 | 0.48 |
| P-HDL cholesterol, mmol/L | 1.2 ± 0.5 | 1.4 ± 0.4 | 0.07 |
| P-triglycerides, mmol/L | 1.1 ± 0.5 | 0.9 ± 0.3 | 0.49 |
| S-insulin, mU/L | 12 ± 6 | 13 ± 14 | 0.90 |
Values are mean ± SD and compared by paired t test.
Abbreviations: BITE-A, Bulimic Investigatory Test, Edinburgh-A; HDL, high-density lipoprotein; P, plasma (fasting); S (fasting); SD, standard deviation.
Fat Cell Data in Women With Irregular or No Menstruation at Both Examinations
| Measure (n = 11) | First Exam | Second Exam | P Value |
|---|---|---|---|
| Basal, lipid | 1.5 ± 0.7 | 0.9 ± 0.5 | 0.08 |
| Basal/107 cells | 11.7 ± 7.8 | 4.9 ± 3.6 | 0.03 |
| Noradrenaline, g lipid | 3.4 ± 1.2 | 2.4 ± 1.1 | 0.06 |
| Noradrenaline, 107 cells | 25.3 ± 10.9 | 12.7 ± 7.6 | 0.01 |
| Isoprenaline, g lipid | 4.8 ± 1.1 | 4.3 ± 1.2 | 0.21 |
| Isoprenaline, 107 cells | 35.3 ± 12.6 | 22.4 ± 10.2 | 0.02 |
| Dibutyryl cyclic AMP/g lipid | 4.4 ± 1.4 | 3.9 ± 1.2 | 0.28 |
| Dibutyryl cyclic AMP/g107 cells | 32.5 ± 13.9 | 20.1 ± 9.7 | 0.04 |
| Isoprenaline/noradrenaline | 1.5 ± 0.6 | 2.4 ± 1.9 | 0.17 |
| Fat cell volume, picolitres | 807 ± 180 | 608 ± 266 | 0.06 |
Values are mean ± SD and compared by paired t test. Lipolysis is expressed as glycerol release (µmoles/2hours).
Abbreviations: AMP, adenosine monophosphate; g, grams; SD, standard deviation.
We subsequently investigated the role of fat cell size for the results. When lipolysis was expressed per fat cell number, the changes (second examination minus first examination) in basal and stimulated lipolysis correlated positively with changes in fat cell volume (Fig. 1). This might be expected because mean fat cell weight, which is included in the calculation of fat cell volume, was used when relating lipolysis to fat cell number. There was, on the other hand, no relationship to changes in fat cell volume when lipolysis was expressed per lipid weight or when the ratio of isoprenaline/noradrenaline was used (values not shown).
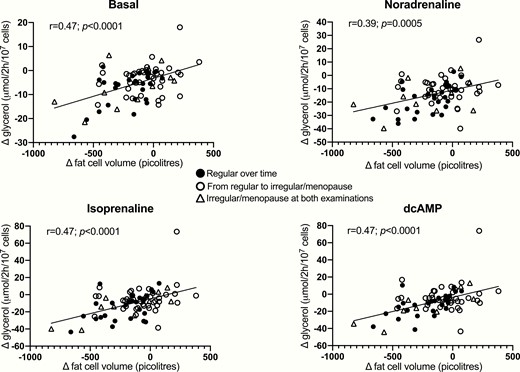
Relationship between changes over time in fat cell volume and lipolysis expressed per fat cell number. Data for second examination minus first examination were calculated and compared by linear regression analysis. Values for subgroups with different dynamics in menstrual status are shown.
The underlying causes for the age-related decrease in basal and hormone-stimulated lipolysis as well as the increase in alpha-2–mediated antilipolysis are unclear. As previously reported (9), we performed gene microarray analyses of white adipose tissue in a large subset of the women both in baseline and in follow-up samples (n = 53). When focusing on genes involved in lipolysis (9,25) in the entire sample set put together, there were very few significantly altered genes (Table S1). These included increased levels of PDE3B (encoding phosphodiesterase 3B, P = 0.012) and a borderline significant (P = 0.043–0.046) decrease in ADRA2A and ADRA2C (encoding the adrenoceptors alpha-2A and alpha-2C, respectively). Analyses in the 3 different subgroups based on menstrual status showed similar trends (all supplementary material and figures are located in a digital research materials repository (22)).
Discussion
This study addresses the role of some previously unknown factors influencing fat cell lipolysis during aging in women. We confirm earlier findings in men and women showing that basal and catecholamine-induced fat cell lipolysis decreases by aging and that the latter involves impaired beta-adrenoceptor signal transduction (8,9). We can also confirm that the attenuated beta-adrenergic effect is localized at or below the level of protein kinase A in the cyclic AMP signaling (8). The altered regulation of basal lipolysis is not well defined but may involve several intrinsic factors in adipose tissue as discussed (5,27).
As mentioned, catecholamine-induced lipolysis is determined by the balance between stimulatory beta effects and inhibiting alpha-2 effects. The latter effect has not been considered before. We demonstrate that this effect increases during aging, and this may also explain the decline in catecholamine-induced lipolysis. Which of the 2 alterations in adrenoceptor signaling is most important? The beta effect (represented by isoprenaline and dibutyryl cyclic AMP) was only evident when lipolysis was expressed per fat cell number. There was an overall decrease in fat cell size over time, but body weight or total fat mass did not decline. This indicates that the women had developed a more hyperplastic form of adipose tissue (increased number of smaller fat cells) during aging. This is a valid assumption as the adipose tissue is highly dynamic with relative high turnover of fat cells; approximately 10% of the total pool of fat cells is replaced with new cells per year (28). The temporal changes in lipolysis expressed per cell correlated strongly with the changes in fat cell volume, as was expected. No such relationship was, however, found for the alpha-2 effect or for lipolysis rates expressed per lipid weight. These 2 lipolysis measures are not dependent on fat cell size as regarding the expression of results. Taken together, these results argue that the decline in basal lipolysis in combination with an increased alpha-2 effect are the strongest driving forces behind decreased fat cell lipolytic activity during aging. We do not know which step(s) in alpha-2 signaling is/are sensitive to aging. Unfortunately, the methods to study receptor number as well as binding and coupling to G proteins require much larger adipose samples than could be obtained by needle aspiration. The same pertains for protein analyses. Nevertheless, some hints were given by our microarray analyses demonstrating changes in the gene expression of a limited set of key lipolytic proteins over time. In congruence with the lipolysis data, this included an increase in phosphodiesterase 3B, the enzyme responsible for hydrolyzing and inactivating cyclic AMP. The findings may help explain at least part of the age-dependent alterations in lipolysis. In contrast with the lipolysis data, a decrease in alpha-adrenoceptor genes was observed. However, it is possible that the relative changes in the expression of alpha-2 adrenoceptors and beta adrenoceptors underlie the increased alpha-2 effect observed with aging. Admittedly, we cannot exclude that changes in lipolysis over time are also determined by posttranslational mechanisms that are not necessarily reflected at the messenger RNA level.
The major strength of this study is that we are able to study the influence of changes in menstrual status on the decrease in lipolysis rate over a long observation time. Menopause impacts sex hormone production and, possibly, fat cell lipolysis (10). However, it is apparent that maintenance of regular menstruation or a transition to menopause is not important for the aging effect on lipolysis. Thus, while estrogen may have small effects on human fat cell lipolysis in vitro (10), our data suggest that female sex hormones in vivo do not have a major influence on adipocyte lipolysis. These observations were made on fairly large cohorts with sufficient statistical power. However, we observed similar results in a smaller group of women who were perimenopausal or menopausal already at baseline. Thus, our results suggest no or only a minor role of changes in the sex hormone profile over time for the aging-induced decrease in fat cell lipolysis observed in women. The age at first examination is not likely to be of importance. Although those with irregular menstruation/menopause at the beginning of the study were older than the others, the women who maintained regular menstruation or developed irregular or disappearance of menstruation had almost identical initial average ages.
When our data are put together, they suggest that in women a decrease in fat cell lipolysis rates over time is an intrinsic phenomenon that is not due to changes in body weight/fat mass, menstrual dynamics, or fat cell volume. They also suggest that the decline in lipolysis may be important for decreased energy expenditure with aging because a low lipolysis rate results in decreased delivery of fatty acids for peripheral oxidation. However, the relationship is probably complex as resting energy expenditure and rates of lipolysis are not correlated in cross-sectional examinations (9). As discussed (1,2), elderly subjects often lose weight although fat mass is maintained. Reduced energy expenditure has been suggested as one contributing factor to these changes in body composition. Perhaps decreased lipolysis and thereby less fatty acid availability could play a role in this respect. Admittedly, in our present cohort of middle-aged, weight-stable women, attenuated lipolysis was independent of (small) changes in percentage of fat mass. Thus, the possible role of age-induced lipolysis reduction on altered body composition has to be supported by longer follow-ups in individuals of more advanced age. Furthermore, changes in eating habits and/or physical activity are unlikely to explain the long-term changes in lipolysis.
There are some limitations with the present study. We did not measure gonadotropins (follicle-stimulating hormone/luteinizing hormone) or estradiol, which could have confirmed the postmenopausal state by a more objective measure. Moreover, given that menopause was the primary focus, only women were investigated and the effect of aging in men can therefore not be established. There is, on the other hand, no reason to believe that important gender differences are at hand with regard to decreased lipolysis during aging. Previous studies showed decreased catecholamine-induced lipolysis in elderly men owing to reduced basal and beta-adrenoceptor-mediated effects. It is likely that increased alpha-2 effects are also present in aging men (8). We only investigated subcutaneous adipose tissue. In theory, results might be different in other depots such as the viscera. For ethical reasons, visceral fat cells cannot be investigated in this type of study. Furthermore, there is no available hypothesis suggesting that various depots may respond differently to aging. From a quantitative perspective, fatty acid release from the largest adipose depot, the subcutaneous depot, is probably more important for energy expenditure than release from other regions. All direct lipolysis measures were performed in vitro. There is, however, previous indirect in vivo information in men comparing levels of catecholamines and glycerol in plasma during physical exercise (8). The latter findings indicated decreased in vivo lipolysis effects of catecholamines in elderly men. In the same male subjects, catecholamine-induced lipolysis in vitro was also reduced. Thus, in vivo and in vitro data are congruent in relation to the aging effect. Finally, natriuretic peptide-induced lipolysis may be influenced by age in a different manner than lipolysis stimulated by catecholamines. Unfortunately, we have no information about natriuretic peptide-induced lipolysis. The role of this system for lipolysis was not clear when our longitudinal study was started.
Can the aging effect be counteracted? Regular physical activity may be effective. Several studies have shown that catecholamine-stimulated lipolysis is improved by endurance exercise (29–31). A high physical activity is important for counteracting decline in energy expenditure during aging as discussed (32). Referring to the discussion above, such effects may not alter body fat content but counteract the loss of lean mass.
In summary, subcutaneous fat cell lipolysis decreases during aging in women due to a combination of lowering of basal lipolysis, impaired beta-adrenoceptor signaling, and increased alpha-2 adrenergic effects. An increase in PDE3B expression could also be involved. The change in lipolysis is probably an intrinsic effect of aging and not influenced in an important way by body weight/body fat status, fat cell size, life style changes, or menstrual status.
Abbreviations
Acknowledgments
We thank Katarina Hertel, Yvonne Widlund, Gaby Åström, Kerstin Wåhlén, and Elisabeth Dungner for excellent technical assistance. Array analyses were performed at the Bioinformatics and Expression Core facility (BEA) at Karolinska Institutet, Huddinge, Sweden.
Financial Support: The study was supported by grants from the Swedish Research Council, Novo Nordisk Foundation including the Tripartite Immuno-metabolism Consortium (TrIC) Grant Number NNF15CC0018486 and the MSAM Consortium NNF15SA0018346, CIMED, Swedish Diabetes Foundation, EFSD, Stockholm County Council, and the Diabetes Research Program at Karolinska Institutet.
Clinical Trial Information: Study Of Weight Development Over Time (SOWOT); registration no: NCT02227043.
Author Contributions: P.A. and M.R. designed the study and analyzed lipolysis results. H.G. analyzed microarray data. P.A. wrote the first version of the manuscript. All co-authors contributed to further writing and approved the final version of the manuscript. P.A. and M.R. are the guarantors of this work.
Additional Information
Disclosure Summary: None of the authors declare any conflict of interest.
Data Availability: The datasets generated during and/or analyzed during the current study are not publicly available but are available from the corresponding author on reasonable request.
References
