


Abstract
Hyponatremia is the most prevalent electrolyte disturbance in hospitalized patients. Previous studies have shown a seasonal variation of profound hyponatremia with higher prevalence during warmer months.
This study aimed at analyzing the seasonal prevalence and sex- and age-specific differences of hyponatremia in medical inpatients.
Nationwide cohort study from January 2009 and December 2015 using prospective administrative data.
Medical inpatients.
Diagnosis of hypoosmolar hyponatremia.
The primary outcome was the monthly alteration in hyponatremia prevalence. Secondary outcomes were the association of outdoor temperature with hyponatremia prevalence and differences among sex and age groups.
Of 2 426 722 medical inpatients, 84 210 were diagnosed with hypoosmolar hyponatremia, of whom 61% (n = 51 262) were female. The highest overall prevalence of hyponatremia was observed in July (4.5%, n = 8976); the lowest in December (2.7%, n = 6530). The overall prevalence of hyponatremia in women compared with men was higher by 58% (odds ratio [OR], 1.58; 95% confidence interval [CI], 1.56-1.60). The sex-specific difference was most pronounced in the warmest month of July (mean temperature 20.1°C (OR, 1.76; 95% CI, 1.68-1.84). We observed the strongest association between seasonality and hyponatremia in elderly (>80 years) female inpatients admitted during the month of July (OR, 2.40; 95% CI, 2.20-2.62]).
The prevalence of diagnosed hypoosmolar hyponatremia in medical inpatients increases during summer months with higher outdoor temperature. Elderly female inpatients were most susceptible to the seasonal rise in hyponatremia prevalence.
Hyponatremia is the most prevalent electrolyte disbalance, affecting 10% to 15% of hospitalized patients and is associated with a poor clinical outcome (1,–4). Predisposing risk factors for hyponatremia are a disease stress-related drive of arginine vasopressin (5, 6), heart failure, liver cirrhosis, or renal failure causing volume overload, dehydration with sodium loss (e.g., infection), or medications (e.g., diuretics, antidepressant). A meta-analysis of 81 studies including 147 948 participants found that already mild hyponatremia is significantly associated with overall mortality (7) and is associated with a worse prognosis in multimorbid patients (e.g., disease of the liver, heart, kidney, brain, lungs) (8,–11). Importantly, in-hospital health care providers are frequently faced with this burdensome electrolyte disorder and a season-dependent variation may alter in-hospital resource allocation accordingly.
A season-dependent variation in the hyponatremia prevalence has recently been described in the emergency department setting (12–15). In particular, the prevalence of profound hyponatremia has been associated with outdoor temperature and has been shown to be increased during summer months (12, 14). However, these studies focus on patients in the emergency department and information on medical inpatients are scarce. Thus, large-scale data are needed not only to validate previous findings from the emergency department setting, but also to identify nationwide epidemiological variations within hyponatremic medical inpatients. Furthermore, previous studies suggest that women and elderly patients are more susceptible toward developing hyponatremia (12, 14, 16–18). However, whether these associations alter throughout the year with changing outdoor temperature is poorly explored (12, 14).
Therefore, the aim of this study was to investigate in-hospital hyponatremia prevalence throughout the year stratified for sex and age groups.
Methods
Participants, data sources, and study variables
In this nationwide cohort study, we performed a cross-sectional analysis using prospective administrative data from January 1, 2009, to December 31, 2015, provided by the Swiss Federal Statistical Office.
The database includes all Swiss hospitalization records from acute care, general, and specialty hospitals, excluding hospital units of postacute care institutions. Nonmedical, psychiatric, and nonadult (<18 years of age) patients were excluded from the final analysis. Medical cases were defined as encoded by the Federal Statistical Office. Thus, gynecology and obstetrics, pediatrics, ophthalmology, intensive care, otolaryngology, surgery, psychiatry, dermatology and venerology, radiology, geriatrics, rehabilitation, and emergency center patient records were excluded.
To qualify for inclusion in this study cohort, hospitalized patients had a primary or secondary discharge record of hypoosmolar hyponatremia diagnosis according to the International Classification of Diseases, 10th Revision German Version (ICD-10-GM): E87.1 (hypoosmolar hyponatremia) or E22.2 (syndrome of inappropriate antidiuresis), respectively. Patients without clear diagnosis of hyponatremia were not included in the analysis.
Data on mean daily outdoor temperature were gathered from the open data repository of the Federal Office of Meteorology and Climatology MeteoSwiss (Bundesamt fuer Meteorologie und Klimatologie MeteoSchweiz).
The institutional review board of Northwestern and Central Switzerland approved of this study and waived patients’ informed consent owing to the use of deidentified data. This study followed the Strengthening the Reporting of Observational Studies in Epidemiology reporting guideline (19).
Outcomes
The primary outcome was the monthly alteration in hypoosmolar hyponatremia prevalence among medical inpatients. Secondary outcomes were sex- and age-specific monthly variations in hypoosmolar hyponatremia prevalence in these patients. Outcome measures were mean monthly odds ratio of hypoosmolar hyponatremia diagnosis and mean monthly outdoor temperature.
Statistical analysis
Unless stated otherwise, categorical variables are expressed as number (percentage) and continuous variables as mean (SD). Subgroup analyses were performed for sex (male, female) and for predefined age groups (based on quartiles of all hospitalized patients: ≤55 years, 56 to 70 years, 71 to 80 years, and >80 years). Furthermore, sensitivity analyses were performed for the diagnoses of hypoosmolar hyponatremia (E87.1) and syndrome of inappropriate antidiuresis (E22.2) separately.
We used univariable and multivariable logistic regression models to calculate odds ratio (OR) and 95% confidence interval (CI) for the hypoosmolar hyponatremia diagnosis. The multivariable models were adjusted for age, nationality, hospital teaching status, type and date (month and year) of admission, disease severity score (Charlson Comorbidity Index), type of admission (planned vs. unplanned), and main comorbidities. Monthly prevalence rates were calculated and compared among the predefined sex and age subgroups.
The significance level was set as α = 5%. All P values are 2-sided and have not been adjusted for multiple testing. Statistical analyses were performed using Stata 15.1 (Stata Corp 2015, College Station, TX, USA).
Results
Baseline characteristics
Of 2 426 722 medical inpatients included in this study, 84 210 (3.5%) were diagnosed with hypoosmolar hyponatremia, of whom 51 262 (61%) were female. Among inpatients with a diagnosis of hypoosmolar hyponatremia, the majority was admitted through the emergency department and around 88% were community dwelling. Patients with hypoosmolar hyponatremia had a high burden of comorbidities such as heart failure, chronic kidney disease, pneumonia, and liver failure. The mean [SD] Charlson Comorbidity Index was significantly higher in patients diagnosed with hypoosmolar hyponatremia compared with medical controls at the same time of hospitalization (1.9 [2.6] vs. 1.5 [2.3], P < .001) (Table 1).
Baseline Characteristics
| Hyponatremia | Medical Controls | P Value | |
|---|---|---|---|
| Sociodemographics | |||
| Hospitalizations, n | 84 210 | 2 342 512 | |
| Sex, female, n (%) | 51 262 (60.9) | 1 114 006 (47.6) | <.001 |
| Age groups, n (%) | <.001 | ||
| <56 y | 10 713 (12.7) | 584 615 (25.0) | |
| 56-70 y | 21 620 (25.7) | 627 761 (26.8) | |
| 71-80 y | 23 094 (27.4) | 565 363 (24.1) | |
| >80 y | 28 783 (34.2) | 564 773 (24.1) | |
| Swiss residents, n (%) | 74 796 (88.8) | 1 940 162 (82.8) | <.001 |
| Hospital teaching level, n (%) | |||
| Tertiary care hospital | 55 162 (65.5) | 1 535 222 (65.5) | .85 |
| Hospital admission | <.001 | ||
| Emergency admission | 73 718 (87.5) | 1 647 354 (70.3) | |
| Elective admission | 9687 (11.5) | 662 611 (28.3) | |
| Others | 805 (1.0) | 32 547 (1.4) | |
| Living situation, n (%) | |||
| Before admission | |||
| At home | 73 880 (87.7) | 2 041 444 (87.1) | <.001 |
| Comorbidities, n (%) | |||
| Diabetes mellitus | 15 227 (18.1) | 366 271 (15.6) | <.001 |
| Arterial hypertension | 45 795 (54.4) | 916 926 (39.1) | <.001 |
| Coronary artery disease | 12 770 (15.2) | 497 689 (21.2) | <.001 |
| Cerebrovascular disease | 4646 (5.5) | 153 786 (6.6) | <.001 |
| Heart failure | 20 255 (24.1) | 426 973 (18.2) | <.001 |
| Cancer | 14 507 (17.2) | 337 744 (14.4) | <.001 |
| Chronic kidney disease | 22 249 (26.4) | 408 818 (17.5) | <.001 |
| Chronic obstructive pulmonary disease | 11 418 (13.6) | 226 501 (9.7) | <.001 |
| Pneumonia | 10`694 (12.7) | 177 656 (7.6) | <.001 |
| Liver failure | 6707 (8.0) | 79 419 (3.4) | <.001 |
| Severity index, mean (SD) | |||
| Charlson Comorbidity Index | 1.9 (2.6) | 1.5 (2.3) | <.001 |
Seasonal variation of hypoosmolar hyponatremia
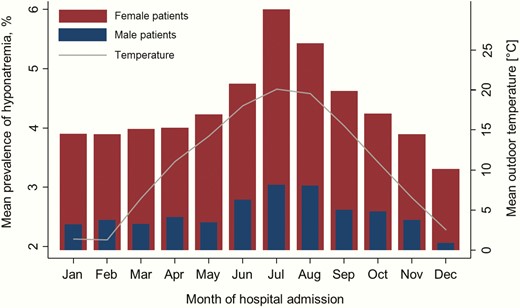
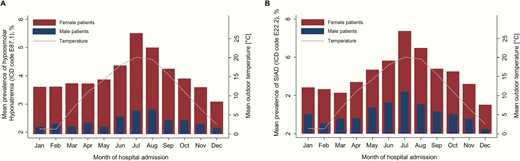
We found a strong seasonal variation in the prevalence of hypoosmolar hyponatremia (R2 = 0.56, P = .005). The highest overall prevalence of hypoosmolar hyponatremia was noted in the month of July (n = 8976, 4.5%), and was lowest in the month of December (n = 6530, 2.7%). We observed a gradual increase in hypoosmolar hyponatremia from the month of January to the month of July, followed by a gradual decrease thereafter. This was paralleled with a gradual increase in mean monthly outdoor temperature from the months of January to the month of July with a mean [SD] monthly outdoor temperature in January of 1.4°C [1.6] to July of 20°C [1.8] and followed by a continued decrease in mean monthly outdoor temperature, respectively (Table 2, Fig. 1). In the sensitivity analyses for the respective diagnosis of hypoosmolar hyponatremia (E87.1) and syndrome of inappropriate antidiuresis (E22.2), there were no significant differences in the temporal dynamics throughout the year (Fig. 2A and B).
Mean Monthly Outdoor Temperature and Prevalence of Hyponatremia among Hospitalized Male and Female Patients
| Month of hospital admission | Outdoor temperature (°C), mean (SD) | Total prevalence of hyponatremia, n (%) | Prevalence of hyponatremia in male patients, n (%) | Prevalence of hyponatremia in female patients, n (%) |
|---|---|---|---|---|
| January | 1.4 (1.6) | 6747 (3.2) | 2688 (2.4) | 4059 (4.0) |
| February | 1.3 (2.1) | 6262 (3.2) | 2547 (2.5) | 3715 (4.0) |
| March | 6.5 (1.5) | 6787 (3.2) | 2691 (2.5) | 4096 (4.1) |
| April | 11.1 (1.2) | 6407 (3.3) | 2597 (2.6) | 3810 (4.1) |
| May | 14.3 (1.6) | 6541 (3.4) | 2520 (2.5) | 4021 (4.3) |
| June | 18.0 (0.7) | 7309 (3.8) | 2886 (2.9) | 4423 (4.8) |
| July | 20.1 (1.8) | 8976 (4.5) | 3182 (3.1) | 5794 (6.1) |
| August | 19.6 (1.2) | 8212 (4.3) | 3126 (3.1) | 5086 (5.5) |
| September | 15.5 (1.1) | 7116 (3.7) | 2720 (2.7) | 4396 (4.7) |
| October | 11.0 (1.2) | 6928 (3.5) | 2763 (2.7) | 4165 (4.3) |
| November | 6.6 (1.0) | 6395 (3.2) | 2602 (2.5) | 3793 (4.0) |
| December | 2.6 (1.4) | 6530 (2.7) | 2626 (2.1) | 3904 (3.4) |
Association of hyponatremia in hospitalized patients, month of admission, and sex, and stratified by age groups.
Mean monthly prevalence of hyponatremia stratified for sex.
Seasonal variation of hypoosmolar hyponatremia stratified by sex and age categories
The overall prevalence of hypoosmolar hyponatremia was higher in women compared with men (OR, 1.72 [95% CI, 1.69-1.74], P < .001). This remained statistically significant when adjusting for comorbidities such as heart failure, chronic kidney disease, pneumonia, and liver failure (OR, 1.58 [95% CI, 1.56-1.60], P < .001) (Table 3). Sex-specific differences in hypoosmolar hyponatremia increased in parallel with the mean monthly outdoor temperature (Fig. 1). In January, 2.4% men and 4% women were diagnosed with hypoosmolar hyponatremia (OR, 1.54 [95% CI, 1.46-1.62], P < .001), whereas 3.1% men and 6.1% women were diagnosed with hypoosmolar hyponatremia in July (OR, 1.76 [95% CI, 1.68-1.84]) (Tables 2 and 3).
Association of Monthly-Stratified Hyponatremia in Hospitalized Patients among Sex and Age Groups
| Overall | <56 years | 56 to 70 years | 71 to 80 years | >80 years | ||||||
|---|---|---|---|---|---|---|---|---|---|---|
| Adjusted OR (95% CI) | P Value | Adjusted OR (95% CI) | P Value | Adjusted OR (95% CI) | P Value | Adjusted OR (95% CI) | P Value | Adjusted OR (95% CI) | P Value | |
| Overall | ||||||||||
| Male patients | Reference | Reference | Reference | Reference | Reference | |||||
| Female patients | 1.58 (1.56–1.60) | <.001 | 1.04 (1.00–1.09) | .035 | 1.24 (1.20–1.27) | <.001 | 1.78 (1.73–1.83) | <.001 | 2.14 (2.08–2.21) | <.001 |
| January | ||||||||||
| Male patients | Reference | Reference | Reference | Reference | Reference | |||||
| Female patients | 1.54 (1.46–1.62) | <.001 | 1.09 (0.96–1.24) | .197 | 1.21 (1.10–1.34) | <.001 | 1.69 (1.53–1.87) | <.001 | 2.21 (1.99–2.44) | <.001 |
| February | ||||||||||
| Male patients | Reference | Reference | Reference | Reference | Reference | |||||
| Female patients | 1.51 (1.43–1.59) | <.001 | 1.04 (0.90–1.20) | .583 | 1.26 (1.14–1.39) | <.001 | 1.78 (1.60–1.98) | <.001 | 1.91 (1.73–2.11) | <.001 |
| March | ||||||||||
| Male patients | Reference | Reference | Reference | Reference | Reference | |||||
| Female patients | 1.54 (1.47–1.62) | <.001 | 1.07 (0.93–1.27) | .341 | 1.19 (1.08–1.31) | .001 | 1.73 (1.58–1.91) | <.001 | 2.17 (1.96–2.40) | <.001 |
| April | ||||||||||
| Male patients | Reference | Reference | Reference | Reference | Reference | |||||
| Female patients | 1.49 (1.41–1.57) | <.001 | 1.02 (0.86–1.17) | .790 | 1.17 (1.06–1.30) | .002 | 1.61 (1.45–1.78) | <.001 | 2.06 (1.86–2.28) | <.001 |
| May | ||||||||||
| Male patients | Reference | Reference | Reference | Reference | Reference | |||||
| Female patients | 1.63 (1.55–1.72) | <.001 | 0.94 (0.82–1.09) | .420 | 1.46 (1.32–1.61) | <.001 | 1.71 (1.55–1.89) | <.001 | 2.30 (2.07–2.55) | <.001 |
| June | ||||||||||
| Male patients | Reference | Reference | Reference | Reference | Reference | |||||
| Female patients | 1.57 (1.50–1.65) | <.001 | 1.09 (0.95–1.25) | .220 | 1.18 (1.08–1.30) | .001 | 1.82 (1.66–2.01) | <.001 | 2.06 (1.88–2.27) | <.001 |
| July | ||||||||||
| Male patients | Reference | Reference | Reference | Reference | Reference | |||||
| Female patients | 1.76 (1.68–1.84) | <.001 | 1.05 (0.92–1.19) | .508 | 1.33 (1.22–1.46) | <.001 | 1.98 (1.81–2.16) | <.001 | 2.40 (2.20–2.62) | <.001 |
| August | ||||||||||
| Male patients | Reference | Reference | Reference | Reference | Reference | |||||
| Female patients | 1.64 (1.57–1.72) | <.001 | 1.04 (0.91–1.18) | .568 | 1.29 (1.17–1.41) | <.001 | 1.87 (1.71–2.05) | <.001 | 2.17 (1.99–2.37) | <.001 |
| September | ||||||||||
| Male patients | Reference | Reference | Reference | Reference | Reference | |||||
| Female patients | 1.62 (1.54–1.70) | <.001 | 1.13 (0.99–1.30) | .075 | 1.24 (1.12–1.37) | <.001 | 1.81 (1.64–1.99) | <.001 | 2.16 (1.96–2.38) | <.001 |
| October | ||||||||||
| Male patients | Reference | Reference | Reference | Reference | Reference | |||||
| Female patients | 1.52 (1.44–1.60) | <.001 | 0.97 (0.85–1.11) | .648 | 1.12 (1.01–1.23) | .030 | 1.77 (1.61–1.95) | <.001 | 2.15 (1.95–2.38) | <.001 |
| November | ||||||||||
| Male patients | Reference | Reference | Reference | Reference | Reference | |||||
| Female patients | 1.48 (1.40–1.56) | <.001 | 1.04 (0.90–1.20) | .594 | 1.17 (1.06–1.29) | .002 | 1.68 (1.52–1.86) | <.001 | 1.94 (1.75–2.15) | <.001 |
| December | ||||||||||
| Male patients | Reference | Reference | Reference | Reference | Reference | |||||
| Female patients | 1.57 (1.49–1.66) | <.001 | 1.05 (0.91–1.21) | .487 | 1.21 (1.10–1.34) | <.001 | 1.78 (1.61–1.96) | <.001 | 2.08 (1.88–2.30) | <.001 |
CI, confidence interval; OR, odds ratio.
The in-hospital prevalence of hypoosmolar hyponatremia increased with increasing age. The overall prevalence of hypoosmolar hyponatremia for patients <56 years was 1.8% and increased for the age rage 56 to 70 years to 3.3% and for the age range 70 to 80 years to 3.9% and was 4.9% for patients >80 years (data not shown separately) (Fig. 3).

Mean monthly prevalence of (A) hypoosmolar hyponatremia (ICD code E87.1) and (B) syndrome of inappropriate antidiuresis (ICD code E22.2) stratified for sex. ICD, International Classification of Diseases.
Whereas the overall prevalence of hyponatremia was higher in women compared with men, we did not find such a significant difference after stratification for month. In older patients, however, we did observe month-stratified differences in the prevalence of hypoosmolar hyponatremia in hospitalized medical patients (Table 3). These associations are visualized in Fig. 3. Based on terms of interaction, we found age to be a strong effect modifier in the association between sex and the prevalence of in-hospital hyponatremia.
To exclude that these findings are due to an increased admission rate of female and elderly patients during summer months, we investigated the monthly admission rate of these patients and found that there was no seasonal difference in admission rates throughout the year (data not shown).
Discussion
Key findings of this study are threefold: first, the prevalence of hyponatremia in medical inpatients increases during summer months and is strongly associated with warmer outdoor temperature. Second, hyponatremia was more common in women, especially during summer months. Third, increasing age was associated with a higher in-hospital prevalence of hyponatremia and, again, this finding was most pronounced during summer months.
Our nationwide cohort data conclusively confirm a seasonal variation of the prevalence of hyponatremia being highest during summer months (12–14). Although previous studies investigated smaller patient numbers or focused on emergency department setting, the present study expands the findings to a large medical inpatient population. The overall prevalence of hypoosmolar hyponatremia in hospitalized patients of 3.5% is lower compared with 10% to 15% prevalence reported in previous studies (1–4). This could possibly be due to an underreporting of hyponatremia and that our data represent the more profound and symptomatic cases of hyponatremia. This would be in line with data from the outpatient setting that indicated a season dependent effect in particular for patients with profound hyponatremia (12, 14).
Reasons for the increased prevalence of hyponatremia during summer months with increased outdoor temperature may be attributed to several predisposing factors. Our data suggest that hypoosmolar hyponatremia overall as well as syndrome of inappropriate antidiuresis taken as single diagnosis increase in parallel during summer months. Hypoosmolar hyponatremia may be caused by diuretic-induced hyponatremia, primary polydipsia, or volume overload from heart or renal failure, respectively. Even though our data cannot differentiate between the different hypoosmolar hyponatremia etiologies, previous studies have described increased diuretic-induced hyponatremia during summer months (12, 20). The pathophysiological reasoning is that diuretics lead to a relative renal salt loss and, when combined with dehydration, as during months with higher outdoor temperature, hyponatremia might develop. With regard to hyponatremia caused by heart or renal failure, studies suggest that they are more commonly decompensated and thus of a higher severity during summer months, which could also lead to hyponatremia (21). The distribution of hyponatremia prevalence from the syndrome of inappropriate antidiuresis increases according to our results during summer months. A hypothetical explanation is that increased outdoor temperature is a stimulus for arginine vasopressin. We speculate that in combination with increased fluid intake, this might lead to hyponatremia, especially when consuming hypotonic fluids (12, 22, 23). Additionally, idiopathic syndrome of inappropriate antidiuresis, especially in the elderly, could be increased during summer months but further prospective studies are needed to validate this hypothesis.
As known from previous studies, women tend to have a higher prevalence of hyponatremia in general (3, 12). Our results are in line with those findings, suggesting that women are prone to develop hyponatremia (14). Interestingly, we show that this effect is highest with higher outdoor temperature. It is possible that the increased outdoor temperature influences sex hormones differently, making women more susceptible to develop hyponatremia during increased outdoor temperatures. It was shown that estrogen affects aquaporin-4 expression regulating water homeostasis (24) and that aquaporin-2 expression is higher and more sensitive to endogenous arginine vasopressin in women (25). Last, it is speculated that women tend to drink generally more fluids than men and primary polydipsia is also more common in women (23, 26, 27). This might lead to a volume overload and relative salt deficit, especially when renal function is impaired, and may result in hyponatremia (23).
Aging has been described as independent risk factor for electrolyte disturbances, especially hyponatremia (16). We confirm here that aging is associated with an increased prevalence of hyponatremia and show that this effect is also more pronounced with higher outdoor temperature. Aging is associated with maladaptation to stress and decreased capacity to cope with environmental, disease-related, and iatrogenic stress (28, 29). Common factors predisposing hyponatremia in the elderly are an impaired renal function, increased consumption of hyponatremia-inducing drugs (e.g., diuretics, psychotropics), increased occurrence of cardiac and pulmonary diseases, and increased idiopathic syndrome of inappropriate antidiuresis, which all influence water homeostasis (30–34). Our results indicate that patients with hyponatremia had higher rates of cardiac and pulmonary diseases. Additionally, it has been shown that thirst perception is decreased with age (30, 35, 36). It could therefore be that reduced thirst perception in the elderly in combination with medication and fluid loss (e.g., sweating, vomitus, diarrhea) results in dehydration hyponatremia, especially during higher outdoor temperature.
These data will have to be interpreted in the context of a study design. First, using administrative data is prone to confounding from the risk of misclassification and underreporting of hyponatremia and lack of validating diagnosis with laboratory measurements. In fact, merely 3.5% of all included hospitalized patients were diagnosed with hyponatremia, although evidence suggests there is a much higher prevalence in hospitalized patients (1). We expect our data to still be representable because rate of ascertainment is expected to be constant throughout the year. Second, our data do not differentiate between hyponatremia on admission versus hospital-acquired hyponatremia. ICD-10 coding is generally done at the time of discharge or death. Consequently, some of the patients may have developed hyponatremia during hospitalization, rather than on admission. Assuming a constant rate of hospital-acquired hyponatremia throughout the year, the observed seasonal variation would however be explained by varying hyponatremia prevalence on admission. Our data are based on hospital claims data of ICD coded diagnoses “hypoosmolar hyponatremia” and “syndrome of inappropriate antidiuresis,” but exact laboratory measurements were not available. Third, the nonexperimental design of our study limits the ability to draw causal links between the prevalence of hyponatremia, seasonality, and sex- and age-specific variations. Fourth, because we do not have information on clinical symptoms and severity of hyponatremia, we are unable to account for unmeasured (and unmeasurable) residual confounding factors (e.g., etiology of hyponatremia, thirst perception, volume status).
However, our study has several strengths: the large nationwide data, the high representability, and the long study period. All analyses were adjusted for multiple comorbidities and possible confounders. Furthermore, this is the first study to date focusing on medical inpatients and thus provides information about a patient population which has been poorly studied so far.
In conclusion, in medical inpatients, hyponatremia is increased during summer months with higher outdoor temperature. Females and the elderly are at higher risk to develop hyponatremia, and this effect is enforced during summer months.
Abbreviations
Acknowledgments
Financial Support: This study was supported in part by the Swiss National Science Foundation (SNSF, National Research Program [NRP 74], 407440_167376).
Additional Information
Disclosure Summary: The authors have no conflict of interest.
Data Availability: The datasets generated during and/or analyzed during the current study are not publicly available but are available from the corresponding author on reasonable request.
References
Author notes
Equally contributing first authors.
