


Abstract
Adolescents have more small, growing follicles and larger ovaries than normal women and are prone to anovulatory cycles (ANOV). It is unknown if a higher antral follicle count (AFC) per se contributes to ANOV in early postmenarchal girls.
To determine the relationship between AMH (an AFC biomarker), other reproductive hormones, and ANOV in postmenarchal girls and to compare AMH in girls and regularly cycling adults.
A total of 23 girls (1.7 ± 0.2 years postmenarche) and 32 historic adult controls (≤34 years) underwent serial hormone measurements during 1 to 2 menstrual cycles. Girls also had pelvic ultrasounds. AMH was measured 5 times/subject using the Ansh ultrasensitive ELISA.
Girls had higher AMH than women (5.2 ± 0.3 vs. 3.3 ± 0.4 ng/mL; P < 0.01) and girls with more ovulatory (OV) cycles tended to have lower AMH than those with ANOV (2 OV 4.5 ± 0.2, 1 OV 5.7 ± 1.1, 0 OV 6.8 ± 1.1 ng/mL; P = 0.1). In girls, AMH correlated with natural-log (ln) transformed LH (r = 0.5, P = 0.01), ln_androstenedione (r = 0.6, P = 0.003), ln_testosterone (r = 0.5, P = 0.02), and ovarian volume (r = 0.7, P < 0.01) but not with FSH, estradiol, P4, or body mass index. In women, AMH correlated with estradiol and P4 (both r = -0.4, P ≤ 0.03) but not with ln_LH or body mass index.
In postmenarchal girls, AMH is higher than in ovulatory women and is associated with LH, androgens, and a propensity for anovulatory cycles. The cause of the transient increase in AMH and AFC during late puberty and the steps underlying the transition to a mature ovary deserve further study.
The ovary is a very active organ during the mini-puberty of infancy, during childhood (when the remainder of the reproductive axis is quiescent, and during puberty, when trophic stimulation of the ovary by LH and FSH resumes. Histopathological studies have demonstrated that the ovaries of young girls are populated by both healthy and degenerating follicles at all stages of development (up to and not including the preovulatory stage), suggesting recurrent cycles of growth and atresia. After approximately 6 years of age, however, there is a steady rise in the number and size of antral follicles, such that by late puberty, the antral follicle count (AFC) appears to be higher than at any other life stage (1–5). This increase in AFC accounts for the parallel rise in ovarian volume during puberty. Indeed, in late adolescence, ovarian volume exceeds that of normal adult women (3, 6–9). The physiological basis for the transient increase in AFC during puberty is unknown.
It is notoriously difficult to visualize and hence to study antral follicles in adolescent girls by transabdominal pelvic imaging, in contrast to transvaginal imaging, which is acceptable in adults. Fortunately, serum anti-Mullerian hormone (AMH) has emerged as a reliable biomarker of AFC in girls (4), as in adults (10). AMH, a member of the TGF-beta superfamily of growth factors, is synthesized by granulosa cells of preantral and small antral follicles (11). In vivo and in vitro studies in the mouse have shown that AMH inhibits primordial follicle growth (12) as well as the cyclical recruitment of antral follicles by FSH (13), and is itself regulated by oocyte-derived growth factors (14), FSH, and estradiol (E2) (15). If AMH is in fact a faithful marker of AFC, then AMH would also be predicted to be highest during puberty. Several recent cross-sectional studies that included girls from infancy to adulthood, however, predicted that peak AMH occurs anywhere from the early teens to the mid-20s, and the only study to directly compare AMH in postmenarchal girls and adult women found no difference between the groups (16).
The current studies were therefore designed to compare serum AMH levels in early postmenarchal girls with those of regularly cycling historic adult controls (17). The rich phenotypic data previously reported for this adolescent cohort (18, 19)—reproductive hormone profiling and serial pelvic ultrasounds during 2 consecutive menstrual cycles—also presented an opportunity to investigate the relationship between AMH, other reproductive hormones, and the propensity for anovulation in healthy postmenarchal girls.
Materials and Methods
Subjects
Clinical and demographic characteristics of this cohort have been previously described (18, 19). Briefly, the 23 subjects were healthy girls, aged 12.8 to 17.6 years, with a gynecologic age (years since menarche) of 0.4 to 3.5 years, recruited from the Boston community. Subjects had normal thyroid, prolactin, and androgen levels. They were non-hirsute (Ferriman-Gallwey score < 8) and had, at most, mild acne. They did not exercise excessively, had no known eating disorder, and did not smoke. Subjects were not on any medications known to interfere with reproductive hormones, had never received treatment for a menstrual or endocrine condition, and had never taken hormonal contraception.
The Partners Human Research Committee approved the study and signed informed assent and consent were obtained from each subject and her parent, respectively.
Protocol
Cycle monitoring—hormones.
The experimental protocol has been described in detail previously (18, 19). Briefly, hormones were measured during 2 consecutive menstrual cycles nearly every other day using either blood (for LH, FSH, E2, progesterone [P4]), dried blood spots (for LH, FSH), or dried urine (for E2, pregnanediol [Pd]) samples in all subjects. FSH and LH levels from dried blood spots and E2 levels from urine samples were converted to serum equivalents (19). AMH was measured in a random subset of 110 samples from 31 cycles (3.6 ± 0.3 samples/cycle [range, 1–7]; 4.8 ± 0.4 samples/subject [range, 2–8]). Serum total testosterone (TT), androstenedione (AD), dehydroepiandrosterone sulfate (DHEAS), and 17-hydroxy-progesterone (17OHP) were measured at the screening visit. Serum TT was also measured weekly for 5 weeks in 6 subjects who participated in a pilot study before completing the full experimental protocol.
Cycle monitoring—ovarian imaging.
Subjects underwent at least 2 pelvic ultrasounds per cycle to monitor follicle growth, to document ovulation, and to calculate the maximum average ovarian volume (in ovaries without a dominant follicle). Polycystic ovarian morphology (PCOM) was defined as the presence of ≥12 small follicles with a peripheral distribution (as opposed to a multifollicular pattern, which is a normal variant during puberty (20)) and an ovarian volume >10 cm3 in at least one ovary based on transabdominal images (21). Ovaries were said to be enlarged if average ovarian volume exceeded 12 cm3 (22).
Menstrual cycle classification.
Cycles were classified as ovulatory (OV) if they met all of the following criteria: (1) a mid-cycle LH peak; (2) a pre-OV E2 peak; and (3) a serum P4 > 1.65 ng/mL or urine Pd > 390.5 µg/g Cr (18, 19). All other cycles were classified as anovulatory (ANOV). The P4 and Pd cutoffs were determined by receiver operating characteristic curve analysis of P4 and Pd values from 37 cycles with sonographic evidence of either ovulation or anovulation, as previously described (19). The day of ovulation was determined based on gonadotropin and sex steroid levels as well as follicle collapse on ultrasound. The length of the follicular phase was calculated as the number of days from menses up to and including the estimated day of ovulation. The length of the luteal phase was calculated as the number of days after ovulation until the day before the next menses, and a short luteal phase was defined as less than 10 days (23, 24).
Assays.
Serum was analyzed for LH, FSH, E2, P4, TT, and DHEAS by clinical immunoassay, as previously described (18, 19). In the 1 adolescent subject with TT > 40 by immunoassay (TT = 53 ng/dL), TT and free testosterone were also determined using liquid chromatography/tandem mass spectrometry (LC/MS-MS) and equilibrium dialysis, respectively (Quest Diagnostics Nichols Institute, Chantilly, VA). Androstenedione and 17OHP were measured using LC/MS-MS (LabCorp, Burlington, NC). Urine Pd was measured using gas chromatography/MS-MS (Agilent 7000B). Assays conducted using dried blood spots and dried urine strips were performed at ZRT Laboratory (Beaverton, OR), as previously described (25–27). AMH was measured at the University of Virginia Center for Research in Reproduction Ligand Assay and Analysis Core using the Ansh Ultra-Sensitive AMH ELISA kit (catalog number AL-105, Ansh Labs, Webster, TX), which has a limit of quantification of 0.1 ng/mL and coefficients of variation (CVs) of 1.2% and 3.0% for quality control sera containing 1.84 and 4.72 ng/mL, respectively.
Comparisons with historic adult controls with regular cycles.
Hormone concentrations in adolescents were compared with corresponding data from 32 women, aged 18 to 34 years, with a history of regular menstrual cycles. Women had no chronic medical conditions and were not taking hormonal contraception. These women were part of a larger cohort (n = 45, ages 18-45 years) who were recruited from the community of Providence, RI, as previously described (17). Serum LH, E2, P4, and AMH were measured during the course of 1 OV cycle (confirmed by P4 ≥ 4.5 ng/mL). Sampling occurred on cycle day 3, cycle day 8, as well as 1, 3, and 10 days after the mid-cycle LH surge detected by a urine ovulation test kit. Serum androgens, FSH, and ovarian volume were not determined. Subject-level data on cycle length during monitoring could not be recovered, but the average cycle length for the initial cohort of 45 women was 28.4 days. For illustration purposes, in the current studies, the follicular and luteal phase lengths were assumed to be 14 days. LH, E2, and P4 were measured by immunoassay (Architect, Abbott Laboratories, Abbott Park, IL) and AMH was measured using the Ansh Ultra-Sensitive AMH ELISA kit (Ansh Labs) at the Division of Medical Screening and Special Testing, Women and Infant’s Hospital, Rhode Island. A random subset of adolescent and adult samples (10 each) were reassayed for AMH in the RI lab in 2019 for cross-validation.
Statistical analysis
Adolescent OV cycles were normalized to a 28-day cycle length (14-day follicular phase, 14-day luteal phase) with the day of the mid-cycle LH peak set as day 0, as previously described (28). AMH was compared among adolescent subgroups and adults after square-root transformation using a linear mixed model to account for repeated measures. Group differences were reported, after back transformation, as the differences in least squares means (means estimated from the model) with 95% confidence intervals (95% CI). For tests of correlation, AMH (in adults), LH (in both groups), and androgens (in adolescents) were natural log-transformed. Pearson’s r was used to determine the strength of the relationship between AMH and LH, FSH, sex steroids, gynecologic age, body mass index (BMI) Z-score, average ovarian volume, PCOM, number of OV cycles, and average luteal phase length (using 0.1 days for ANOV cycles) in adolescents and between AMH and LH, E2, P4, and BMI in adults. Categorical variables were dummy-coded. LH and E2 values were selected from cycle day 2 or 3 in adults and LH, FSH, and E2 were selected from adjusted cycle days 1 through 5 in adolescents. All covariates were simultaneously entered into a multiple regression model to identify the strongest predictors of AMH in adolescents. Because of collinearity, however, none of the predictors were significant. We therefore moved to a forward stepwise regression model. Within-participant variability in AMH was expressed as a coefficient of variation (CV% = SD/mean × 100). AMH assays were compared using a Passing-Bablok regression model. The “2 1-sided tests” (TOST) procedure (29) was used to test assay equivalence with equivalence bounds set at 15% (Δ L = -0.15 and Δ U = 0.15) given an expected reagent lot-to-lot variance <15% and freeze/thaw effect <5%, per the manufacturer (Ansh Labs). Data are reported as mean ± SE (95% CI) unless stated otherwise. Analyses were performed using JMP v13.0.0 (Cary, NC) or SAS v9.4 (Cary, NC).
Results
The 23 adolescent subjects were 12.8 to 17.6 years old, with Tanner V breast development, and a gynecologic age ≤3.5 years (Table 1). They were ethnically diverse and 56% were overweight/obese. Four subjects had PCOM, 6 subjects had enlarged ovaries (maximum average ovarian volume, 12.7-17.1 cm3), but no subjects had clinical or biochemical evidence of hyperandrogenism (defined as TT > 55 ng/dL (30), 17OHP > 200 ng/dL, DHEAS > 250 mcg/dL, or AD > 250 ng/dL (31)). Eleven subjects had 2 OV, 5 subjects had 1 OV, 5 subjects had no OV, and 2 subjects could not be classified because they were lost to follow-up during cycle 2 (Table 2). In both subgroups with OV, 40% of cycles were characterized by a short (<10 day) luteal phase. There were no differences in demographics, anthropometrics, or in gonadotropin and sex steroid levels between the adolescent subgroups (Table 2).
Baseline Characteristics of the Adolescent Subjects and Historic Adult Controls
| Adolescents | Adults | ||
|---|---|---|---|
| n | 23 | 32 | |
| Chronologic age, y | 14.4 ± 0.2 | 27.8 ± 0.8 | |
| Age at menarche, y | 12.6 ± 0.3 | 12.8 ± 0.2a | |
| Gynecologic age, y | 1.7 ± 0.2 | 15b | |
| Race (%) | |||
| White | 65 | 75 | |
| Black | 22 | 9 | |
| Other | 13 | 16 | |
| Hispanic (%) | 25 | 13 | |
| Weight, kg (percentile) | 68.7 ± 3.4 (86.9 ± 3.5) | 65.8 ± 2.0 | |
| Height, cm (percentile) | 161.2 ± 1.2 (52.2 ± 5.6) | 164.4 ± 1.0 | |
| BMI, kg/m2 (percentile) | 26.4 ± 1.3 (80.4 ± 4.3) | 24.4 ± 0.61 (27.9 ± 3.3)c | |
| BMI category (%) | |||
| Normal weight | 44 | 56c | |
| Overweight | 17 | 41 | |
| Obese | 39 | 3 | |
| Cycle 1 | Cycle 2 | Cycle 1 | |
| Cycle parameters | |||
| Ovulatory (% of cycles) | 69.6 (16 of 23) | 61.9 (13 of 21) | 100 |
| Cycle length, d | 35.2 ± 2.6 | 31.8 ± 1.5 | 28.4 ± 0.2a |
| Luteal phase length, d | 10.4 ± 0.5 | 10.2 ± 0.8 | – |
aAs reported for the full cohort of 45 women in Lambert-Messerlian et al. 2016 (17). Subject-level data not available.
bEstimated from (17).
cAdolescents were more likely to be overweight/obese than adults; P < 0.001 for comparison of body mass index percentiles; P = 0.002 for body mass index categories.
Characteristics of Adolescent Subjects With Either 0, 1, or 2 Ovulatory (OV) Cycles
| 0 OV Adol | 1 OV Adol | 2 OV Adol | |
|---|---|---|---|
| n | 5 | 5 | 11 |
| Demographics | |||
| Chronologic age, y | 13.9 ± 0.4 | 14.5 ± 0.4 | 14.5 ± 0.4 |
| Gynecologic age, y | 1.3 ± 0.4 | 2.4 ± 0.4 | 1.7 ± 0.3 |
| Race (%, white/black/other) | 60/40/0 | 80/0/20 | 73/18/9 |
| Hispanic (%) | 40 | 40 | 18 |
| Anthropometrics | |||
| Weight, kg (percentile) | 80.1 ± 8.5 (88.5 ± 9.0) | 66.6 ± 6.2 (77.5 ± 9.3) | 67.2 ± 4.0 (92.5 ± 2.5) |
| Height, cm (percentile) | 159.1 ± 1.3 (46.7 ± 7.4) | 162.2 ± 2.9 (54.3 ± 13.6) | 161.4 ± 1.8 (53.5 ± 8.1) |
| BMI, kg/m2 (percentile) | 31.5 ± 3.1 (88.8 ± 8.7) | 25.3 ± 2.3 (76.0 ± 10.7) | 25.8 ± 1.5 (84.0 ± 4.3) |
| Cycle parameters | |||
| Normal OV cycles (n) | 0 | 3 | 13 |
| Cycle length, d | – | 48.3 ± 11.8 | 35.2 ± 1.0a |
| Luteal phase length, d | – | 11.7 ± 1.0 | 12.2 ± 0.5 |
| Short OV cycles (n) | 0 | 2 | 9 |
| Cycle length, d | – | 25.0 ± 0.4 | 25.0 ± 1.1 |
| Luteal phase length, d | – | 7.0 ± 0.0 | 7.2 ± 0.6 |
| ANOV cycles (n) | 10 | 5 | 0 |
| Cycle length, d | 35.8 ± 3.4 | 30.6 ± 2.6 | – |
| Reproductive hormones | |||
| LH (IU/L) | 5.7 ± 1.8 | 4.0 ± 1.1 | 3.4 ± 0.7 |
| FSH (IU/L) | 4.1 ± 0.3 | 4.6 ± 0.8 | 4.6 ± 0.3 |
| E2 (pg/mL) | 35.7 ± 5.7 | 29 ± 2.8 | 28.1 ± 3.2 |
| Peak P4 (ng/dL) | 1.5 ± 0.6 | 4.8 ± 1.1 | 6.2 ± 1.4 |
| TT (ng/dL) | 23.1 ± 6.9 | 20.7 ± 3.4 | 18.7 ± 2.2 |
| AD (ng/dL) | 124.2 ± 26.9 | 77.6 ± 24.0 | 82.9 ± 6.3 |
Note that 2 girls could not be classified because of loss to follow-up in cycle 2. LH, FSH, and estradiol (E2) values reflect measurements on adjusted cycle days 1–5. Progesterone (P4) represents the highest value during both cycles. Total testosterone (TT) and androstenedione (AD) were measured at the screening visit. a1 OV vs. 2 OV, P = 0.06.
Adol, adolescent; ANOV, anovulatory.
Average AMH was 5.2 ± 0.3 (95% CI, 3.9-6.5) ng/mL with a within-subject CV of 18.4%. There appeared to be a dose-response relationship between AMH and ovulatory capacity in girls such that AMH tended to decrease with increasing numbers of OV (0 OV 6.8 ± 1.1 [95% CI, 1.3-12.4], 1 OV 5.7 ± 1.1 [95% CI, 2.5-9.1], 2 OV 4.5 ± 0.3 [95% CI, 3.0-5.4] ng/mL; test for linear trend P = 0.1) (Fig. 1, Table 3). AMH did not vary by cycle phase (follicular 4.1 ± 0.3 [95% CI, 3.9-5.0] ng/mL vs. luteal 3.8 ± 0.4 [95% CI, 2.9-4.8] ng/mL; P = 0.6) in OV (Fig. 2a). Among the girls with consistent OV, there was no difference in AMH levels between the 5 girls who had 2 cycles with a normal luteal phase length and the 6 girls who had at least 1 cycle with a short luteal phase length (4.5 ± 1.0 [95% CI, 2.7-6.4] vs. 3.9 ± 0.7 [95% CI, 2.6-5.3] ng/mL, P = 0.6).
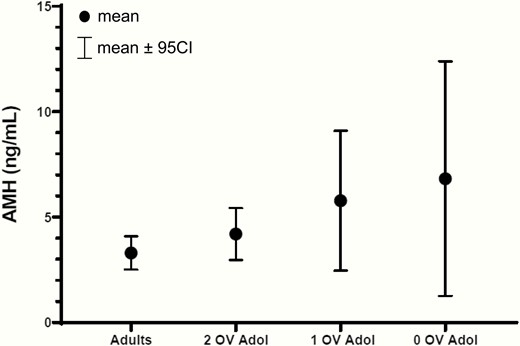
Raw mean AMH levels with 95% CI in adolescent subjects (Adol) with either 0, 1, or 2 ovulatory cycles and in ovulatory adult women. AMH tended to decrease with increasing numbers of ovulatory cycles in adolescents. As a group, adolescents had higher AMH levels than adults. See also Table 3. 95% CI, 95% confidence interval.
Comparison of AMH Values Among Adolescent Subgroups and Adults
| Group Comparison | Difference (95CI) | P | |
|---|---|---|---|
| 0 OV | 1 OV | 0.6 (0.5-0.8) | 0.7 |
| 0 OV | 2 OV | 1.7 (0.7-2.9) | 0.3 |
| 0 OV | Adult | 3.1 (1.4-5.2) | 0.01 |
| 1 OV | 2 OV | 1.0 (0.2-2.2) | 0.5 |
| 1 OV | Adult | 2.4 (0.9-4.4) | 0.04 |
| 2 OV | Adult | 1.4 (0.7-2.3) | 0.08 |
| Group Comparison | Difference (95CI) | P | |
|---|---|---|---|
| 0 OV | 1 OV | 0.6 (0.5-0.8) | 0.7 |
| 0 OV | 2 OV | 1.7 (0.7-2.9) | 0.3 |
| 0 OV | Adult | 3.1 (1.4-5.2) | 0.01 |
| 1 OV | 2 OV | 1.0 (0.2-2.2) | 0.5 |
| 1 OV | Adult | 2.4 (0.9-4.4) | 0.04 |
| 2 OV | Adult | 1.4 (0.7-2.3) | 0.08 |
Differences between groups are reported as the differences in least squares means (LSM, means estimated from the linear mixed model) with 95% confidence interval. The LSM for 0 OV is 6.01, for 1 OV 5.38, for 2 OV 4.34, and for adults 2.94.
OV, ovulatory.
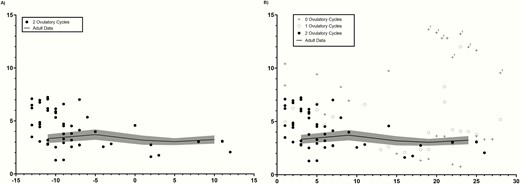
Serial AMH measurements in (A) adolescent subjects with 2 ovulatory cycles, with each cycle centered to the mid-cycle LH peak (day 0), and (B) adolescents with either 0, 1, or 2 ovulatory cycles presented by cycle day (where cycle day 1 represents the first day of menses). Adolescent data are presented over a backdrop of normative data from 32 historic adult controls during an ovulatory cycle. Adult data are shown as a solid black line (mean) ± 1 SD (shaded area). “1” in (B) indicates data points from the 1 adolescent outlier.
AMH correlated with natural-log (ln)_LH, ln_AD, ln_TT, ovarian volume, and the presence of PCOM (Fig. 3, Table 4) but not with FSH, E2, P4, BMI Z-score, chronologic age, or gynecologic age (Table 4). AMH was inversely associated with the number of ovulatory cycles and average luteal phase length; these correlations were of marginal significance (Table 4). Subjects with PCOM had higher AMH levels than those without PCOM (9.0 ± 1.2 [95% CI, 6.5-11.6] vs. 4.4 ± 0.5 [95% CI, 3.4-5.3] ng/mL; P = 0.007). Forward stepwise regression demonstrated that ln_LH and ovarian volume were the strongest predictors of AMH level (R2 = 0.6, P = 0.002).

Correlations between AMH and (A) LH (black circles and solid line), (B) average ovarian volume, (C) androstenedione, and (D) total testosterone in adolescents. AMH did not correlate with LH in adults (A; open circles and dashed line). Correlation coefficients and P values represent results of analyses performed after natural log(ln)-transformation of LH, androstenedione (AD), and total testosterone (TT) in adolescents and AMH and LH in adults. To convert AD and TT from ng/dL to nmol/L, multiply by 0.0349 and 0.0347, respectively.
Correlations Between AMH and Demographic and Clinical Parameters in Adolescents
| Pearson’s r | P | |
|---|---|---|
| BMI Z-score | 0.1 | 0.60 |
| Chronologic age | 0.1 | 0.79 |
| Gynecologic age | 0.1 | 0.51 |
| LH (IU/L)a | 0.5 | 0.01 |
| FSH (IU/L) | −0.1 | 0.82 |
| Estradiol (pg/mL) | −0.2 | 0.25 |
| Peak progesterone (ng/dL) | −0.1 | 0.69 |
| Total testosterone (ng/dL)a | 0.5 | 0.02 |
| Androstenedione (ng/dL)a | 0.6 | 0.003 |
| DHEAS (ug/dL)a | 0.1 | 0.60 |
| 17OHP (ng/dL)a | −0.1 | 0.84 |
| Number of ovulatory cycles | −0.4 | 0.09 |
| Average luteal phase length | −0.3 | 0.13 |
| Average ovarian volume (cm3) | 0.7 | 0.002 |
| Polycystic ovarian morphologyb | 0.5 | 0.01 |
aNatural log(ln)-transformed before analyses. For these variables, r × 100 represents the percent change in the independent variable for every 1 percentage point increase in AMH.
bDefined as the presence of ≥12 small follicles with a peripheral distribution and an ovarian volume >10 cm3 in 1 or both ovaries based on transabdominal images.
Of note, there was 1 outlier, a subject with an AMH of 12.2 ± 1.5 ng/mL (mean ± SD; >97th percentile) (Fig. 2b). This African-American subject was 13 years old (gynecologic age, 7 months), obese (BMI Z-score 2.35), had enlarged ovaries (16.4 cm3), PCOM, a TT of 49.0 ng/dL (by LC/MS-MS), and elevated free testosterone of 11.8 pg/mL but no hirsutism or acne. On a follow-up phone interview at age 18 years, she denied hirsutism or acne but reported having only 9 cycles/year of variable lengths. Both she and her mother denied a family history of polycystic ovarian syndrome (PCOS), hirsutism, acne (in adults), hyperandrogenemia, or infertility. She declined additional testing. When analyses were repeated after excluding this subject, the results were unchanged except that the correlation between AMH and ln_TT was attenuated (r = 0.3, P = 0.2).
The 32 adult women were aged 18 to 34 years old and were comparable to adolescents in ethnic background but were less likely to be overweight/obese (Table 1). Adolescents had higher AMH levels than adults (5.2 ± 0.3 [95% CI, 3.9-6.5] vs. 3.3 ± 0.4 [95% CI, 2.4-3.6] ng/mL, P = 0.006) (Figs. 1, 2A,B, Table 3). Within-person variability in AMH was similar in adolescents (CV 18.4%) and adults (CV 18.7%). AMH was inversely correlated with E2 (r = -0.4, P = 0.03) and peak P4 (r = -0.4, P = 0.01) and did not correlate with ln_LH or BMI in adults. Exclusion of the 1 adult outlier, an overweight 26-year-old Caucasian woman with an AMH of 11.5 ± 2.7 ng/mL (mean ± SD), did not alter these results.
To confirm that the observed difference in AMH in adolescents and adults was not related to differences in the 2 laboratory testing sites, AMH was remeasured in a random subset of 10 adolescent samples (originally assayed at the University of Virginia in 2018) and 10 adult samples (originally assayed in Rhode Island in 2013) at the Rhode Island laboratory in 2019. There was a strong correlation (r = 0.9) between AMH values from the original and repeated assays (32). Bioequivalence testing demonstrated that the difference between mean AMH from the original and repeated assay was <15% (P < 0.01) for the range of values tested (~2-10 ng/mL).
Discussion
The current studies demonstrate that early postmenarchal girls have higher AMH levels than adult women with regular, ovulatory cycles. This difference is largely driven by girls with anovulatory cycles, who tend to have the highest AMH values. Girls with anovulatory cycles also demonstrate the most inter-individual variability in AMH values that may reflect differences in the underlying cause of anovulation. We previously reported that this same cohort of girls demonstrated signs of immaturity at each level of the reproductive axis: lower levels of LH and FSH than adults, suggesting a suboptimal GnRH secretory profile and/or pituitary responsiveness (19), and lower follicular phase E2 and inhibin B levels than adults (even after adjusting for reduced FSH stimulation and smaller follicle sizes), suggesting intrinsic ovarian immaturity (19). AMH appears to be another such marker of ovarian immaturity, although it remains to be determined whether higher AMH may be a cause or consequence of recurrent anovulatory cycles.
We analyzed serial blood samples across 2 menstrual cycles for each adolescent subject, and using a robust immunoassay, found that healthy, early postmenarchal girls have an average AMH of 5.2 ± 0.3 ng/mL. This value is somewhat higher than that previously reported, using the same assay, for regularly cycling girls. This may relate to the relatively younger chronologic and gynecologic age of our participants (Table 1). For example, our participants with the most mature reproductive axis activity (2 OV cycles) had a lower average AMH of 4.6 ng/mL. Savas-Erdeve et al. (33) reported an average AMH of 4.3 ng/mL among 30 Turkish girls with a gynecologic age of 3 to 4 years and Hou et al. (34) reported an average AMH of 4.1 ng/mL among 10 American girls with a gynecologic age of at least 2 years. A third study of 43 obese girls, aged 14 to 15 years (gynecologic age not reported), in Pittsburgh had very similar findings (AMH, 4.3 ng/mL) (35).
We are aware of only 1 other head-to-head comparison of AMH levels among adolescents and adults who were confirmed to be normoandrogenemic. Park et al. (16) found that in subjects with regular menstrual cycles, AMH was slightly higher in adolescent girls (mean age, 14.6 years old; AMH, 3.1 ng/mL) than in adult women (mean age, 32.0 years old; AMH, 2.3 ng/mL) but this difference did not reach statistical significance. Park et al. used an older ELISA by Diagnostic Systems Laboratories (Beckman Coulter, DSL, Webster, TX) that is not as sensitive as the Ansh immunoassay used in the current studies. Of note, similar to our finding of higher AMH levels among girls with anovulatory compared with ovulatory cycles, these investigators observed that girls with isolated oligomenorrhea had significantly higher AMH levels than their peers with regular cycles (5.3 vs. 3.1 ng/mL). Large cross-sectional or semi-longitudinal studies of AMH as a function of age during childhood and young adulthood have produced mixed results, most likely secondary to compositional differences among cohorts. A study of 200 prepubertal and pubertal Danish girls found minimal variation in AMH during pubertal development (36), but only 9 girls were followed after menarche. Using a computational model of serum AMH based on data from 21 cross-sectional studies in 3260 healthy women and children, Kelsey et al. suggested that AMH peaks in the early to mid-20s (37). Although inclusion of fertility clinic patients in these 21 studies is a potential source of bias, another study (38) that was restricted to women with regular menstrual cycles and proven fertility and to healthy schoolgirls or girls undergoing minor surgery reported similar results: maximum AMH occurred at 15.8 years (95% CI, 13.5-20.3). Taken together with the current studies, these data suggest that AMH levels are highest during the early postmenarchal years.
We observed a strong positive correlation between AMH and LH and between AMH and androgens in these adolescent subjects who had no clinical or biochemical signs of hyperandrogenism. These associations are more typical of adolescents and women with PCOS, have not been reported in adolescent girls with regular cycles (39), and have been found inconsistently in normal adults. In PCOS, the association between LH, androgens, and AMH is thought to reflect a synergy between excess androgens (stimulated by LH) and FSH in promoting the growth of preantral follicles (reviewed in (40)). Preantral and small antral follicles show the highest expression of AMH (11). Although serum testosterone peaks in late adolescence/early adulthood (41, 42), it is unknown if intrafollicular androgens in adolescents are higher than in adults and may similarly enhance the early stages of folliculogenesis.
It remains possible, however, that the strong association between AMH and LH among healthy postmenarchal girls does not reflect LH acting at the ovary, but rather AMH acting at the hypothalamus. Although in vitro studies have demonstrated that LH directly stimulates AMH production in both the KK1 mouse luteinized granulosa cell line (43) and in cultured granulosa cells from polycystic (but not from normal) ovaries (44–46), hCG stimulation (25 to 250 µg IV) does not provoke an increase in serum AMH in women or adolescent girls with PCOS (34, 47). Upon finding an association between AMH and LH in post-menarchal daughters of women with PCOS, Crisosto et al. suggested that the relationship between AMH and LH may relate to a positive neuroendocrine feedback mechanism (48). Indeed, Bedecarrats et al. (49) showed that AMHR2 is expressed in a mouse gonadotrope cell line and that AMH stimulates transcription of the LH beta subunit. More recent studies by the Giacobini laboratory have shown that AMHR2 is expressed in a subset of GnRH neurons during fetal development and in adulthood in both mice and humans (50, 51), and that AMH directly stimulates GnRH neuronal activity and pulsatile LH secretion in mice (50). Using a mouse model, the group showed further that prenatal exposure to high levels of AMH produced a persistent PCOS-like phenotype in female offspring, including increased LH pulse frequency, higher TT levels, oligo-anovulation, and subfertility (52). The female offspring, however, also demonstrated a male-like neonatal LH and testosterone surge, a phenotype which is not observed in daughters of women with PCOS during the mini-puberty of infancy (53). Thus, it remains to be determined whether or not the findings from the prenatal AMH mouse model are translational.
This study had several limitations. We identified strong correlations between AMH, LH, androgens, and ovarian volume in adolescent girls, but did not attempt to measure AFCs in these adolescent subjects as this is notoriously difficult with transabdominal ultrasound, and particularly so in an overweight/obese population (54). Pelvic ultrasounds were not part of the study protocol in adult controls and hormonal data was only collected during the course of 1 ovulatory cycle in adults. We did not measure free testosterone but measured TT using an immunoassay that has been calibrated against LC/MS-MS (55). We were unable to obtain an updated menstrual history from the adolescent participants (who are now ≥18 years of age) because of loss to follow-up or current treatment with hormonal contraception. We observed an association between AMH and ovulatory capacity, but analyses were restricted to data from only 2 menstrual cycles. Because AMH was originally measured in different laboratories for adolescents and adults (using the same assay platform), we repeated analyses in a subset of samples to convincingly demonstrate that testing site was not a significant source of variation in AMH between the 2 age groups. Consistent with previous studies (56, 57), we found that AMH levels were unaffected by freezer storage or several freeze-thaw cycles.
In conclusion, the current studies demonstrate that during the early postmenarchal years, AMH levels exceed those of regularly cycling adults, particularly among girls with anovulatory cycles, and are closely related to LH and androgen levels. The finding of higher AMH levels in adolescent girls is consistent with previous studies demonstrating a peak in AFC during this stage of development. The accumulation of preantral and/or small antral follicles in adolescents does not appear to be due to a diminished FSH stimulus, a necessary driver of cyclic antral follicle growth (to >5 mm) (58) and recruitment, as we previously found that early postmenarchal girls demonstrate a robust intercycle FSH rise (18). Instead, we hypothesize that immaturity in the complex intra-ovarian endocrine and paracrine signaling mechanisms that exist among granulosa cells, theca cells, and the oocyte (59) cause follicles to accumulate. This idea is supported by histopathological studies demonstrating discrepancies in the maturity of the right and left ovary from the same pubertal child; that is, 1 ovary appears to have learned to ovulate much before the other (5). Investigation into how the normal ovary matures and is pruned of excess antral follicles, either by increased recruitment and growth or by atresia, may provide insights into the pathogenesis of PCOS, wherein follicles are arrested at the preantral and antral stage.
Abbreviations
- 17OHP
17-hydroxy-progesterone
- AD
androstenedione
- AFC
antral follicle count
- ANOV
anovulatory cycle
- BMI
body mass index
- CI
confidence interval
- CV
coefficient of variation
- DHEAS
dehydroepiandrosterone sulfate
- E2
estradiol
- LC/MS-MS
liquid chromatography/tandem mass spectometry
- ln
natural-log
- OV
ovulatory
- P4
progesterone
- PCOS
polycystic ovarian syndrome
- PCOM
polycystic ovarian morphology
- Pd
pregnanediol
- TT
total testosterone
Acknowledgments
The authors thank and acknowledge the nurses of the Massachusetts General Hospital Clinical Research Center for their support in conducting these studies; Margaret George, Annette Rice, and Chris McGee for assistance in sample processing; and the Ligand Assay and Analysis Core at the University of Virginia Center for Research in Reproduction for performing the AMH assays.
Funding Support: This work was supported, in part, by the Intramural Research Program of the National Institutes of Health, National Institute of Environmental Health Sciences (Z01-ES103315) and by grant 1UL1TR001102. N.D.S. is also supported as a Lasker Clinical Research Scholar (1SI2ES025429-01). The content is solely the responsibility of the authors and does not necessarily represent the official views of the National Center for Research Resources, the National Center for Advancing Translational Science, or the National Institutes of Health.
Clinicaltrials.gov registration number: NCT02486757 (registered July 1, 2015).
Additional Information
Disclosure Summary: The authors have nothing to disclose.
Data Availability: The datasets generated during and/or analyzed during the current study are not publicly available but are available from the corresponding author on reasonable request.
References and Notes
