


Abstract
In humans, approximately 95% of circulating cortisol is bound to corticosteroid-binding globulin and albumin. It is only the free fraction that is biologically active and can activate signaling pathways via glucocorticoid hormone receptors in cells. Microdialysis is a well-established technique that enables the sampling of molecules in different compartments of the body, including extracellular fluid. This is the first study validating a rapid sampling microdialysis method measuring free cortisol in the subcutaneous and blood compartments of healthy volunteers.
Healthy nonsmoking volunteers (42 men, aged 18–24 years; body mass index 18–25 kg/m2) received placebo (saline), 250 μg Synacthen, or 1 mg dexamethasone with 10-minute sampling to measure total and free cortisol (subcutaneous, intravenous, and saliva) for an hour before and 4 hours after administration.
Following stimulation by Synacthen, total serum cortisol and free cortisol in both compartments rose significantly, achieving and maintaining maximum levels between 2 and 3 hours following the stimulus. A decline in cortisol levels was evident after the administration of dexamethasone or placebo, but there was a clear pulsatile activity around lunchtime in the latter group, which was prominent in the blood compartment (total and free cortisol). There was good correlation between serum total and free cortisol (subcutaneous and intravenous) in the Synacthen and dexamethasone groups with no significant delay (less than 5 minutes) between total and free cortisol.
This seminal study demonstrated the dynamic responses of total blood cortisol and microdialysis derived free cortisol in blood, subcutaneous tissue, and saliva in men.
The hypothalamic–pituitary–adrenal (HPA) axis is the key neuroendocrine system responsible for maintaining homeostasis, mediating its effects through glucocorticoid hormones, corticosterone in the rodent and predominantly cortisol in man. Approximately 95% of circulating cortisol in men is inactive as it is bound to plasma proteins such as corticosteroid-binding globulin (CBG; aka transcortin or SerpinA6 (1)) and albumin (2). Only the free fraction of the hormone is biologically active as it activates signaling pathways via binding to glucocorticoid hormone receptors in cells (Fig. 1).
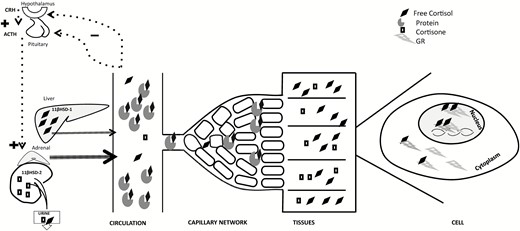
Hypothalamic–pituitary–adrenal tissue axis. CRH from the hypothalamus stimulates ACTH release from the anterior pituitary resulting in cortisol production from the adrenal glands. Free cortisol thus released in the vascular system circulates as protein-bound (≈95%) and free (≈5%) fractions. Free hormone enters tissues, then into each cell where it binds its receptors (only glucocorticoid receptor GR represented in this figure). Hormone-receptor complex translocates from the cytoplasm to the nucleus, attaches to the glucocorticoid response element on the DNA triggering a cascade of events leading to hormone actions. Liver and adipose tissue predominantly convert circulating cortisone to active cortisol mediated by 11βHSD-1 while 11βHSD-2 in the saliva and kidney converts cortisol into inactive cortisone. Abbreviations: CRH, corticotropin-releasing hormone; ACTH, adrenocorticotropic hormone; GR, glucocorticoid receptor; DNA, deoxyribonucleic acid; 11 βHSD-1, 11β-Hydroxysteroid dehydrogenase type 1; 11βHSD-2, 11β-Hydroxysteroid dehydrogenase type 2.
Microdialysis is a well-established technique that enables the sampling of molecules in different compartments of the body, including extracellular fluid. Microdialysis has originally been developed for monitoring neurotransmitter levels in the brain of rodents and to study the effects of pharmacological interventions (3). However, in the early 1990s, it was recognized that microdialysis could be applied to the measurement of glucocorticoid hormones in peripheral (4) and brain tissue (5) of the rat. This approach opened up the use of in vivo microdialysis for physiological studies with a particular focus on the stress hormone response (6). Importantly, microdialysis offers the significant advantage of directly measuring the active free component of glucocorticoid hormone, because the size of the membrane pores precludes diffusion of protein-bound glucocorticoid molecules. Using microdialysis in freely behaving rats and mice, Linthorst, Reul and colleagues (6–10) showed stressor-specific free corticosterone responses in the brain and elucidated the role of corticotropin-releasing factor (CRF), the glucocorticoid receptor (GR) and peripheral CBG in the regulation of free corticosterone levels.
Recent studies have demonstrated the use of microdialysis to measure free cortisol in healthy controls and in patients undergoing medical and surgical stress (elective coronary artery bypass graft) (11), in critically ill patients (12) including those in septic shock (13, 14), and burns patients (15). Free cortisol was measured by equilibrium dialysis (11, 12) or ultrafiltration (13) in blood and by microdialysis in the subcutaneous (SC) adipose tissue (14), dermis (15) and brain (16). These studies however did not look in detail at dynamic changes in free cortisol levels. Conversely, in rats and mice, high-resolution microdialysis has successfully been used to demonstrate circadian and ultradian free corticosterone rhythms and to capture dynamic free hormone responses to physiological and pharmacological challenges (6, 9, 17).
Within this context, we aimed to translate this approach into high-resolution microdialysis in humans, which will ultimately enable us to study in detail dynamic free cortisol responses during health and disease. We aim to achieve this goal by validating a rapid sampling microdialysis method measuring free cortisol in the SC and blood compartments of healthy volunteers.
Subcutaneous and blood-free cortisol levels in dialysates were compared with total serum cortisol levels and free cortisol levels in saliva. The responsiveness of free and total cortisol in the different compartments, and their intricate relationship, were studied by stimulating cortisol release from the adrenal cortex with synthetic adrenocorticotropic hormone (ACTH) and by suppression of HPA axis activity by dexamethasone. The plasma responses of total cortisol to stimulation with synthetic ACTH or suppression by exogenous dexamethasone are well established and used as diagnostic tests in clinical practice, but there is little information about the effect of these compounds on free cortisol levels in extracellular fluid.
Materials and Methods
Participants
Nonsmoking male volunteers (n = 42) with normal body mass index (18–25 kg/m2), aged 18 to 24 years, were recruited as per local ethical committee regulations (Application reference 08/H0101/16), in accordance with the Helsinki principles. All participants gave informed written consent before their participation in the study. They had no known, past or present, medical conditions; were on no regular pharmacological treatment including oral or parenteral corticosteroid use; and had no known drug allergies.
Microdialysis procedure
Subcutaneous microdialysis.
Subcutaneous microdialysis was performed using a sterile CMA 66 linear microdialysis catheter (Microdialysis AB, Stockholm, Sweden) with polyarylethersulfone membrane, length 30 mm, diameter 0.5 mm, molecular cut-off 20 kDa; polyurethane inlet and outlet tubes 400 and 100 mm, respectively, membrane diameter 0.5 mm. Commercially available sterile physiological perfusion fluid for peripheral tissue use (T1, M Dialysis AB formerly CMA Microdialysis, Stockholm, Sweden; sodium 147mmol/L, potassium 4mmol/L, calcium 2.3 mmol/L, chloride 156 mmol/L) was used to perfuse the SC catheter.
Intravenous microdialysis.
Intravenous microdialysis was performed using a sterile MicroEye PME011 (Probe Scientific, Coventry, UK) concentric catheter (polymer membrane, length 15 mm, 0.2 mm diameter, molecular cut-off 9 kDa; PA6228 inlet and outlet tubes 400 mm and 200 mm, respectively). The intravenous catheter was perfused with a sterile mixture of 2 mL of 0.9% saline and 0.5 mL Arixtra (Fondaparinux Sodium, GlaxoSmithKline, Middlesex, UK) for anticoagulation. Prior to use, the outlet tube of each catheter was truncated to 100 mm (to match the length of SC catheter) with a sterile blade and its membrane was dipped in Arixtra to avoid microclots (as per manufacturer’s instructions).
Sampling.
A portable CMA 107 microdialysis pump with a sterile CMA 106 pump syringe (CMA Microdialysis AB, Stockholm, Sweden) at a flow rate of 2 µl/min was used for all experiments. Microdialysates were collected manually in polypropylene vials (300 µl; Royem Scientific Limited, Luton, UK) and stored at –80° C until assay.
Collection of blood and saliva samples
Blood samples were collected as described previously by Henley et al (18), saliva samples were collected using Salivette® Cortisol synthetic swabs (Sarstedt, Nümbrecht, Germany) and stored at minus 80° C after centrifugation.
Experimental design
Participants arrived at the clinical research unit at least an hour in advance, and intravenous cannulae and microdialysis catheters were inserted and set up at least 45 minutes before the start of the experiment. The participants remained seated in a chair or reclining on a bed throughout the duration of sampling apart from during comfort breaks, when sampling was not interrupted. Standard meals were served at midday for all experiments. Subjects were allowed to carry out work-related activities on their personal computers.
An intravenous cannula for blood sampling was inserted in the left ante-cubital fossa, and a SC microdialysis catheter was inserted subcutaneously in the middle part of lateral left upper arm (experiment 1; Figs. 2 and 3) or the lower anterior abdomen (experiment 2; Figs. 2 and 4). For experiment 2, in addition to the SC microdialysis catheter, a concentric microdialysis catheter was inserted via an 18-G B-Braun intravenous catheter as per manufacturer’s recommendation in the right ante-cubital fossa (arm opposite to that used for blood sampling).
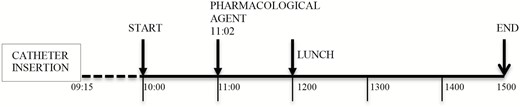
Design of experiments 1 and 2. All catheter insertions were completed by 09:15. Sampling period of experiment 1 was 10:00 to 15:00 and 09:55 to 15:05 of experiment 2. Pharmacological agent, including saline/placebo, was injected by 11:02. Lunch was served at 12:00.
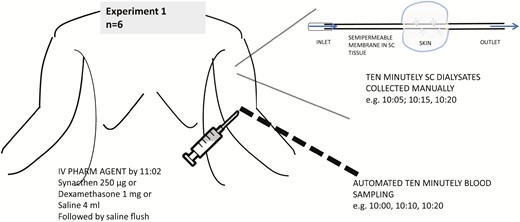
Protocol for experiment 1. Ten-minute sampling was done from 10:00 to 15:00 manually for subcutaneous free cortisol and via automated sampling for blood. Pharmacological agent including saline/placebo was injected by 11:02. Lunch was served at 12:00.
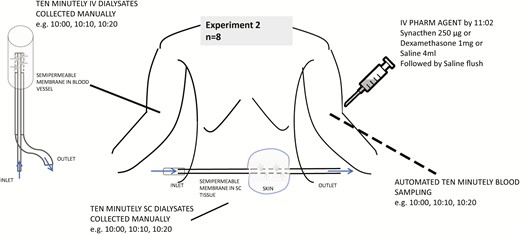
Protocol for experiment 2. Ten-minute sampling was done from 09:55 to 15:05 manually for subcutaneous and intravenous free cortisol. Automated sampling of blood was done from 10:00 to 15:00. Pharmacological agent including saline/placebo was injected by 11:02. Lunch was served at 12:00.
Both serum and microdialysate samples were collected at 10-minute intervals (Figs. 3 and 4). Two sets of experiments were conducted. The differences between the experiments include compartments studied using microdialysis and timing of the dialysates in relation to blood sampling. In the first experiment, the site of the SC catheter was upper arm, and dialysate sampling clock-period was 10:00 to 15:00 (n = 6). As microdialysate sampling is continuous, the sample reading was considered to represent the midpoint of a given sampling duration (eg, sample timing of 10:05 was for dialysate obtained between 10:00 and 10:10 and so on). In the second experiment, the site of the SC catheter was anterior abdomen; an additional intravenous microdialysis catheter was also inserted, and the dialysate sampling clock period was 09:55 to 15:05 (n = 8 participants). In both experiments, serum samples were collected at 10:00, 10:10, etc. The dialysate samples in the first experiment correspond to 10:05, 10:15, and so on, and in the second sample timings coincide exactly with that of blood. Saliva samples were collected every 30 minutes during both sets of experiments starting at 10:00.
In both experiments, one of the pharmacological agents (Synacthen 250 µg; Ciba-Geigy, Basel, Switzerland), dexamethasone 1 mg (1 mL of 3 mL saline mixed with 1 mL [4 mg/mL] dexamethasone; Organon laboratories, Cambridge UK), or saline (sodium chloride 0.9%; Pfizer Ltd, Kent UK) was administered by 11:02 (Fig. 2).
Assays
Serum total cortisol concentrations were measured by electrochemiluminescent immunoassay (using a Cobas® e601 immunoassay analyzer; Roche Diagnostics, Burgess Hill, UK). Intra-assay (inter-assay) precision for serum concentrations of 208, 561, and 1268 nmol/L had coefficients of variation (CV) of 1.3%, 1.3%, and 1.1% (1.6%, 1.5%, and 1.6 %), respectively. Dialysate samples were analyzed using an enzyme-linked immunosorbent assay (ELISA) for salivary (free) cortisol (IBL, Hamburg, Germany), which was optimized for the measurement of free cortisol in small dialysate volumes (15 µl instead of the recommended 20 µl). The small dialysate volumes allowed a singlicate measurement of each sample. The intra-assay (inter-assay) precision for saliva concentrations of 7.45 and 64.58 nmol/L had CVs of 7.3%, and 3.1% (8.8% and 6.4%), respectively. The cross reactivity of the assay with dexamethasone is stated by the manufacturer to be less than 1%. Saliva samples were prepared for analysis using a liquid–liquid extraction procedure with deuterated internal standards (d4-cortisol and d7-cortisone) before isocratic separation UPLC® (Waters Acquity, BEH C18, Milford, MA US) and quantitation by MS/MS (Waters Premier XE, Milford, MA US). Salivary cortisol and cortisone were analyzed with an in-house assay developed by the Department of Clinical Biochemistry, University Hospitals Bristol NHS Foundation Trust, Bristol, United Kingdom using UPLC®-tandem mass spectrometry (Waters Acquity-Premier XE, Waters, Milford, MA US). The inter-assay CVs for cortisol were 17.6 % and 9.9 % for 2 nmol/L and 46 nmol/L, respectively, whereas those for cortisone were 6.7 % and 10.4 % for 4 nmol/L and 94 nmol/L respectively. The intra-assay CVs for cortisol were 18.3 % and 8.8 % for 2 nmol/L and 46 nmol/L, respectively, whereas those for cortisone were 10.2 % and 8.0 % for 4 nmol/L and 94 nmol/L, respectively.
Statistical analyses
Analyses were performed with Stata 13 (Stata Corp, College Station, TX, US).
For graphical purposes, Figs. 5 and 6 show data as mean ± standard error of mean. As the data are not normally distributed, median values and ranges have been calculated and are presented in the text. The direction of change was assumed from serum to SC tissue (ie, the pattern in the former would precede the latter); correlations between serum, SC, and saliva values were estimated using Spearman’s rank test for different time lags. In experiment 1, the range of time lag was from 5 to 125 minutes (ie, values of serum cortisol at time 0 were correlated with successive 10-minute values of SC free cortisol, from 5 to 125 minutes: due to the design of the experiment, there was a minimum of 5 minutes difference between successive serum total and SC free cortisol measurement). In experiment 2, the time lag range was from isotemporal measurements (lag zero) to lag 120 minutes. A limit of either 120 (experiment 1) or 125 minutes (experiment 2) was decided as there were no further values after these time points.
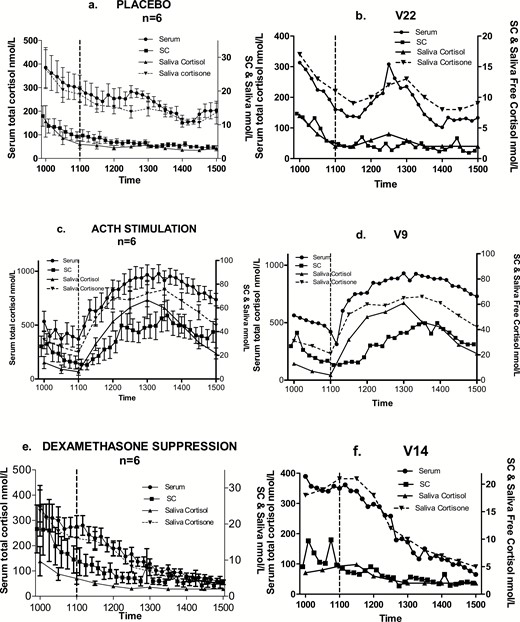
Group (a,c,e; mean and standard error of mean) and typical profiles within each group (b,d,f) of cortisol in serum (total), subcutaneous tissue (free fraction) and saliva (free fraction and cortisone). Saline/placebo (a,b), 250 µg Synacthen (c,d), or 1 mg dexamethasone (e,f) were administered by 11:02 hours. Sampling commenced at 10:00 with ten-minute samples collected until 15:00. Saliva samples were collected every half hour starting at 10:00. Lunch was served at 12:00.
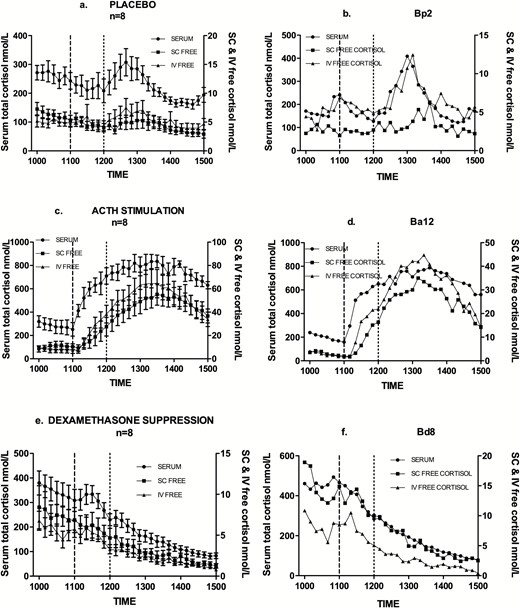
Group (a,c,e; mean and standard error of mean) and typical profiles within each group (b,d,f) of cortisol in serum (total) and in subcutaneous and intravenous compartments (free fraction). Saline (a,b), 250 µg Synacthen (c,d), or 1mg dexamethasone (e,f) were administered by 11:02 hours. Sampling commenced at 10:00 for serum, and at 09:55 for SC & IV with ten minutely samples being collected up to 15:00. Lunch was served at 12:00.
To further examine the relationship between serum total and SC free cortisol, data from the two individual experiments 1 and 2 were combined. Log transformation of this entire dataset was carried out and smoothed time-wise mean of these log-transformed values were plotted using the R statistical software (19).
Results
Experiment 1: free cortisol in the SC tissue compartment
Fig. 5 shows the expected circadian reduction in both total and SC free cortisol between 10:00 and 11:00, before the administration of a pharmacological agent. Following stimulation by Synacthen, there is a marked and rapid rise in cortisol levels in all compartments. Peak levels are achieved between 2 and 3 hours post administration, with a gradual decline in the final hour of sampling. The median serum total cortisol level immediately before Synacthen was 321 nmol/L (range 188–773) and at peak was 973 nmol/L (range 778–1369) between 2 and 3 hours post injection. The median SC tissue free cortisol level pre-Synacthen was 11.5 nmol/L (range 2.3–38.5) and at peak was 67.4 nmol/L (18.7–101.5) between 1 and 3.25 hours post injection.
Median serum total cortisol level pre dexamethasone (Fig. 5) was 265.0 nmol/L (range 169.0–434.0) and nadir level post dexamethasone was 66.0 nmol/L (range 34.0–78.0). For SC tissue free cortisol values, median predexamethasone level was 6.0 nmol/L (range 3.2–24.4) and nadir 2.0 nmol/L (range 0.9–4.4). Continued decline in cortisol levels is evident after the administration of dexamethasone and placebo, but there was a clear pulsatile activity around lunchtime (midday) in the latter group. This pulse was prominent in serum but less so in SC tissue. Peak level of this pulse in serum cortisol was observed between 30 and 60 minutes after serving lunch and had returned to baseline (prelunch levels) latest by 2 hours.
Spearman correlation coefficients between serum and SC tissue measurements were calculated for the entire group in each treatment arm (Table 1); there was a significant correlation in both the treatment groups but not in the placebo group.
Correlation between Serum and SC Cortisol at Time Lag 5 Minutes (Minimum Time Difference in This Study)
| Treatment (n = 6) | Spearman Correlation Coefficient | P-Value |
|---|---|---|
| ACTH | 0.75 | <0.0001 |
| Dexamethasone | 0.68 | <0.001 |
| Placebo | 0.36 | 0.102 |
| Treatment (n = 6) | Spearman Correlation Coefficient | P-Value |
|---|---|---|
| ACTH | 0.75 | <0.0001 |
| Dexamethasone | 0.68 | <0.001 |
| Placebo | 0.36 | 0.102 |
Abbreviation: ACTH, Adrenocorticotropic hormone.
To address the existence of any delay between serum total and SC free cortisol levels a maximum delay of 125 minutes was considered in keeping with the sampling duration. Spearman correlation coefficient values were computed (Fig. 7) at successive 10-minute time delay such that SC would lag behind serum from a minimum of 5 minutes to maximum of 125 minutes. No clear trends in correlation coefficients were found for the placebo and dexamethasone-treated groups; conversely, correlation coefficients for ACTH shows a steady and significant decline with increasing lag times, reflecting the profound increase and subsequent decrease to baseline levels in cortisol over the course of the experiment.
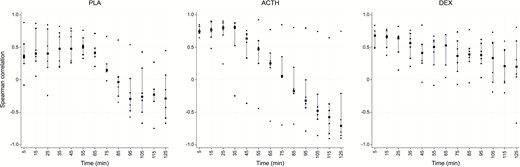
Spearman correlation coefficient values (y axis) between serum and SC at successive 5-minute time delay from 5 to 125 minutes (x axis). Squares indicate median values, vertical bars the interquartile range and dots are individual participant values. There is no significant trend in placebo and dexamethasone groups.
Correlations were calculated as in Fig. 8 to investigate the relationship between SC tissue free cortisol and that of saliva free cortisol and saliva cortisone. For each of the 3 interventional groups, the median correlation between saliva cortisone and SC was better (+0.5, +0.83, and +0.9 for the Synacthen, dexamethasone, and placebo groups, respectively) than that between saliva free cortisol and SC (+0.21, +0.6, and +0.4, respectively). At baseline, cortisone levels were higher than cortisol levels in saliva and the increase in the latter following Synacthen was more than that in the former.
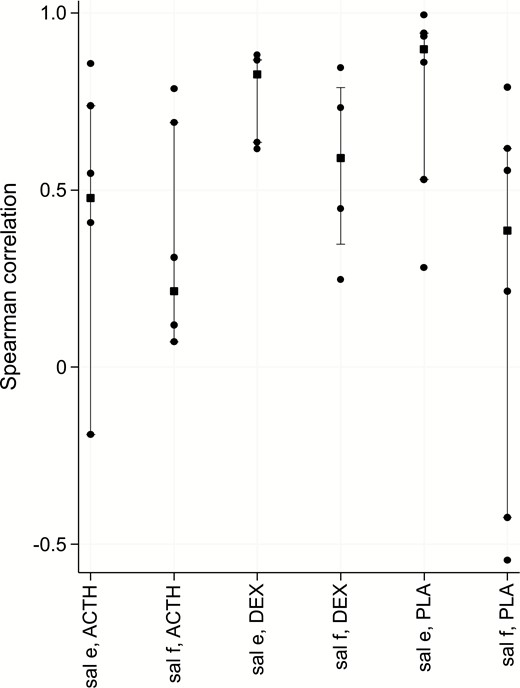
Spearman correlation between SC and either saliva free cortisol (f) or cortisone (e) for each of the treatment groups (SynACTHen stimulation, DEXamethasone suppression or PLAcebo) at time lag of 5 minutes. Squares indicate median values, vertical bars the interquartile range and dots denote individual participant values.
Experiment 2: free cortisol in the SC and intravenous compartments
As in experiment 1, normal circadian fall was seen between 10:00 and 11:00 before the administration of a pharmacological agent (Fig. 6). Following stimulation by Synacthen, total serum cortisol as well as free cortisol rose significantly, achieving and maintaining maximum levels between 2 and 3 hours following the stimulus, with gradual decline in the final hour of sampling. The median serum total cortisol level immediately before Synacthen was 238.0 nmol/L (range 95.0–375.0) and at peak was 872.0 nmol/L (range 600.0–960.0) between 110 and 150 minutes post injection. The median free cortisol pre-Synacthen in SC tissue level and intravenous compartment was 6.1 nmol/L (range 0.6–16.75) and 2.7 mmol/L (range 0.6–16.75), respectively, with peak of 44.55 nmol/L (28.8–95.7) between 120 and 190 minutes post injection in SC tissue and 53.6 (range 29.3–101.7) between 120 and 160 minutes in intravenous compartment.
Median serum total cortisol level before the administration of dexamethasone was 265.0 nmol/L (range 144.0–475.0), and nadir level post dexamethasone was 62.6 nmol/L (range 37.3–122.8). The median predexamethasone level for SC tissue free cortisol was 5.5 nmol/L (range 3.2–11.8) and nadir 0.61 nmol/L (range 0.13–1.76) whereas those for intravenous free cortisol were 5.8 nmol/L (range 1.7–9.3) and 0.5 nmol/L (range 0.3–1.3), respectively. As in the first experiment, the difference between placebo and dexamethasone groups peaked around lunchtime (at midday) in all participants on a background of declining cortisol levels for the duration of sampling (Fig. 6). As in experiment 1, this activity was prominent in serum total cortisol levels and less so in SC free cortisol levels, but the intravenous free cortisol also showed the pulsatile rise.
Correlation coefficients were calculated for paired combinations of serum total and SC tissue free and intravenous free cortisol for each treatment group (Table 2). Similar to experiment 1, whereas the correlations for the placebo group was not statistically significant, strong and significant correlations between cortisol in the different compartments were found in the stimulation and suppression groups.
Correlation Coefficients at Time Lag 0
| Treatment | Serum and SC Free | Serum and IV Free | SC Free and IV Free |
|---|---|---|---|
| ACTH | 0.68 (P = 0.001) | 0.76 (P < 0.001) | 0.82 (P < 0.001) |
| Dexamethasone | 0.82 (P < 0.001) | 0.86 (P < 0.001) | 0.82 (P < 0.001) |
| Placebo | 0.21 (P = 0.322) | 0.55 (P = 0.008) | 0.25 (P = 0.309) |
P-values are in parentheses.
Abbreviations: ACTH, adrenocorticotropic hormone; IV, intravenous; SC, subcutaneous.
To investigate whether a possible delay exists between serum and SC, serum and intravenous free levels, and SC and intravenous free levels, correlations were computed for time-lag range of 0 to 120 minutes (Fig. 9) at successive 10-minute time delay such that SC would lag behind serum from a minimum of 10 minutes to maximum of 120 minutes. There was no significant trend in placebo and dexamethasone groups, with the best positive correlation at time 0. For Synacthen group, however, there was a trend such that the median correlation value at 35 minutes (+0.52) was nearly equally inverse of that at 120 minutes (–0.58). This suggests that 120 minutes following a pulse of cortisol, SC value would be expected to decline further, supporting the previous data.
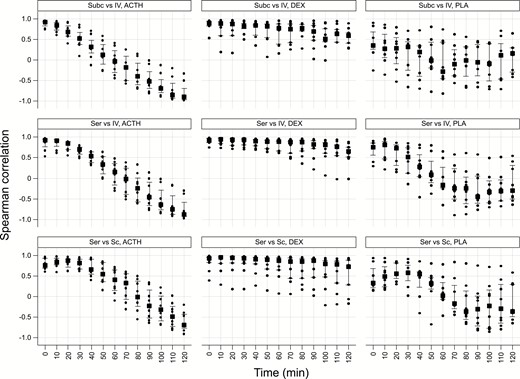
Spearman correlation coefficient values (y axis) between serum and SC (bottom row); serum and IV free (middle row) and, SC and IV free (top row) cortisol at successive 10-minute time delay from 0 to 120 minutes (x axis). SynACTHen group results are in the left column, DEXamethasone in the middle column, and PLAcebo in the right column. Squares indicate median values, vertical bars the interquartile range, and dots are individual participant values. There is no significant trend in placebo and dexamethasone groups. For ACTH group, there is a trend such that the median correlation value at time 0 is nearly equally inverse at 120 minutes. Abbreviations: ACTH, Adrenocorticotropic hormone; IV, intravenous; SC, subcutaneous.
Correlation coefficients were calculated to examine the relationship between SC tissue free cortisol and saliva free cortisol and saliva cortisone (Fig. 10). The strongest median correlation was found for the dexamethasone group (0.88), and it was true for both saliva fractions. The relationships for the remaining two treatment groups were weaker (0.3–0.5) for both saliva fractions. At baseline, cortisone levels were higher than cortisol levels in saliva and the increase in the latter following Synacthen was more than that in the former fraction.
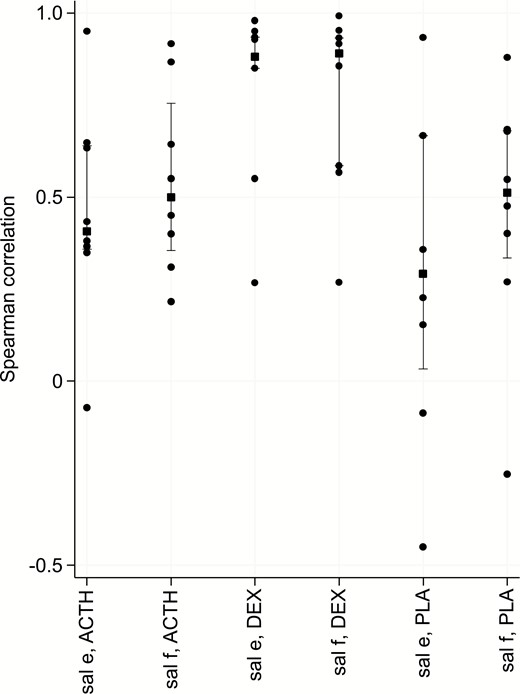
Spearman correlation (y axis) between SC and either saliva free cortisol (f) or cortisone (e) per treatment groups (ACTH stimulation, DEXamethasone suppression or PLAcebo) at isotemporal lag time. Squares indicate median values, vertical bars the interquartile range and dots denote individual participant values.Abbreviations: ACTH, adrenocorticotropic hormone; SC, subcutaneous.
To further examine the relationship between serum total and SC free cortisol, data from the two experiments were combined. There was a strong evidence of effect of treatment in each of the 3 groups (Fig. 11). In the dexamethasone group, the mean values from both the experiments continue to decline throughout the experiment like in the placebo group, apart from the mealtime peak in the latter group as previously mentioned. The mean peak values from the 2 experiments following Synacthen overlap, suggesting maximum stimulation at 2 hours (regardless of baseline levels). The mean nadir values from the 2 experiments remain separated in the dexamethasone group; however, in the placebo groups, there is a hint of an upward deflection in the second set of experiments.
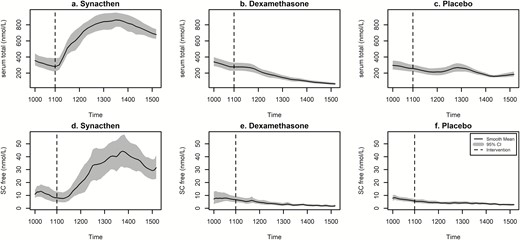
Log transformed mean values of serum total (upper panel) and SC free cortisol (lower panel) from the two pharmacological manipulation experiments. Bold line represents smoothed mean of all values and shaded area represents 95% confidence intervals. Dotted vertical lines indicate time of pharmacological intervention (eg, Synacthen, dexamethasone, or placebo). x axis displays clock time.
Cross-correlation plots of log transformed serum total and SC free cortisol for each individual in each of the treatment arms of the 2 studies are shown in Fig. 12. This data confirmed previous analysis by demonstrating significant positive cross-correlation between serum and SC values across all participants in the Synacthen and dexamethasone groups. However, there was variability in the placebo group with poorer cross-correlation across the group, confirmed by the nonsignificant Spearman correlation coefficients calculated previously.
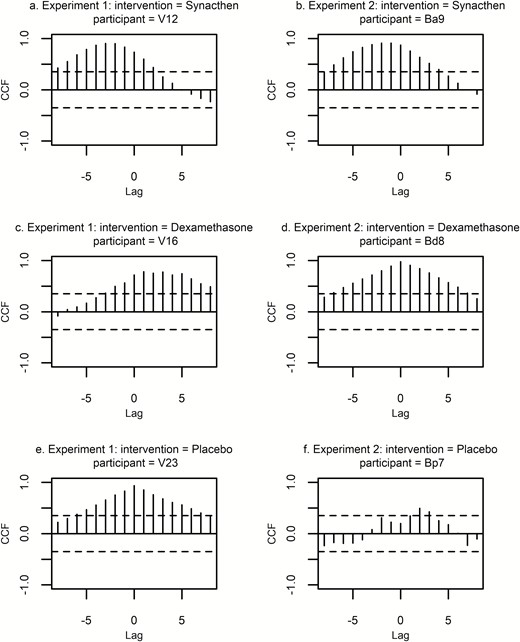
Cross-correlation plots of log transformed serum total and SC free cortisol for representative individuals from the 2 experiments described in the text. ACF is on y axis, time lag on x axis (lag 1 = 10 minutes). Plots on the left are three typical individuals per treatment group from experiment 1 and those on the right from experiment 2. The top row = Synacthen group, middle row = dexamethasone group, and the bottom row = the placebo group. Dotted lines indicate confidence intervals. Where vertical lines exceed dotted line (top two rows), there is a significant cross correlation. Abbreviations: ACF, autocorrelation factor; SC, subcutaneous.
Discussion
To our knowledge, this is the first study demonstrating the relationship between total cortisol in serum and free cortisol in 3 body compartments. We compared the dynamic responses of total blood cortisol and microdialysis-derived free cortisol in blood, subcutaneous tissue, and saliva in men. The only studies to have compared the dynamic responses of both blood and tissue glucocorticoid levels have been performed in the rat. A landmark series of studies of free corticosterone rhythms in different body compartments were performed using stress paradigm in which animals are forced to swim in water at 25° C. In these studies, peak free hormone levels in the intravascular compartment, SC tissue (9) and the brain (hippocampus) (6, 17) were found 20 minutes later than the peak of total hormone in the plasma.
Rather than using a stress maneuver, we used the Synacthen test, first described by Wood (20) to ascertain adrenocortical reserve and can be performed at any time of the day (21). It has been shown to correlate well with responses to major surgical stress (11, 22). There is a large literature relating to serum total cortisol levels at time 0 and 30 (and/or 60) minutes after Synacthen, but little is known about the effect on the pattern of free cortisol levels in a tissue, other than saliva (23).
There was good correlation between serum total and free cortisol (SC and intravenous) in the Synacthen and dexamethasone groups, with no discrimination between compartments. Forced swim stress in rodents showed a 20-minute delay in free corticosterone rise in the hippocampus, blood, and subcutaneous tissue, compared to total corticosterone in blood (6, 9), most likely as a consequence of a stressor-specific rise in circulating CBG from the liver (9). This was not the case in our studies although delay of less than 5 minutes, if present, could not be ruled out due to the sampling frequency used in this study. The relationship between serum total and free cortisol (SC and intravenous) is not as strong in the placebo group, which is expected in a short sampling duration due to individually distinct secretory pulse patterns. With stimulation and suppression, the axis was entrained resulting in better correlation, whereas in the placebo group inter-individual variation in pulses is likely to have affected the correlation values.
There was evidence of some secretory activity around noon in the placebo group—the only difference between placebo and dexamethasone groups. The clearly visible peak in serum was not discernible in the SC tissue in the majority of subjects but was visible in the intravenous free fraction. This was especially true when the serum total cortisol peak was 400 nmol/L or more and when serum total cortisol was at or above this level a change in SC levels was more noticeable. This may relate to the fact that this is the level of plasma cortisol at which CBG becomes saturated, and any further change in cortisol results in a disproportionately large increase in free cortisol (24). Changes in the level of CBG or its affinity for cortisol via neutrophil elastase or changes in temperature can also alter free cortisol fractions (25). Change in albumin levels affecting free cortisol levels is relatively less strong (11). In our cohort of normal individuals, there is no reason to expect abnormalities of albumin or CBG levels or that there would be changes in body temperature known to markedly alter affinity of CBG for cortisol (24). Lunch was served to all individuals in the study groups at noon.
The Synacthen studies produced a prompt and marked rise in plasma and free cortisol followed by decline in levels 120 to 125 minutes later in both the SC and intravenous compartments. The pharmacodynamics of Synacthen (1–24) are somewhat different to endogenous ACTH (1–39), with high levels evident up to 60 minutes following an intravenous injection of high-dose Synacthen (26). Serum total cortisol levels post 250 μg of Synacthen continue to increase at least until 75 minutes (26). Therefore, an endogenous cortisol pulse (of a shorter duration and consequent drop to lower levels) (27, 28), with no further hormone secretion, would lead to drop in free cortisol levels in the SC tissue. This phenomenon may also be related to the saturation kinetics of CBG. Total and free cortisol remain in equilibrium in the serum, and free unbound cortisol will readily diffuse into tissues resulting in a rise in tissue levels soon after a pulse. With no further adrenal secretion of cortisol, if plasma cortisol levels dropped, CBG would no longer be saturated, and there could be a concentration gradient of free cortisol from subcutaneous tissue to the blood compartment. The half-life of free cortisol in subcutaneous tissue is not known but could also contribute to this relationship.
Exclusion of female participants, to avoid problems associated with menstrual cycle–dependent changes in the levels of estrogen and progesterone and their resulting effects on levels of CBG and competition for binding to CBG, respectively, is a limitation of this study. We have attempted to exclude methodological factors that could influence our data. Both the free cortisol fractions for each individual were assayed in the same batch by the same method to minimize inaccuracies related to inter-assay variation. The membrane length of the SC was twice that of intravenous microdialysis probe, which could potentially result in differential recovery rates. In reality, the difference in recovery of cortisol from the 2 probes in in vitro experiments was minimal (about 10%), not requiring an adjustment factor for membrane length. To avoid discrepancies related to post prandial release of cortisol all of our participants received a standard lunch (commercially available “healthy range” sandwich, orange juice, and piece of fruit), providing consistency of food intake around the midday/meal-related peak (29, 30).
The relationship between saliva cortisol and cortisone with SC free cortisol was not the primary focus of this study. Infrequent (30-minute) sampling and differential (nonidentical) timing in relation to dialysates in the 2 experiments meant that pooling the data was of no benefit (unlike the pooling of serum total and SC free cortisol). Cortisone appeared to be a better correlate of SC free cortisol as described previously (23).
In this study we have sought to ascertain how levels of free cortisol in both the blood and subcutaneous compartments of the body correlate with levels of total cortisol in the blood using both a stimulus with Synacthen and inhibition by dexamethasone. In both situations, we found good correlation with total cortisol. We have found no significant delay between total levels in the blood and free levels in the blood and subcutaneous tissue, although it was not possible to detect a delay of less than 5 minutes. Despite these good correlations, smaller endogenous pulses appeared to not be readily detected in the SC tissue. Investigating the relationship between serum total and SC free cortisol during undisturbed endogenous secretory activity will need further investigation. This study should now pave the way for investigating the levels of free cortisol certainly in subcutaneous and possibly other tissues and thereby increase our understanding the role of cortisol in disease pathophysiology, particularly in conjunction with the previously reported ambulatory sampling device (31).
Acknowledgments
We thanks all healthy volunteer participants and W Woltersdorf for his assistance with the use of chemical pathology laboratory.
Financial Support: This study has been funded by OPTIMI (EU-Grant FP7 248544).
Additional Information
Data Availability: All data generated or analyzed during this study are included in this published article or in the data repositories listed in References.
References
Author notes
Shared senior authorship.
