


Abstract
No studies have assessed the association between air pollution exposure and vitamin D status in pregnant women.
To examine the association between particulate air pollution exposure and circulating 25-hydroxyvitamin [25(OH)D] levels in pregnant women.
A longitudinal cohort study.
A total of 3285 pregnant women were recruited at a maternal and child health hospital.
None.
Serum 25(OH)D levels.
We observed trimester-specific associations between particulate air pollution exposure and circulating 25(OH)D levels. The associations were most pronounced for the periods of the third trimester and the entire pregnancy. A 10 μg/m3 increase in fine particulate matter (PM2.5) and particulate matter with aerodynamic diameter ≤10 μm (PM10) exposure during the entire pregnancy was associated with a 4.62% (95% CI, −6.31% to −2.93%) and 5.06% (95% CI, −6.50% to −3.62%) decrease in 25(OH)D levels, respectively. Particulate air pollution exposure was also associated with elevated odds of maternal vitamin D deficiency. A 10 μg/m3 increase in PM2.5 and PM10 exposure during the entire pregnancy was associated with a 45% (OR = 1.45, 95% CI, 1.29 to 1.63) and 48% (OR = 1.48, 95% CI, 1.33 to 1.64) increase in the odds of maternal vitamin D deficiency. Mediation analysis estimated that decreased solar UV-B radiation mediated 69.5% and 66.4% of the inverse association between PM2.5 and PM10 exposure and circulating 25(OH)D levels.
Our results suggest that prenatal exposure to particulate air pollution may play an independent role in maternal vitamin D deficiency. The role of air pollution should be incorporated into future guidelines for the prevention of maternal vitamin D deficiency.
Vitamin D plays an integral role in maintaining phosphorus and calcium homeostasis and promoting bone mineralization (1–3). In addition to its skeletal effects, vitamin D is also involved in regulating the female reproductive process (4–6). Adequate vitamin D during pregnancy is essential for maintaining pregnancy as well as for normal fetal growth and development (7). Inadequate vitamin D has been shown to be implicated in adverse pregnancy outcomes, such as pre-eclampsia, gestational diabetes mellitus, fetal growth restriction, and preterm birth (8–11).
Several factors influence vitamin D status in humans, including vitamin D intake, age, race, body mass index (BMI), some chronic diseases, as well as those related to sun exposure (e.g., latitude, season, sunscreen use, outdoor activity) (12, 13). Recent human epidemiological studies indicate that particulate air pollution exposure may also alter circulating levels of 25-hydroxyvitamin D [25(OH)D], the critical biomarker of vitamin D nutritional status in humans (14). Several cross-sectional studies have suggested inverse associations between air pollution exposure and circulating levels of 25(OH)D in infants (15), young children (16), adolescents (17), and healthy women (18, 19). However, the effect of ambient particulate air pollution on circulating 25(OH)D levels in pregnant women has yet to be studied.
Additionally, the mechanisms underlying the association between air pollution exposure and maternal vitamin D status have not been fully elucidated. Because food sources of vitamin D are limited, skin synthesis upon natural UV-B radiation exposure is the most important source of vitamin D in humans (20, 21). Ambient particulate air pollution is one of the principal factors in determining the amount of UV-B reaching the Earth’s surface (22). One study conducted in India suggested that air pollution is inversely associated with the ground level of UV-B and children living in highly polluted areas are at increased risk of developing rickets (15). However, no study has characterized the role of UV-B radiation in mediating the effect of particulate air pollution exposure on 25(OH)D levels in pregnant women.
Thus, the objective of this study was to determine the association between particulate air pollution exposure and maternal circulating 25(OH)D levels in late pregnancy in 3285 pregnant women recruited from Yangzhou, China. Furthermore, using mediation analysis, we also examined whether and to what extent particulate air pollution decreased vitamin D levels through absorbing solar UV-B radiation. We hypothesized that particulate air pollution was associated with decreased total 25(OH)D levels in pregnant women, and part of this association was mediated by reducing the amount of solar UV-B reaching the Earth’s surface.
Methods
Study population
A longitudinal cohort study of pregnant women was established in May 2013 at the Maternal and Child Health Hospital of Yangzhou, Yangzhou, China. Participating women were enrolled during their initial prenatal visit at the Department of Women’s Health Care. Pregnant women over 18 years old, who were living in the city of Yangzhou and were willing to deliver at the study hospital were eligible for inclusion. Enrolled subjects were followed throughout the entire course of pregnancy.
Participating women were interviewed within two days after delivery. Self-report questionnaires were used to collect detailed information regarding maternal age, pre-pregnancy BMI, parity, education level and monthly income, smoking and drinking behavior during pregnancy, daily duration of sun exposure, outdoor activity, medical history, and vitamin D supplement use during pregnancy. The study design and protocols were reviewed by the ethics committee of the participating institutions, and informed consent was obtained from all participants before participation.
Air pollution and solar radiation data
Daily (24-hour) particulate air pollution data, including fine particulate matter (PM2.5) and particulate matter with aerodynamic diameter ≤10 μm (PM10) in the five monitoring stations of Yangzhou were obtained from the database of Yangzhou Municipal Environmental Bureau for the period from 2013 to 2015. In each monitoring station, routine measurement of PM2.5 and PM10 was carried out by the methods of beta attenuation (BAM 1020, MetOne Instruments Inc., Grants Pass, OR) and tapered element oscillating microbalance (Thermo RP1400a and RP 1405d analyzer, Thermo Fisher Scientific Inc., Waltham, MA). All measurements of air pollutants were performed according to specifications HJ/T 193-2005 and GB3095-2012 for ambient air quality monitoring.
We calculated the daily concentrations of PM2.5 and PM10 by averaging the available monitoring results of five fixed-site stations in Yangzhou. We calculated the average air pollution level over the entire pregnancy period (from birth to delivery) for each pregnant woman. To identify critical windows of exposure, we also averaged the daily concentrations of PM2.5 and PM10 for each of the three trimesters. We defined the first trimester as 1 to 13 weeks of gestation, the second trimester as 14 to 26 weeks of gestation, and the third trimester as 27 weeks of gestation to delivery.
To investigate whether the effect of particulate air pollution exposure on vitamin D levels in pregnant women was mediated by reducing the amount of solar UV-B radiation reaching the ground level, daily net radiation data were obtained from the Nanjing Meteorological Bureau, which lies at 118.54 °E, 31.56 °N, 50 km from the city of Yangzhou.
Maternal plasma 25(OH)D measurement
Circulating 25(OH)D is the principal biomarker of vitamin D status in humans (23–25). We quantified 25(OH)D concentrations in maternal plasma. Fasting venous blood was collected when pregnant women were admitted to the hospital in labor and in anticipation of delivery. Blood samples were then centrifuged at 4500 rpm for 15 minutes to obtain plasma. Maternal plasma was stored at −75°C until further analysis.
Plasma levels of 25(OH)D were determined using an ELISA kit (Immunodiagnostic Systems [IDS] Ltd., Boldon, Tyne & Wear, UK). The sensitivity of this assay in our study was 5 nmol/L, and the inter- and intra-assay coefficients of variation were <8%. According to the Endocrine Society clinical practice guidelines (26), maternal vitamin D deficiency was defined as plasma concentrations of 25(OH)D ≤20 ng/ml (50 nmol/L).
Statistical analysis
Data management and statistical analyses were conducted using SPSS (version 16.0) and R (version 3.2.3), and a two-sided P value < 0.05 was considered statistically significant. Exposure data were not normally distributed. Thus, the medians and the 25th and 75th percentiles were used to describe their distributions. Spearman correlation was conducted to calculate the associations between PM2.5 and PM10 exposure levels. Circulating 25(OH)D concentrations were natural logarithm transformed (ln-transformed) to obtain a normal distribution.
Multiple linear regression models were conducted to examine the association between PM2.5 and PM10 exposure and circulating 25(OH)D levels. Ln-transformed 25(OH)D concentrations were treated as dependent variables, whereas daily average concentrations of PM2.5 and PM10 were considered as independent variables. PM2.5 and PM10 were examined in two separate models. Covariates were selected based on biological and statistical considerations. We included gestational age a priori in the models. Additional covariates were selected using a backward stepwise method. Variables were retained as adjustment factors only if their regression coefficients were significant at P < 0.10. Based on this criterion, use of vitamin D supplements during this pregnancy, maternal education and monthly income, maternal age and parity, day of the month, and season of blood sample collection were added to the final model. We estimated the percent change (%) in circulating 25(OH)D concentrations for a 10 μg/m3 increase in PM2.5 or PM10 exposure during the specific trimester and the entire pregnancy.
In a secondary analysis, the associations between particulate air pollution exposure and a dichotomous outcome, maternal vitamin D deficiency, were explored. Multiple logistic regression models were conducted to examine the relation between maternal vitamin D deficiency risk and exposure to particulate air pollution after controlling for the same confounders as those used in the linear regression models. We calculated OR and 95% CI for maternal vitamin D deficiency in association with a 10 μg/m3 increase in PM2.5 or PM10 exposure.
Finally, mediation analysis was performed to explore the potential mechanisms underlying the association between the exposure variables (PM2.5 and PM10) and the outcome [circulating 25(OH)D levels]. We hypothesized that the association between particulate air pollution and circulating 25(OH)D concentrations could be mediated through a decrease in the amount of solar UV-B radiation. For solar UV-B radiation to be considered as a potential mediator, we tested if there was an association between exposure and the mediator and if there was an association between the mediator and the outcome. Then, we fitted linear mediation models to calculate the natural direct and indirect effects (mediated effect) of exposure on the outcome. The proportion of the exposure effects on circulating 25(OH)D levels mediated by a decrease in the amount of solar UV-B was calculated as the percentage of natural indirect effect over the sum of direct and indirect effects.
Results
Characteristics of the participants
A total of 3285 pregnant women who provided blood samples and returned completed questionnaires were enrolled in this study. The population characteristics of the 3285 pregnant women are shown in Table 1. The mean maternal age was 26.64 (SD = 3.95) years at recruitment. The average pre-pregnancy BMI of the participating women was 21.21 (SD = 2.86) kg/m2. Among the 3285 pregnant women, 72.02% (2366) were nulliparous and 27.98% (919) were multiparous. Most participating women (98.80%) had a single pregnancy. Few women reported to have the habit of cigarette smoking (0.20%) or alcohol consumption (0.27%) during the pregnancy.
Selected Characteristic of the Participating Pregnant Women (N = 3285)
| Characteristics | Mean ±SD or n (%) |
|---|---|
| Gestational age, wk | 39.12 ± 1.30 |
| Maternal age, y | 26.64 ± 3.95 |
| Pre-pregnancy BMI, kg/m2 | 21.21 ± 2.86 |
| Parity | |
| Nulliparous | 2366 (72.02%) |
| Multiparous | 919 (27.98%) |
| Fetal plurality | |
| Singleton | 3244 (98.80%) |
| Multiple-gestation pregnancies | 41 (1.20%) |
| Daily vitamin D intake | |
| Yes | 2227 (67.80%) |
| No | 1058 (32.20%) |
| Maternal smoking during this pregnancy | 6 (0.20%) |
| Maternal drinking during this pregnancy | 9 (0.27%) |
| Maternal education | |
| Middle school or below | 700 (21.30%) |
| High school | 1873 (57.00%) |
| College or above | 712 (21.70%) |
| Monthly income | |
| <$750 | 2634 (80.20%) |
| ≥$750 | 651 (19.80%) |
| Season of blood sample collection | |
| Spring | 743 (22.60%) |
| Summer | 1196 (36.40%) |
| Autumn | 942 (28.70%) |
| Winter | 404 (12.30%) |
| 25(OH)D levels | 16.84 ± 6.06 |
Maternal blood samples were collected before delivery and 743 samples were collected in spring, 1196 in summer, 942 in autumn, and 404 in winter. The mean (SD) serum concentration of 25(OH)D was 16.84 (6.06) ng/mL. Based on the Endocrine Society clinical practice guidelines, 2437 (74.19%) participating pregnant women were identified as having maternal vitamin D deficiency.
Outdoor air pollution exposure levels
The distributions of exposure to particulate air pollution during specific trimester and the entire period of pregnancy are reported in Table 2. The mean exposure levels of PM2.5 and PM10 varied by trimester. The median (25th to 75th percentile) cumulative PM2.5 and PM10 exposure during the entire pregnancy was 67.89 (60.34 to 84.30) and 112.51 (107.70 to 131.17) μg/m3, respectively. Cumulative exposure to PM2.5 and PM10 during specific trimester and the entire period of pregnancy were strongly correlated with the Spearman correlation coefficients ranging from 0.91 to 0.94 (data not shown).
Exposure Characteristics of Air Pollutants (μg/m3)
| Timing of Measurement | Mean | SD | Percentile | ||
|---|---|---|---|---|---|
| 25th | 50th | 75th | |||
| PM2.5 | |||||
| First trimester | 83.48 | 1.19 | 72.21 | 76.50 | 99.80 |
| Second trimester | 71.60 | 1.87 | 62.80 | 74.43 | 76.54 |
| Third trimester | 59.33 | 1.42 | 43.48 | 62.62 | 72.84 |
| Whole pregnancy | 71.47 | 1.18 | 60.34 | 67.89 | 84.30 |
| PM10 | |||||
| First trimester | 129.38 | 2.10 | 116.57 | 129.57 | 139.42 |
| Second trimester | 118.56 | 2.19 | 107.43 | 126.11 | 131.96 |
| Third trimester | 107.63 | 2.29 | 83.35 | 114.72 | 129.12 |
| Whole pregnancy | 118.52 | 1.19 | 107.70 | 112.51 | 131.17 |
Particulate air pollution exposure and circulating 25(OH)D levels
The relations between prenatal PM2.5 exposure and maternal circulating 25(OH)D levels are shown in Fig. 1. PM2.5 exposure during the third trimester and the entire pregnancy was inversely associated with 25(OH)D levels. A 10 μg/m3 increase in PM2.5 exposure in the third trimester and during the entire pregnancy was associated with a 5.62% (95% CI, −6.76% to −4.48%) and 4.62% (95% CI, −6.31% to −2.93%) decrease in plasma 25(OH)D levels.
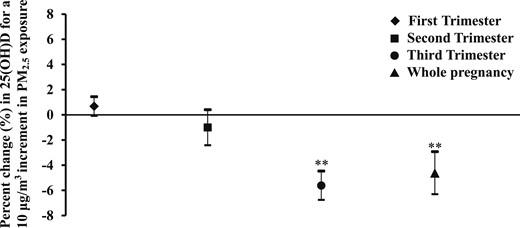
Percent change in maternal circulating 25(OH)D levels in association with PM2.5 exposure. The estimated percent change (95% CI) is calculated for a 10 μg/m3 increment in PM2.5 exposure. The models adjusted for gestational age, daily vitamin D intake, maternal education and monthly income, maternal age and parity, day of month, and season of blood sample collection. **P < 0.01.
Figure 2 presents the effect of PM10 exposure on circulating 25(OH)D levels. PM10 exposure in the second and third trimesters and during the entire period of pregnancy showed a statistically significant negative effect on circulating 25(OH)D concentrations. The estimated reductions in 25(OH)D for a 10 μg/m3 increase of PM10 exposure were 2.13% (95% CI, −3.45% to −0.82%), 3.90% (95% CI, −4.78% to −3.03%) and 5.06% (95% CI, −6.50% to −3.62%), respectively.
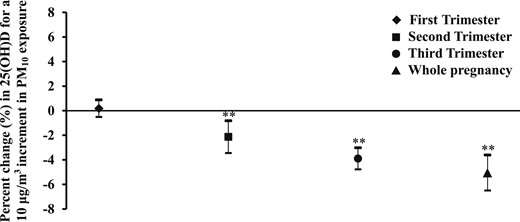
Percent change in maternal circulating 25(OH)D levels in association with PM10 exposure. The estimated percent change (95% CI) is calculated for a 10 μg/m3 increment in PM10 exposure. The models adjusted for gestational age, daily vitamin D intake, maternal education and monthly income, maternal age and parity, day of month, and season of blood sample collection. **P < 0.01.
Prenatal particulate air pollution exposure and the risk of maternal vitamin D deficiency
Crude and adjusted OR for the association between maternal vitamin D deficiency and particulate air pollution exposure are given in Table 3. Overall, there were only slight differences between the crude and adjusted estimates of risk. We observed increased odds of maternal vitamin D deficiency in association with PM2.5 exposure. A 10 μg/m3 increase in PM2.5 exposure in the third trimester and during the entire pregnancy period was associated with a 41% (OR = 1.41, 95% CI, 1.30 to 1.54) and 45% (OR = 1.45, 95% CI, 1.29 to 1.63) increase in the odds of maternal vitamin D deficiency.
Associations Between Particulate Air Pollution Exposure and Risk of Maternal Vitamin D Deficiency
| Crude Model | Adjusted Modela | |||
|---|---|---|---|---|
| Exposure Window | OR (95% CI) | P | OR (95% CI) | P |
| PM2.5 | ||||
| Trimester 1 | 0.99 (0.95, 1.04) | 0.685 | 0.99 (0.94, 1.05) | 0.845 |
| Trimester 2 | 1.02 (0.98, 1.07) | 0.330 | 1.08 (0.98, 1.19) | 0.130 |
| Trimester 3 | 1.37 (1.29, 1.45) | 0.000b | 1.41 (1.30, 1.54) | 0.000b |
| Whole pregnancy | 1.30 (1.21, 1.39) | 0.000b | 1.45 (1.29, 1.63) | 0.000b |
| PM10 | ||||
| Trimester 1 | 1.02 (0.98, 1.07) | 0.334 | 1.03 (0.98, 1.09) | 0.240 |
| Trimester 2 | 1.07 (1.03, 1.11) | 0.001b | 1.14 (1.03, 1.25) | 0.008b |
| Trimester 3 | 1.22 (1.17, 1.26) | 0.000b | 1.25 (1.18, 1.34) | 0.000b |
| Whole pregnancy | 1.36 (1.27, 1.46) | 0.000b | 1.48 (1.33, 1.64) | 0.00b |
Adjusted for gestational age, daily vitamin D intake, maternal education and monthly income, maternal age and parity, day of month, and season of blood sample collection.
P < 0.01.
Increased odds of maternal vitamin D deficiency were also observed to be caused by maternal exposure to PM10. The OR and 95% CI for maternal vitamin D deficiency associated with a 10 μg/m3 increase of PM10 exposure in the second and third trimesters and the entire pregnancy period were 1.14 (95% CI, 1.03 to 1.25), 1.25 (95% CI, 1.18 to 1.34), and 1.48 (95% CI, 1.33 to 1.64), respectively.
Mediation analysis
Because daily net total radiation showed an association with particulate air pollution exposure as well as circulating 25(OH)D levels, we performed mediation analysis to test whether and to what extent the inverse association between particulate air pollution exposure and circulating 25(OH)D levels was mediated by decreased daily net total radiation. Because of the discrepancy in trimester effect of PM2.5 and PM10 on maternal plasma 25(OH)D levels, we considered the exposure averaged over the entire pregnancy. Table 4 presents the mediated effect and the proportion mediated by daily net total radiation over the different particulate matters. All mediation effects were statistically significant at the level of P = 0.05. Estimates of the proportion of mediation demonstrated that the decrease in daily net total radiation mediated 69.5% and 66.4% of the negative association between PM2.5 and PM10 exposure and circulating 25(OH)D concentrations.
Mediation Effect of Daily Net Total Radiation on the Association Between Particulate Air Pollution Exposure and Circulating 25(OH)D Levels
| Exposure Levels | Exposure to Mediator Associationa | Mediator to Outcome Association | Mediated Effect of Radiationb | Proportion Mediated |
|---|---|---|---|---|
| PM2.5 | −0.037 (−0.040, −0.035) | 1.790 (1.350, 2.230) | −0.067 (−0.085, −0.050) | 69.5% |
| PM10 | −0.042 (−0.044, −0.040) | 1.640 (1.140, 2.140) | −0.068 (−0.091, −0.048) | 66.4% |
Estimates correspond to 1 μg/m3 increase in PM2.5 and PM10 concentration.
All mediation effects were statistically significant at the level of P = 0.05.
Discussion
In this longitudinal cohort study of 3285 pregnant women, we found that prenatal exposure to higher levels of PM2.5 and PM10 was associated with decreased maternal circulating 25(OH)D concentrations in late pregnancy. Moreover, we observed increased risk of maternal vitamin D deficiency in association with increasing PM2.5 and PM10 exposure levels. The observed associations were robust even after controlling for maternal age, pre-pregnancy BMI, and vitamin D supplement use, which may also influence circulating 25(OH)D levels (21, 27). Our findings indicate that particulate air pollution might play an independent role in maternal vitamin D deficiency.
We are aware of some previous studies that have investigated the effect of air pollution on vitamin D status in infants (15), young children (16), adolescents (17), and healthy women (18). Our results are consistent with those previous epidemiology studies revealing that people exposed to higher levels of air pollution were at increased risk of developing vitamin D deficiency. However, these studies did not assess air pollution exposure at the individual level, and they defined the living city as a surrogate indicator of air pollution. Moreover, although maternal vitamin D status during pregnancy is of great importance for the health of both the mother and fetus (28–30), none of those previous studies investigated the potential effects of prenatal exposure to air pollution on circulating 25(OH)D levels in pregnant women.
We observed trimester-specific associations between PM2.5 and PM10 exposure and maternal circulating 25(OH)D levels in late pregnancy. The associations were most pronounced for the periods of the third trimester and the entire pregnancy. This finding suggests that third trimester of exposure to particulate air pollution might be a critical period influencing maternal vitamin D status. Our findings were consistent with a previous birth cohort study indicating that prenatal exposure to PM10, especially during the third trimester of pregnancy, was associated with lower cord blood 25(OH)D levels (31). However, because of a lack of toxicologic evidence, we were unable to explain why the impact of air pollution exposure during late pregnancy is of greater importance for maternal vitamin D status.
The mechanism by which air pollution decreases circulating 25(OH)D levels has not been fully elucidated. Studies have shown that particulate matters could absorb and diffuse solar irradiation, reducing the amount of solar UV-B radiation that reaches the Earth’s surface (22). Because sun exposure accounts for >90% of vitamin D production in humans (14), we hypothesized that particulate air pollution decreased circulating 25(OH)D levels mainly through reducing the amount of solar UV-B radiation reaching the ground level. The results of our mediation analysis supported this hypothesis. We found that decreased solar UV-B radiation mediated nearly 70% of the inverse association between prenatal exposure to particulate air pollution and maternal circulating 25(OH)D levels.
This study is one of the first to investigate the association between prenatal particulate air pollution exposure and vitamin D deficiency in pregnant women. Given the adverse health effects of maternal vitamin D deficiency on pregnant women and their fetuses, the increased odds ratio for maternal vitamin D deficiency caused by air pollution exposure may have public health implications. However, there are some limitations in our study. First, our exposure assessment was based on fixed-site monitoring stations and ignored the spatial variation of those four air pollutants, which may have caused exposure misclassification error. Second, we did not collect information about maternal dietary intake of vitamin D before and during pregnancy. However, little food in diet in Yangzhou contains reasonable amounts of vitamin D. Third, we lack data on other environmental pollutants (phthalate and bisphenol A) exposure, which also decrease circulating 25(OH)D levels in pregnant women (32, 33).
Conclusion
Our study provides suggestive evidence that prenatal exposure to air pollution, especially during late pregnancy, may decrease the circulating levels of total 25(OH)D in pregnant women and increase the risk of maternal vitamin D deficiency. Part of these negative associations might be mediated by decreased solar UV-B radiation. Future studies are required to confirm our findings and to determine the public health implications.
Acknowledgments
The authors thank all participating pregnant women in this study.
Financial Support: This work was financially supported by the National Natural Science Foundation of China (grant numbers 81803184, 81602860, 81703233); the Shanghai Sailing Program (grant number 18YF1419600); the Shanghai Municipal Commission of Health and Family Planning (grant number 20184Y0078); the Shanghai Key Laboratory of Meteorology and Health (grant numbers QXJK201703); and the Fundamental Research Funds for the Central Universities (grant number 22120180038).
Disclosure Summary: The authors have nothing to disclose.
Abbreviations:
References
Author notes
Y.Z. and L.W. contributed equally as co-first authors of this work.
J.C. and J.H. contributed equally as co-corresponding authors of this work.
