


Abstract
The phenotype and response to GH treatment of children with an IGF1R defect is insufficiently known.
To develop a clinical score for selecting children with short stature for genetic testing and evaluate the efficacy of treatment.
Case series with an IGF1R defect identified in a university genetic laboratory.
Of all patients with sufficient clinical data, 18 had (likely) pathogenic mutations (group 1) and 7 had 15q deletions including IGF1R (group 2); 19 patients were treated with GH.
Phenotype and response to GH treatment.
In groups 1 and 2, mean (range) birth weight, length, and head circumference (HC) SD scores (SDSs) were −2.1 (−3.7 to −0.4), −2.7 (−5.0 to −1.0), and −1.6 (−3.0 to 0.0), respectively. At presentation, height, HC, and serum IGF-1 SDSs were −3.0 (−5.5 to −1.7), −2.5 (−4.2 to −0.5), and +1.2 (−1.3 to 3.2), respectively. Feeding problems were reported in 15 of 19 patients. A clinical score with 76% sensitivity is proposed. After 3 years of GH treatment [1.1 (0.2) mg/m2/d] height gain in groups 1 (n = 12) and 2 (n = 7) was 0.9 SDS and 1.3 SDS (at a mean IGF-1 of 3.5 SDS), less than reported for small for gestational age (1.8 SDS).
A clinical score encompassing birth weight and/or length, short stature, microcephaly, and IGF-1 is useful for selecting patients for IGF1R analysis. Feeding problems are common and the growth response to GH treatment is moderate.
During the past two decades the important role of IGF-1 in intrauterine growth and postnatal development has become more defined (1). The pleiotropic hormone IGF-1 acts through binding to the IGF-1 receptor (IGF-1R). This receptor, which has a similar structure as the insulin receptor, is a dimeric (heterotetrameric) transmembrane glycoprotein encoded by IGF1R. It consists of an α-subunit, involved in ligand binding, and a β-subunit, accounting for the intrinsic tyrosine kinase activity. IGF1R is located on the distal part of the long arm of chromosome 15 (15q26.3) (2).
Various defects of IGF1R have been suggested as causes of both intrauterine and postnatal growth retardation. Since 1991, several terminal deletions of the distal long arm of chromosome 15, resulting in allelic loss of IGF1R and thus partial IGF-1 resistance, have been described (3). Patients with these heterozygous deletions show prenatal and postnatal growth retardation (4) and a variable degree of other clinical manifestations, such as prenatal increased nuchal translucency (5), cardiac defects (6–12), intellectual disability (3, 6, 7, 11, 13–15), diaphragmatic hernia (6, 9, 16), and hearing problems (15, 17), apparently depending on the location of the breakpoints and the presence of a ring chromosome. A recent study expanded the clinical spectrum of terminal 15q deletions with aortic root dilatation, neonatal lymphedema, and aplasia cutis (18).
In 2003, Abuzzahab et al. (19) identified two children with mutations in IGF1R: a girl who was compound heterozygous for two point mutations and a boy with a heterozygous nonsense mutation. Ever since, 36 different probably pathogenic variants (mutations) have been described in the IGF1R (4, 19–41) as well as a few variants of uncertain significance (VUS) [42–45; online repository (46)]. Most patients are heterozygous carriers of IGF1R mutations; only three compound heterozygous (19, 26, 39) and two homozygous carriers of IGF1R mutations (30, 33) have been reported so far. Such patients seem to show a more severe phenotype than do patients carrying a heterozygous mutation. Furthermore, some rare IGF1R variants may have a moderate effect on stature in an apparently healthy population (47, 48).
Although virtually all patients with a heterozygous IGF1R mutation present with prenatal and postnatal growth retardation, its extent varies remarkably. Klammt et al. (49) found the birth weight (BW) of eight patients with an IGF1R mutation to be in the range of −1.5 to −3.5 SD score (SDS), birth length (BL) varying from −0.3 to −5.0 SDS, and last reported height in the range of −2.1 to −5.0 SDS. Other phenotypic features described in these eight patients include delay in motor and mental development, mildly impaired glucose tolerance, delayed menarche, and mild dysmorphic features (clinodactyly, pectus excavatum, triangular face, brachycephaly, mild hypotelorism, and prominent ears). Similar data were obtained in a review on seven IGF1R mutations, which also included a proposal for a clinical score (27). Overall, the genotype–phenotype relationship of IGF1R defects remains poorly defined, and the variability in phenotype makes it difficult for clinicians to decide which patients should be tested for IGF1R defects. In two previous papers, our group developed clinical scores to help clinicians selecting patients for IGF1R analysis (15, 50). However, the predictive value of these scores has not yet been investigated in an independent patient cohort.
Most patients with an IGF1R defect are born small for gestational age (SGA) and do not show catch-up growth, which qualifies them for recombinant human GH therapy. Because of the small number of patients and insufficient data about their subsequent growth during therapy the effectiveness of GH therapy in these patients remains to be determined. Reported effects vary between no response (24), a moderate response (22, 38), and a good response (51, 52).
In our laboratory, a total of 41 patients have been detected with an IGF1R defect in 11 years. In this report we describe the genotype of all patients, and for patients residing in the Netherlands who gave consent (n = 32), we report the clinical and biochemical phenotype. Additionally, we evaluated the sensitivity of the clinical score we developed previously (50) and created a simplified novel score. Furthermore, we show the effect of GH therapy in these patients and compare this to the reported effect of GH therapy in a large group of Dutch children born SGA without spontaneous catch-up growth (53).
Subjects and Methods
Study design
This is a retrospective study on the clinical, biochemical, and genetic findings collected from a case series of patients with a molecular defect of IGF1R identified in the Laboratory for Diagnostic Genome Analysis of the Leiden University Medical Center tested between 1 January 2005 and 31 December 2015. Samples from patients in whom a defect of the IGF1R was suspected were sent by multiple clinicians. Genetic testing of IGF1R (NM_000875.4) comprised Sanger sequencing, multiplex ligation-dependent probe amplification (MLPA), and/or single nucleotide polymorphism array using standard procedures (50). In total, 335 samples were analyzed.
Patients with a molecular defect who lived in the Netherlands were asked to participate in the clinical part of this study. After approval of the Ethical Committee of the VU University Medical Center (Amsterdam, Netherlands), the referring pediatricians were asked to contact their patients about the study. After written informed consent was obtained, clinical, auxological, and biochemical data were collected from the patients and family members carrying the IGF1R defect.
Participants
In 41 out of 335 patients an IGF1R variant was found (12%). Patients from outside the Netherlands (n = 3) were excluded from the clinical study (46). Two patients could not be approached due to logistic reasons, four patients did not give informed consent for the publication of clinical data, and from three patients we were unable to obtain clinical information. These were all excluded from the clinical study, but their genetic data are presented herein. Affected siblings of the patients were included when relevant data were available and written informed consent was obtained (n = 3). Of the 12 patients who were excluded, 2 patients had a 15q terminal deletion, 7 patients had a (likely) pathogenic mutation (see Table 1), and 3 patients had a (likely) benign variant (46).
Pathogenic and Likely Pathogenic IGF1R Variants Found in This Study
| Sequence Variation: cDNA (NM_000875.4) | Protein | Group | Frequency in the General Population: gnomAD | Prediction of Amino Acid Substitution | Other Databases | Segregation With Phenotype | ACMG/AMP: InterVar, Including Manual Adjustment | |||
|---|---|---|---|---|---|---|---|---|---|---|
| SIFT | Mutation Taster | PolyPhen | ClinVar | CADD Score (phred) | ||||||
| c.58_59delTC | p.Ser20Argfs*124 | 1 (n = 1) | Not present | Not present | P | |||||
| c.236C>T | p.Thr79Met | Excluded | ALL, 0.0018%; EAS, 0.0053%; SAS, 0.0032%; NFE, 0.0024% | Deleterious (score, 0; median, 4.32) | Disease causing (P value, 1) | HumVar probably damaging score, 1.000; sens, 0.00; spec, 1.00 | Not present | 32 | No relatives available | LP |
| c.341A>G | p.Asn114Ser | 1 (n = 1) | Not present | Tolerated (score, 0.21) | Disease causing (P value, 1) | HumVar benign score, 0.066; sens, 0.93; spec, 0.62 | Not present | 25 | Yes | LP |
| c.971G>A | p.Cys324Tyr | 1 (n = 1) | Not present | Deleterious (score, 0) | Disease causing (P value: 1) | HumVar probably damaging score, 1.000; sens, 0.00; spec, 1.00 | Not present | 31 | Yes | LP |
| c.1093C>T | p.Arg365* | 4 | Not present | Not tested | P | |||||
| c.1385T>Ga | p.Met462Arg | Excluded | Not present | Deleterious (score, 0.01) | Disease causing (P value: 1) | HumVar probably damaging score, 0.997; sens, 0.27; spec, 0.98 | Not present | 28.2 | No relatives available | LP |
| c.1660G>A | p.Val554Met | Excluded | ALL, 0.00041%; EAS, 0.0058% | Tolerated (score, 0.09) | Disease causing (P value: 1) | HumVar probably damaging score, 0.728; sens, 0.78; spec, 0.85 | Not present | 28.5 | No relatives available | LP |
| c.1828+1G>Cb | Excluded | Not present | Not tested | P | ||||||
| c.2158A>G | p.Lys720Glu | Excluded | Not present | Tolerated (score, 0.23) | Disease causing (P value: 1) | HumVar possibly damaging score, 0.644; sens, 0.80; spec, 0.84 | Not present | 31 | No relatives available | LP |
| c.2215C>T | p.Arg739Trp | 1 (n = 2) | Not present | Deleterious (score, 0) | Disease causing (P value: 1) | HumVar probably damaging score, 1.000; sens, 0.00; spec, 1.00 | Not present | 35 | Yes (n = 2) | LP |
| c.3148G>A | p.Glu1050Lys | 1 (n = 1) | Not present | Deleterious (score, 0) | Disease causing (P value: 1) | HumVar probably damaging score, 0.955; sens, 0.64; spec, 0.92 | Not present | 34 | Yes (n = 2) | LP |
| c.3190C>T | p.Arg1064* | 1 (n = 2) | Not present | Not tested | P | |||||
| c.3454_3455del insAAAAATA | p.Gly1152Lysfs*7 | Excluded | Not present | Not tested | P | |||||
| c.3530G>A | p.Arg1177His | 1 (n = 3) | Not present | Deleterious (score, 0) | Disease causing (P value: 1) | HumVar probably damaging score, 1.000; sens, 0.00; spec, 1.00 | Not present | 35 | Yes (n = 2) | LP |
| c.3578C>T | p.Ser1193Leu | 1 (n = 1) | Not present | Deleterious (score, 0) | Disease causing (P value: 1) | HumVar probably damaging score, 1.000; sens, 0.00; spec, 1.00 | Not present | 35 | Yes (n = 2) | LP |
| c.3617C>G | p.Ala1206Gly | 1 (n = 1) | Not present | Deleterious (score, 0.04) | Disease causing (P value: 1) | HumVar possibly damaging score, 0.786; sens, 0.76; spec, 0.87 | Not present | 30 | No relatives available | LP |
| c.3631C>T | p.Gln1211* | Excluded | ALL, 0.00041%; NFE, 0.00090% | Not tested | P | |||||
| c.3634C>T | p.Pro1212Ser | 1 (n = 2) | Not present | Deleterious (score, 0) | Disease causing (P value: 1) | HumVar probably damaging score, 1.000; sens, 0.00; spec, 1.00 | Not present | 33 | Yes | LP |
| c.3759dup | p.Lys1254Glnfs* 120 | 1 (n = 1) | Not present | Not tested | P | |||||
| c.3897C>G | p.Asn1299Lys | 1 (n = 1) | ALL, 0.0016%; NFE, 0.0036% | Tolerated (score, 0.11) | Disease causing (P value: 1) | HumVar possibly damaging score, 0.770; sens, 0.76; spec, 0.86 | Not present | 23.9 | No relatives available | LP |
| c.4066G>A | p.Glu1356Lys | 1 (n = 1) | ALL, 0.0051%; AFR, 0.0043%; AMR, 0.012%; EAS, 0.0053%; NFE, 0.0048%; OTH, 0.031% | Tolerated (score, 0.13) | Disease causing (P value: 1) | HumVar probably damaging score, 0664; sens, 0.79; spec, 0.84 | Not present | 25.5 | No relatives available | LP |
Abbreviations: AFR, African; ALL, all populations; AMR, Latino; EAS, East Asian; LP, likely pathogenic; NFE, Non-Finnish European; OTH, other populations; P, pathogenic; sens, sensitivity; spec, specificity.
Combined effect using SpliceSiteFinder-like, MaxEntScan, GeneSplicer, NNSPLICE, Human Splicing Finder predicts creation of new acceptor splice site
Combined effect using SpliceSiteFinder-like, MaxEntScan, GeneSplicer, NNSPLICE, Human Splicing Finder predicts loss of the donor splice site
Clinical assessment
From the remaining 32 patients (29 patients and 3 affected siblings), clinical data were collected from various referring hospitals in the Netherlands and from the Dutch national registry for GH treatment in children (Dutch Growth Research Foundation, Rotterdam, Netherlands). Indicators of prenatal growth included gestational age, BW, BL, and birth head circumference (BHC). When gestational age was stated as “at term” a gestational age of 40 weeks was assumed. When BL and/or BHC were not available, the first known measurement (within the first 3 months of life) was used to calculate BL and/or BHC SDS for age and sex, which was then used as a proxy for BL SDS and/or BHC SDS, with a maximum of 3 months after birth. BW was available in all subjects. Other collected data included serum IGF-1 and IGFBP-3, weight, height, and HC at first presentation, dysmorphic signs, psychomotor development, feeding problems, and skeletal age. From patients treated with GH, information about linear growth and serum IGF-1 was collected every 12 ± 3 months up to 3 years after the start of therapy and, when patients had finished their treatment, at the end of therapy. When patients had not ended their treatment, the total growth response until the last visit was used for analysis. When serum IGF-1 was not measured at completed years after the start of therapy, the available value closest to such date was used. Parental adult height and IGF1R results were also collected.
Genetic analysis
We used the American College of Medical Genetics and Genomics (ACMG)/Association for Molecular Pathology (AMP) criteria (54) to classify the variants. Nonsense, frameshift, and canonical splice site mutations as well as mutations that were already convincingly described in the literature were classified as pathogenic mutations. Noncanonical splice site variants were analyzed using different splice site prediction algorithms (SpliceSiteFinder-like, MaxEntScan, GeneSplicer, NNSPLICE, and Human Splicing Finder) and the outcome was used in the classification. Missense variants that had not been detected previously were classified according to the ACMG/AMP guidelines using the InterVar Web site (http://wintervar.wglab.org). In the unadjusted assessment, for example, without additional supporting evidence, all but one of the missense variants (p.Arg437His) were classified as a VUS. The p.Arg437His variant that was not classified as a VUS complied with the category of likely benign variants. For variants detected in families in which cosegregation was observed in the nuclear family, this was considered compatible with the first supporting criterion (PP1) (“moderate evidence for segregation”). When this information was incorporated in the assessment on the InterVar Web site, these variants were all predicted to be likely pathogenic. When there were no relatives available for analysis, two supporting approaches were used. First, a variant was considered likely pathogenic when all three prediction algorithms (SIFT, Mutation Taster, and PolyPhen-2) predicted pathogenicity in the in silico analysis (PP3). Second, a variant was considered likely pathogenic when two out of three algorithms predicted pathogenicity (PP3) and at least one specific clinical characteristic was present (PP4). All likely pathogenic variants have a CADD score (https://cadd.gs.washington.edu) of >24. Unfortunately, no additional functional tests could be performed.
Patient analysis
Patients were divided into four groups: group 1 (n = 18) consists of patients with a pathogenic or likely pathogenic mutation; group 2 (n = 7) includes patients with a terminal 15q deletion; group 3 (n = 5) consists of patients with a likely benign variant; and group 4 (n = 2) consists of patients with a possible digenic disorder (IGF1R variant plus another molecular defect), that is, a pathogenic mutation in FGFR3 and an inversion on chromosome 7 [46,XX,inv(7)(q11.23q22.3)mat], respectively. No patients were found with compound heterozygous or homozygous mutations in IGF1R. For groups 1 and 2, clinical data were analyzed and compared (Table 2). For all groups, clinical characteristics are presented in an online repository (46).
Clinical Characteristics of Patients From Groups 1 and 2
| n | All Patients (Groups 1 and 2): Mean (SD) | Range | n | Mutations: Mean (SD) | Range | n | Deletions: Mean (SD) | Range | Pa | |
|---|---|---|---|---|---|---|---|---|---|---|
| Male/female | 25 | 11/14 | 18 | 9/9 | 7 | 2/5 | 0.353 | |||
| Age at analysis, | 25 | 14.80 (6.50) | 4.70 to 31.11 | 18 | 14.56 (6.63) | 4.70 to 31.11 | 7 | 15.41 (6.63) | 8.25 to 27.59 | 0.778 |
| Birth | ||||||||||
| Gestational age, wk | 22 | 39.47 (2.64) | 30.00 to 42.29 | 15 | 39.36 (2.93) | 30.00 to 42.29 | 7 | 39.69 (2.03) | 35.71 to 41.71 | 0.791 |
| Weight SDS | 23 | −2.11 (0.91) | −3.68 to −0.41 | 16 | −2.10 (0.95) | −3.68 to −0.41 | 7 | −2.15 (0.89) | −3.30 to −1.12 | 0.905 |
| Length SDS | 19 | −2.66 (1.16) | −4.98 to −1.02 | 12 | −2.50 (1.16) | −4.98 to −1.02 | 7 | −2.93 (1.20) | −4.52 to −1.26 | 0.447 |
| HC SDS | 16 | −1.64 (0.92) | −3.03 to 0.02 | 10 | −1.60 (0.96) | −2.87 to 0.02 | 6 | −1.72 (0.93) | −3.03 to −0.53 | 0.814 |
| First presentation | ||||||||||
| Age, y | 25 | 4.00 (4.53) | 0.07 to 15.29 | 18 | 5.00 (4.88) | 0.33 to 15.29 | 7 | 1.45 (2.02) | 0.07 to 4.45 | 0.078 |
| Height SDS | 25 | −3.00 (0.79) | −5.51 to −1.69 | 18 | −2.88 (0.63) | −4.01 to −1.69 | 7 | −3.33 (1.09) | −5.51 to −2.14 | 0.203 |
| Weight SDS | 24 | −2.94 (1.40) | −5.38 to −0.05 | 17 | −3.05 (1.45) | −5.31 to −0.05 | 7 | −2.66 (1.35) | −5.38 to 1.63 | 0.545 |
| BMI SDS | 24 | −1.07 (1.46) | −4.00 to 1.52 | 17 | −1.54 (1.41) | −4.00 to 1.52 | 7 | 0.07 (0.88) | −1.52 to 1.17 | 0.011 |
| HC SDS | 19 | −2.50 (1.20) | −4.24 to −0.46 | 13 | −2.62 (1.17) | −4.24 to −0.46 | 6 | −2.24 (1.33) | −4.14 to −0.78 | 0.542 |
| Bone age | ||||||||||
| BA delay: CA-BA, y | 22 | 0.9 (1.2) | −1.3 to 3.3 | 15 | 1.13 (1.23) | −0.6 to 3.3 | 7 | 0.29 (0.91) | −1.3 to 1.8 | 0.120 |
| Endocrine data | ||||||||||
| IGF-1 SDS | 24 | 1.21 (1.12) | −1.34 to 3.21 | 17 | 1.21 (1.09) | −1.34 to 3.21 | 7 | 1.22 (1.28) | −1.27 to 2.47 | 0.982 |
| IGFBP-3 SDS | 18 | 0.55 (2.36) | −3.64 to 5.77 | 13 | 0.58 (2.19) | −3.39 to 5.77 | 5 | 0.49 (3.03) | −3.64 to 4.72 | 0.947 |
| Phenotypic features | ||||||||||
| Delayed mental development | 20 | 12 | — | 13 | 5 | — | 7 | 7 | — | 0.001 |
| Delayed motor development | 17 | 5 | — | 11 | 2 | — | 6 | 3 | — | 0.191 |
| Feeding problems | 19 | 15 | — | 12 | 9 | — | 7 | 6 | — | 0.605 |
| Dysmorphic signs (none/present) | 25 | 11/14 | — | 18 | 10/8 | — | 7 | 1/6 | — | 0.043 |
| Other problemsb | ||||||||||
| CVS | 25 | 5 | — | 18 | 3 | — | 7 | 2 | — | 0.524 |
| Respiratory system | 25 | 1 | — | 18 | 1 | — | 7 | 0 | — | 0.544 |
| SNS | 25 | 7 | — | 18 | 2 | — | 7 | 5 | — | 0.001 |
| Skin | 25 | 8 | — | 18 | 3 | — | 7 | 5 | — | 0.007 |
| Delayed tooth development | 25 | 5 | — | 18 | 1 | — | 7 | 4 | — | 0.044 |
| Parents | ||||||||||
| Inheritance paternal/maternal/de novo | 19 | 2/10/7 | — | 12 | 2/10/0 | — | 7 | 0/0/7 | — | — |
| Height nonaffected parent (SDS) | — | — | — | 12 | −1.03 (1.26) | −2.37 to −0.12 | — | — | — | — |
| Height affected parent (SDS) | — | — | — | 12 | −2.48 (0.94) | −3.15 to −0.60 | — | — | — | — |
Boldface indicates statistically significant data (P < 0.05).
Abbreviations: BA, bone age; CA-BA, calendar age minus bone age; CVS, cardiovascular system; SNS, sensory nerve system.
P value from t test comparing patients from group 1 and 2.
Other problems include: pulmonary stenosis (n = 1), patent foramen ovale (n = 1), systolic murmur (n = 3), ventricular septal defect (n = 1), asthma (n = 1), bronchopulmonary dysplasia (n = 1), chronic ear/nose/throat infections (n = 1), external auditory canal atresia (n = 1), hearing problems (n = 2), visual problems (n = 3), acne vulgaris (n = 1), café au lait spots (n = 4), congenital melanocytic nevus (n = 1), dry skin (n = 2), eczema (n = 2), pigmented spots (n = 1), sebaceous cyst (n = 1), white matter abnormalities (n = 1), delayed tooth development (n = 5), hypothyroidism (n = 1), retractile testis (n = 1), and hypospadias (n = 1).
The patients were analyzed using a clinical score previously published by Caliebe et al. (50).
To create a simplified clinical score, the Silver–Russell syndrome clinical score was used as inspiration (55).
Subgroups of each group were treated with GH (12 in group 1, 7 in group 2, 1 in group 3, and 1 in group 4). In the Netherlands, GH is dosed per square meter of body surface area, and for patients born SGA without catch-up the advised dose is 1 mg/m2/d, which is equivalent to ∼33 μg/kg/d (0.230 mg/kg/wk). We only analyzed the growth response to GH treatment of patients in groups 1 and 2, using height SDS and the gain in height SDS (ΔHSDS) during the first 3 years of therapy in longitudinal cohorts as outcome measures. Growth data were interpolated to obtain data with intervals of 12 months. We also collected serum IGF-1 during therapy and calculated mean IGF-1 SDS during treatment. Data on serum IGFBP-3 before GH treatment were collected as well.
Statistical analysis
BW, BL, and BHC were expressed as SDS for gestational age values based on the Swedish references of Niklasson et al. (56). Height SDS was calculated based on the most recent Dutch nationwide reference (57). Weight SDS for age was based on the standards by Roede and van Wieringen (58) and BMI SDS on those by Cole and Roede (59), both based on the 1980 nationwide growth study (before the obesity “epidemic”). HC SDS was calculated using the nationwide growth study of 1997 (60). Bone age was analyzed as reported by the treating physicians using the Greulich and Pyle method (61). IGF-1 and IGFBP-3 data were measured by local laboratories and transformed to SDS values according to the reference data reported by Bidlingmaier et al. (62) or modified data from Rikken et al. (63). Data are expressed as mean ± SD and compared between groups using the Student t test for continuous variables and a χ2 test for categorical variables. Differences between specific moments in time were calculated using paired Student t tests. P < 0.05 was considered statistically significant.
In the process of developing a clinical score we used a pseudo case-control design, with the patients in groups 1 and 2 as cases and an independent data set of children with short stature from Tuebingen, Germany (courtesy of Prof. M. B. Ranke) as controls (64). We first calculated the sensitivity, specificity, and positive likelihood ratio at various cutoff points for four individual parameters (BW and/or BL, height SDS, HC SDS, and IGF-1 SDS). We then tested the score in a cohort of 372 patients born SGA who had participated in several clinical trials with GH (65–68). In this cohort eight patients carried a defect of IGF1R.
Results
Molecular defects
During a period of 11 years we detected 41 patients with an IGF1R variant out of 335 samples (12%). These samples were presumably sent by clinicians who suspected an IGF1R defect in their patients. When the estimated percentage of likely benign variants (extrapolated from the patients with clinical information, 22%) was subtracted, the diagnostic yield of (likely) pathogenic mutations was 9%.
A total of 28 different variants were detected by Sanger sequencing, of which 26 were not described previously, and one variant (p.Glu1050Lys) was already described by our group (21). To our knowledge, none of the other patients nor their mutations have been described in the literature or the international database GrowthGenetics.com so far (69). All identified variants and mutations in this cohort, in addition to all molecular IGF1R defects described in the literature so far, are shown in Fig. 1 and an online repository (46). Information about potential pathogenicity based on in silico analysis for the 21 (likely) pathogenic variants is shown in Table 1. These included 14 missense, 3 nonsense, 3 frameshift, and 1 splice mutation. In group 1 (n = 18), 13 different (likely) pathogenic mutations were found (Table 1). Seven variants, six missense and one intronic variant, were classified as likely benign (46). Additionally, seven patients were detected with a terminal 15q26 deletion by either MLPA and/or single nucleotide polymorphism array analysis (46). In the 12 patients who were excluded from the study, 7 (likely) pathogenic mutations, 3 (likely) benign deletions, and 2 terminal deletions were found [Table 1; online repository (46)].
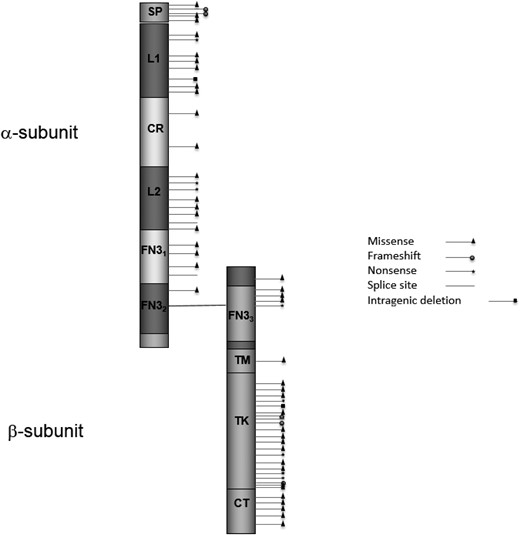
Schematic of the IGF1R protein with all published variants and the mutations described in this study. The variants and references are described in an online repository (46). Domains (amino acid positions) are according to UniProt (www.uniprot.org/uniprot/P08069): SP, signal peptide (1–30); L1, receptor L domain (51–161); CR, furin-like cystein-rich region (175–330); L2, receptor L domain (352–466); FN31, fibronectin type 3 domain (491–609); FN32, fibronectin type 3 domain (610–708); FN33, fibronectin type 3 domain (735–828); TM, transmembrane region (936–959); TK, catalytic domain of insulin receptor–like protein tyrosine kinases (999–1274); CT, C-tail (1275–1367).
There were more mutations inherited maternally than paternally (10 vs 2), and for six patients in group 1 the parental origin of the mutation was unknown. Growth parameters did not significantly differ between children carrying paternal or maternal mutations: mean BW SDS −2.29 vs −2.11, BL SDS −2.47 vs −2.59, BHC SDS −0.89 vs −1.94, height SDS −3.46 vs −2.89, HC SDS −3.66 vs −2.96 (all P values >0.18).
In all seven patients from group 2 the terminal deletion was de novo. None of these deletions encompassed the ACAN gene, located on 15q26.1, which is recently described as a growth-regulating gene with possibly a high frequency of mutations in patients with short stature (70, 71). One of the patients with a terminal deletion also had an additional nonpathogenic IGF1R variant in the other allele (p.Arg511Gln). This variant was originally considered pathogenic (43) but was later shown to be a benign variant (47). This is confirmed by the findings of the current study, because the patient’s father carrying this variant has a height of 197 cm (1.9 SDS).
In the five patients from group 3, three different variants were found (46). In the two patients from group 4, one mutation and one variant of uncertain VUS in IGF1R were found in combination with another genetic variant (46).
Phenotypic features
Table 2 shows the clinical characteristics of all patients with an IGF1R mutation or IGF1R terminal deletion (groups 1 and 2). Individual patient information can be found in an online repository (46). All patients presented with a height SDS below −1.7; mean height SDS was −3.0 (range, −5.5 to −1.7). Mean BW SDS was −2.1, and mean BL SDS was −2.7. Mean HC SDS was significantly lower at presentation than at birth (−2.5 vs −1.6, P = 0.022). Although the mean height SDS at presentation also tended to be lower than mean BL SDS (−3.0 vs −2.7), the difference did not reach statistical significance (P = 0.082). At presentation, the mean difference between HC SDS and height SDS was 0.50. Mean bone age delay was 0.9 years. Mean serum IGF-1 before GH therapy was significantly >0 SDS (mean 1.1, P < 0.001) and was above +2 SDS in six patients. Mean serum IGFBP-3 SDS before GH therapy was 0.55 (not significantly elevated).
In five out of 13 patients of group 1 the clinician reported some degree of delayed mental development, and 2 out of 11 patients were reported with some degree of delayed motor development. In group 2 all seven patients showed some degree of delayed mental development and three showed some degree of delayed motor development. The difference between groups 1 and 2 for these features was only significant for delay in mental development (P = 0.001). In group 1, eight patients endured feeding problems during the first years of life. In group 2 six patients had feeding problems (no significant difference between groups, P = 0.605). “Vomiting” and “food refusal” during infancy were the most common problems reported. Out of all patients in groups 1 and 2 (n = 25), 11 patients did not have any dysmorphic features, 14 had dysmorphic features, and none had severe dysmorphic features. Patients from group 2 had significantly more dysmorphic features than did patients in group 1 (P = 0.043). Most commonly described signs were posteriorly rotated and/or low-set ears, small hands and/or fingers, hypermobility, and a broad and/or depressed nasal bridge.
Other clinical features in both groups included cardiovascular symptoms (n = 4), respiratory problems (n = 2), sensory problems (n = 7), skin problems (n = 8), and delayed tooth development (n = 5). Most common within the four groups were café au lait spots (n = 4), systolic murmurs (n = 3), and visual problems (n = 3). Patients from group 2 had significantly more sensory and skin problems (P = 0.015 for both) and significantly more delayed tooth development (P = 0.043) compared with patients from group 1 (Table 2).
Clinical score
The online repository (46) shows how our patients scored on the previously proposed clinical score (50). The sensitivity of this score in our cohort was 76%.
Based on the clinical data from our patients, we developed a scoring system, based on three clinical features (BW and/or BL SDS, height SDS, and HC SDS at presentation) and biochemical item (IGF-1 SDS). A positive score on three or more of the criteria exceeds the threshold for IGF1R analysis.
We performed a pseudo case-control analysis, with the patients in the combined groups 1 and 2 as cases and a data set of children with short stature from the Tuebingen cohort as controls (64). We first calculated the sensitivity, specificity, and positive likelihood ratio at various cutoff points of the individual parameters and chose cutoffs with the highest positive likelihood ratio. The results are shown in Table 3.
IGF1R Clinical Score
| Criterion | This Study | Cohort of Patients With Short Stature (64) | Sensitivity | Specificity | Positive Likelihood Ratio |
|---|---|---|---|---|---|
| BW and/or BL SDS below −1 | 20/22 | 137/247 | 92% | 56% | 1.64 |
| Height SDS at presentation below −2.5 | 19/24 | 111/247 | 79% | 55% | 1.4 |
| HC SDS at presentation below −2 | 12/19 | 35/191 | 63% | 82% | 3.5 |
| IGF-1 SDS >0 | 21/24 | 59/218 | 88% | 73% | 3.2 |
| Score ≥3 | 19/25 | 26/196 | 76% | 87% | 5.8 |
The sensitivity in our cohort for the newly proposed score was 76%, which was comparable to the sensitivity of the previously proposed, more complicated, score (50). The specificity in the Tuebingen cohort was 87%. We then tested the performance of the score in a separate large cohort (n = 372) of patients born SGA who had participated in several clinical trials with GH (65–68). Using the newly developed score, six out eight patients with IGF1R mutations in the latter cohort would have been selected (sensitivity 75%) at a specificity of 69%.
For an estimate of the number needed to test, it is necessary to have information on the pretest probability of an IGF1R defect in children with short stature presenting at the pediatric endocrine clinic. For this purpose, we used the two control populations of children with short stature used to calculate the specificity, as well as a third cohort. In a previous study from our laboratory on the 199 children with short stature (47 SGA and 152 idiopathic short stature) from Tuebingen, 2 cases were detected (1%) (50). In the cohort of 372 SGA-born patients, 8 patients with an IGF1R defect were identified (2.1%) (65–68). The third cohort consisted of 404 children with short stature who were tested with a growth-specific next-generation sequencing–based gene panel analysis containing 15 genes, including IGF1R (sequencing and MLPA), during the years 2014 to 2017 in our laboratory. From these analyses, three cases with a (likely) pathogenic variant were encountered (0.75%). The observations in these three cohorts suggest that the pretest probability of a (likely) pathogenic IGF1R variant in children with short stature (irrespective of birth size) is close to 1%, and in children with short stature born SGA is ∼2%.
Assuming a pretest probability of 1% in short stature presenting at the clinic, we calculated that using this score would result in analyzing eight patients with short stature to identify one case with a (likely) pathogenic IGF1R mutation. Assuming a pretest probability of 2% in SGA-born patients, using the score will result in testing 20 patients to identify 1 IGF1R defect.
Growth response to GH therapy
From the 26 patients in groups 1 and 2, 19 were treated with biosynthetic GH (12 from group 1 and 7 from group 2) with a mean (SD) starting dose of 1.1 (0.2) mg/m2/d. The online repository (46) shows data at baseline and the growth response for these patients. Individual patient information can be found in the online repository (46). Differences in height SDS (−2.6 for mutations vs −3.3 for terminal deletions, P = 0.028) and ΔHSDS in the preceding year (0.3 for mutations vs −0.1 for terminal deletions, P = 0.030) were significantly different between the two groups at the start of GH treatment. The increase in mean height SDS and IGF-1 SDS during 3 years in groups 1 and 2 is shown in Fig. 2. ΔHSDS after 1, 2, and 3 years is shown in the online repository (46). For comparative purposes, we show the growth response and IGF-1 SDS of 41 children born SGA treated with 1 mg/m2/d as part of the Dutch dose-response clinical trial in Fig. 2 (53). Patients from group 1 gained an average of 0.50, 0.65, and 0.91 SDS in height during the 3 first years of therapy, respectively. For patients from group 2 this was 0.75, 1.10, and 1.30 SDS, respectively. There were no significant differences in GH response between groups 1 and 2 during the first 3 years of therapy (P = 0.175). After 3 years of treatment these increments were highly statistically significant (P < 0.001 and P = 0.004, respectively). In children born SGA as part of the Dutch dose-response clinical trial (53), height gain was 0.90, 1.45, and 1.82 SDS, respectively. SGA-born children had a significantly better response after 2 and 3 years of GH treatment than did the patients in group 1 (P = 0.003 and P < 0.001, respectively) and group 2 (P = 0.045 and P = 0.003, respectively).
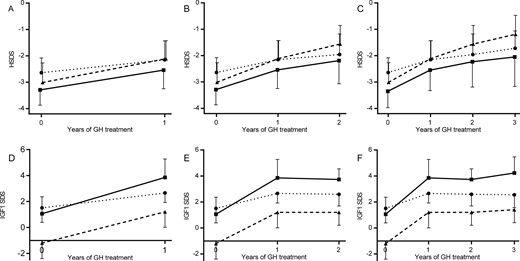
(A–C) Mean height SDS (±SD) in patients from groups 1 and 2 in three cohorts (treated with GH for 1 to 3 y). Group 1 is represented by dotted lines with circles, group 2 by lines with squares, and dashed lines with triangles represent data as reported by Sas et al. (50). (A) One year of GH treatment: group 1 (n = 12) and group 2 (n = 7). (B) Two years of GH treatment: group 1 (n = 7) and group 2 (n = 7). (C) Three years of GH treatment: group 1 (n = 7) and group 2 (n = 6). (D–F) Mean serum IGF-1 SDS during GH treatment in patients from group 1 and 2 in three cohorts (treated with GH for 1 to 3 y). Group 1 is represented by dotted lines with circles, group 2 by lines with squares, and dashed lines with triangles represent data as reported by Sas et al. (53). (D) One year of GH treatment: group 1 (n = 11) and group 2 (n = 6). (E) Two years of GH treatment: group 1 (n = 6) and group 2 (n = 6). (F) Three years of GH treatment: group 1 (n = 5) and group 2 (n = 5). HSDS, height SDS.
In the six patients for whom data on adult height were available, mean adult height SDS was −2.0 with a wide range (−3.5 to −0.6), in comparison with an initial height SDS of −3.4 SDS (range, −5.5 to −1.2). Mean adult height gain was 1.0 SDS (P = 0.018) after a variable duration of treatment ranging from 1.25 to 9.58 years. The patient treated during 9.58 years reached the highest ΔHSDS (1.91). Mean (SD) attained adult height SDS minus predicted adult height SDS was 0.63 (±0.27). Mean adult height gain in our cohort is not far below the one reported for SGA-born children (1.25 SDS) (72).
Effect of GH therapy on serum IGF-1
Serum IGF-1 values at baseline, after 1, 2, and 3 years, and the highest values measured during therapy are shown in the online repository (46). Mean serum IGF-1 SDS at baseline did not differ between the two groups (P = 0.446) and significantly increased after 1, 2, and 3 years in both groups (P < 0.046). The increase in mean serum IGF-1 SDS during 3 years for both groups and the SGA cohort is shown in Fig. 2 (53). After 1, 2, and 3 years of therapy, mean serum IGF-1 SDS was significantly higher in group 2 than in group 1 (P = 0.037, P = 0.045, and P = 0.046, respectively). IGF-1 levels increased to an average of 2.83 SDS in IGF1R mutations and 4.48 SDS in IGF1R deletions, both with a wide range up to a maximum of 3.80 and 6.02 SDS, respectively. Mean change in IGF-1 SDS was 2.24 (1.5 in group 1 and 3.4 in group 2) (46). In the SGA group, mean (SD) IGF-1 levels at baseline were −1.2 (±1.2) and 1.2 (±1.2), 1.2 (±1.0), and 1.4 (±1.0) SDS after 1, 2, and 3 years of GH treatment, respectively, and baseline IGFBP-3 SDS was −1.7 (53).
Clinical observations in groups 3 and 4 are presented in the online repository (46).
Discussion
In this study, we report genetic, clinical, and biochemical data from 18 patients carrying 13 different (likely) pathogenic IGF1R mutations and 7 patients with a 15q terminal deletion including the IGF1R gene, 5 children with a (likely) benign variant, and 2 children with short stature of possibly digenic origin. Additionally, we present seven (likely) pathogenic mutations and two VUSs in patients from whom no clinical data were available. In total, we describe 20 novel mutations, thereby extending the number reported (n = 35) so far.
Patients in groups 1 and 2 presented with a BW, BL, and/or BHC below the mean for age and sex and failed to catch up in linear growth. A large majority reported feeding problems in infancy. Other clinical features included delay in mental and motor development and dysmorphic features, which appeared more prevalent in patients carrying IGF1R terminal deletions than in those with IGF1R mutations. Because of limited numbers it was not possible to evaluate the difference in phenotype of patients with heterozygous loss-of-function mutations and patients with missense variants. Our data support the assumption that missense variants lead to a form of haploinsufficiency instead of a dominant-negative effect. The mean height SDS of patients carrying mutations is ∼0.5 SD less short than the mean height SDS of patients with deletions, and the distribution of height SDS is quite narrow (SD of 0.63), without outliers.
Retrospective calculation of the previously published IGF1R analysis score (50) showed that 19 out of 25 patients exceeded the threshold score (sensitivity 76%). We created a new and simplified score that will make it easier for clinicians to select children for IGF1R analysis. In our cohort, 75% sensitivity was reached with a positive score on three or more items according to the following criteria: BW and/or BL SDS below −1; height SDS at presentation below −2.5; HC SDS at presentation below −2; and IGF-1 SDS >0 (Table 3). Specificity was 87% and 69% in two cohorts of children with short stature (one with a mixed population of idiopathic short stature and SGA and the other of SGA-born children, respectively). Assuming a prevalence of 2% in a population of SGA-born children and 1% in children with short stature irrespective of birth size, the use of this score would result in a positive diagnostic yield of 1 out of 20 and 1 out of 8 children, respectively. We think that establishment of the diagnosis of partial IGF-1 resistance is important for the patient and parents, as well for the treating physician. First, it offers an explanation of clinical features, such as short stature and feeding problems, that would otherwise lead to extensive and prolonged further investigations. Second, it has important consequences for decisions on GH treatment: the expected efficacy is lower than for the average SGA-born short child, the potential risks may be different, and a higher serum IGF-1 is expected on a regular GH dosage. Third, there may be implications for other family members carrying the IGF1R mutation.
We considered adding two other criteria: “serum IGF-1 SDS >1 during GH therapy” and “one of the parents’ height SDS below −1.5.” However, because the objective is to diagnose children before GH therapy, we did not include the first criterion, and because all terminal deletions are de novo and height of parents is not always available, we also did not include the second criterion. Nevertheless, both phenomena can still strengthen the suspicion of an IGF1R defect.
Although the number of patients treated with GH in our study is small (n = 19), it is considerably larger than the number of patients in any other report so far.
The average height gain during 3 years in groups 1 and 2 was 0.9 and 1.3 SDS, respectively, in comparison with 1.8 SDS in SGA-born children with short stature, suggesting that children with IGF1R defects respond less than do patients born SGA. We speculate that this difference is caused by the lower number of functional IGF receptors. However, mean adult height gain (though only available for six children) seems comparable to that of SGA-born children (1.0 vs 1.25 SDS, P = 0.76), with a trend of better response in patients who were treated longer.
In these six children the mean adult height SDS was 0.7 above the predicted adult height SDS based on height and bone age before the start of therapy. Our results suggest that adult height in children heterozygous for an IGF1R defect may be positively influenced by long-term GH treatment on a dosage of ∼1 mg/m2/d. Unfortunately, no untreated control group was available, but data on the natural history of SGA-born children with short stature suggest that adult height SDS is similar to height SDS in childhood (73). Because of the variable age at the start of GH treatment, variable duration of GH treatment, and the use of GHRH analogs in three out of six patients, further studies are needed to draw reliable conclusions on the long-term efficacy of GH treatment in children with an IGF1R defect.
Our results indicate that growth velocity and possibly also adult height in children carrying a heterozygous IGF1R defect is positively influenced by long-term GH treatment on a dosage of ∼1 mg/m2/d.
In our study, all seven patients with a 15q26 deletion including IGF1R were treated with GH. The median increase in height SDS after a mean duration of GH treatment of 5.4 years was 1.9. Two of these patients reached adult heights of −1.6 and −3.0 SDS, with a total height increase of 1.9 and 1.4 SDS, respectively. Our results are comparable to those of the publication of Ho et al. (52), who described the response to GH therapy in seven patients with a 15q26 deletion including the IGF1R gene. Mean duration of GH treatment was 5.8 years and median height SDS increased by 0.6, 1.3, and 1.4 SDS after 1, 5, and 10 years. Four patients reached adult height with a median height SDS increase of 1.1 (range, 0 to 3.3) (52).
In line with earlier reports, patients in our study showed a large increase in serum IGF-1 levels during GH treatment, reflecting the state of IGF-1 resistance. Also, mean basal IGFBP-3 levels in our cohort were significantly higher than those in the SGA population (53) (0.55 SDS vs −1.7 SDS), in line with the assumed elevated GH secretion in IGF-1 resistance. Patients with a terminal deletion showed significantly higher IGF-1 concentrations than did patients carrying a mutation, which suggests that the former are more IGF-1 resistant than the latter. None of our patients showed any clinically relevant adverse event during GH treatment. Given the partial insensitivity to IGF-1 in these patients, we have reasoned that elevated IGF-1 levels can be accepted during GH treatment to pursue a clinically relevant increase in height SDS. In comparison with the SGA patients treated with a similar GH dose (1 mg/m2/d) (53), our patients showed higher IGF-1 levels at baseline (mean IGF-1 SDS at baseline in the SGA cohort was −1.2 vs 1.3 in our cohort). During therapy the mean increase in IGF-1 SDS of the SGA cohort during 1, 2, and 3 years was 2.4, 2.4, and 2.6, respectively, similar to the increase in our cohort (1.7, 1.9, and 2.1, respectively). In our cohort no side effects of GH treatment were reported. Because no data are available on the long-term consequences of GH treatment in patients carrying IGF1R defects, adequate follow-up after discontinuation of GH treatment is important.
This is by far the largest group of patients with an IGF1R mutation that has been reported so far. Compared with the review paper published by Klammt et al. (49) on eight patients with IGF1R mutations, our findings show a slightly more variable phenotype in terms of BW and height SDS at presentation. With respect to the first year response to GH therapy, our patients performed better than the results presented by Klammt et al., and we show that also in the second and third year catch-up growth did continue.
Clinically, there are overlapping features in patients with Silver–Russell syndrome and patients with a molecular defect of IGF1R. Both conditions are associated with SGA, postnatal growth failure, feeding problems, and relatively high serum IGF-1 levels at baseline and in response to GH treatment (55). However, an important distinctive feature is HC. Patients with Silver–Russell syndrome have a relative macrocephaly at birth, defined as HC at birth ≥1.5 SDS above BW and/or BL SDS (55). In our cohort, mean HC at birth was 0.5 SD above BW SDS and 1 SDS above BL SDS. At presentation HC SDS was 0.5 SDS above height SDS.
Although our results do not show major statistically significant differences in phenotype between patients with a mutation and patients with a 15q terminal deletion, patients with a terminal deletion tended to be more severely affected. Gannagé-Yared et al. (30) suggested that in heterozygous carriers of IGF1R mutations the receptors expressed from the wild-type allele may partly compensate for the mutated allele. The variation within the group of patients with a terminal deletion might be explained by the interference of other deleted genes. Poot et al. (11) described IGF1R flanking genes that might cause some of the variability in the clinical manifestation of 15q deletions.
A significant number of the patients in this study showed feeding problems during the first years of their lives, such as vomiting and food refusal. Several patients needed nasogastric tube feeding to reach sufficient nutritional intake. Feeding problems have been described in a few cases before (15, 21), but most studies have not discussed this phenomenon. Because of the large number of patients with such problems in our study, we think that feeding problems are a relevant clinical feature associated with IGF1R defects. A possible pathophysiological explanation is offered by observations in the rat, where IGF-1 receptors were shown to be localized in the hypothalamic arcuate nucleus (74), which has a role in integrating signals regulating appetite (75). It is therefore important that clinicians inquire about this issue when taking a medical history from a child with short stature.
In our cohort, significantly more mutations were inherited maternally than paternally (10 vs 2; 6 unknown). In the literature we found an identical proportion (11 out of 18 heterozygous pathogenic mutations were maternally inherited, 3 paternally, and 4 de novo or unknown). To our knowledge, this phenomenon has not been described before. Based on the first family with an IGF1R mutation we detected, we suggested that patients who inherited the mutation maternally may be more severely affected than are patients who inherited the mutation paternally (21), but this was not confirmed in the present cohort. An alternative explanation is that the imbalance is associated with a report that IGF1R contains a maternally methylated differentially methylated region located within intron 2 (76), although the authors stated that “there is currently no evidence that IGF1R itself shows imprinted expression or any evidence for Parent-of-Offspring effects associated with IGF1R mutations.” It remains to be established whether this unequal parental origin may be related to the imprinted expression of a long noncoding RNA, IRAIN, antisense within IGF1R. IRAIN long noncoding RNA is expressed exclusively from the paternal allele, with the maternal counterpart being silenced (77). A third alternative explanation is that fertility in male carriers may be disturbed, which is supported by observations that IGF-1 mediates the FSH-induced effects on testicular development, Sertoli cell proliferation, and germ cell differentiation (78).
Our study has several limitations. First, the patients in our cohort who were selected for molecular analysis by the referring pediatric endocrinologists were investigated in multiple sites, which may have led to variable ascertainment of specific clinical features. Second, most patients had features that were consistent with IGF-1 resistance, which made it difficult to develop a score that was applicable to other children with short stature. To develop a general useful score, we assessed the sensitivity and specificity of the clinical score by analyzing two separate cohorts of children with short stature. A prospective study is needed to evaluate the value of the proposed clinical score. Third, although the short-term efficacy of GH treatment could be shown with reasonable certainty, this does not apply to the effect on adult height. This is not only caused by the absence of an untreated control group and by the low number of patients for which data are available, but also by the large variability of age at start, duration of treatment, and treatment regimens. In fact, the decision to treat a patient with GH was taken by the pediatric endocrinologist, based on the indication of SGA without catch-up growth, so that treatment initiation and persistence could be biased. We think that conclusions about the long-term efficacy of GH treatment should be postponed until long-term follow-up data in more children carrying IGF1R mutations are available.
In conclusion, our study provides evidence that most patients with an IGF1R defect are SGA, short, and microcephalic and usually have a serum IGF-1 in the upper half of the reference range, all with a considerable variability. We provide a novel clinical score that can assist the physician to select patients for genetic testing of IGF1R. In the first years of GH treatment, linear growth increases less than documented for patients with SGA on a similar dosage, despite considerably higher serum IGF-1 concentrations. However, our preliminary data suggest that adult height gain may be similar. Patients with an IGF1R deletion present with a higher serum IGF-1 than do patients with an IGF1R mutation, but their growth response to GH is slightly better than observed in patients with a mutation.
Acknowledgments
We thank all patients and their families who participated in this study. We also thank the physicians who helped us to collect written informed consent from the patients and helped us to collect patient information, including (in alphabetical order) B. Bakker (Reinier de Graaf Hospital, Delft), C. de Bruin (Leiden University Medical Center), J. Jansen (Meander Medical Center, Amersfoort), H. J. van der Kamp (University Medical Center, Utrecht), E. G. A. H. van Mil (Jeroen Bosch Hospital, den Bosch), T. C. J. Sas (Albert Schweizer Hospital, Dordrecht), V. van Tellingen (Catharina Hospital, Eindhoven), and A. A. Verrijn-Stuart (University Medical Center, Utrecht). We also thank T. C. J. Sas for providing data on height SDS during 3 years in GH-treated patients with SGA. We thank Prof. M. B. Ranke for providing anonymized clinical data from children with short stature, which served as controls for assessing the specificity of the clinical score. The authors thank Prof. O. M. Dekkers for assistance with statistical analysis. Finally, we thank the Dutch Growth Research Foundation (Stichting Kind en Groei) for providing information on the growth response to GH treatment.
Disclosure Summary: J.M.W. is a consultant to OPKO, Merck KGaA, Aeterna Zentaris, Ammonett, and Biomarin and has received speaker’s fees from Pfizer, Versartis, Sandoz, Lilly, Novo Nordisk, JCR, Ipsen, and Merck. A.C.S.H.-K. received independent research grants for investigator-initiated studies from Pfizer and Novo Nordisk, received speaker’s fees from Pfizer, Novo Nordisk, and Merck, and is a member of the Global Advisory Panel of Novo Nordisk. The remaining authors have nothing to disclose.
Abbreviations:
- ACMG
American College of Medical Genetics and Genomics
- AMP
Association for Molecular Pathology
- BHC
birth HC
- BL
birth length
- BW
birth weight
- HC
head circumference
- IGF-1R
IGF-1 receptor
- MLPA
multiplex ligation-dependent probe amplification
- SDS
SD score
- SGA
small for gestational age
- VUS
variants of uncertain significance; Δ
- HSDS
difference in height SDS
