


Abstract
Low circulating vitamin D levels have been associated with lower total testosterone levels. These epidemiological associations, if true, would have public health importance because vitamin D deficiency is common and correctable. We tested whether genetically lowered vitamin D levels were associated with lower total testosterone (T), using Mendelian randomization (MR) methodology.
A total of 4254 men were enrolled from the Survey on Prevalence in East China for Metabolic Diseases and Risk Factors (SPECT-China) study, which was performed at 23 sites in eastern China during 2014 to 2016. Using four single-nucleotide polymorphisms strongly associated with 25-hydroxyvitamin D [25(OH)D] levels, we created a genetic risk score (GRS) as an instrumental variable to estimate the effect of genetically lowered 25(OH)D on total T.
Total T was detected by chemiluminescence assay.
Lower 25(OH)D levels were associated with lower total T (β, 0.40; 95% CI, 0.23 to 0.58) after multivariable adjustment. Per-SD increase in the vitamin D GRS (VD_GRS) was significantly associated with 25(OH)D (β, −1.64; 95% CI, −2.04 to −1.24) and with total T (β, −0.19; 95% CI, −0.37 to −0.02). Using VD_GRS as the instrumental variable in the MR analysis, the causal regression coefficient of genetically determined per-SD increase for 25(OH)D on total T was 0.12 (95% CI, 0.02 to 0.22).
We provide evidence for the biologically plausible causal effects of 25(OH)D on total T using MR analysis. Whether vitamin D supplementation can raise androgen levels merits further investigation in long-term, randomized controlled trials.
Vitamin D deficiency has been becoming a pandemic public health problem in developing and developed countries and in all age groups (1). Beyond the well-known relationship between vitamin D deficiency and musculoskeletal diseases, accumulating evidence has indicated the effect of vitamin D deficiency on extraskeletal disorders such as certain cancers (2), autoimmune diseases (3), infectious diseases (4), diabetes mellitus (5), and neurocognitive disorders (6). It is noteworthy that vitamin D is a relatively cheap and safe supplement for most individuals, thus there may be potentially a great upside to increasing the vitamin D status in the population worldwide to improve health problems, if the casual links are determined (7).
Vitamin D deficiency might lower testosterone (T) levels. Observational evidence supports this speculation: Our previous study found that lower 25-hydroxyvitamin D [25(OH)D] level was associated with lower T level and increased OR of hypogonadism (8), which was in accordance with findings of other cross-sectional studies (9, 10), and the association revealed a concordant seasonal variation in one study (11). Furthermore, one trial indicated that vitamin D supplementation increased T levels in overweight subjects (12), and another study in men with normal baseline T concentrations showed that vitamin D supplementation did not increase T concentrations (13). Because of the nature of cross-sectional studies and inconsistent results of small intervention studies, the causality between vitamin D and total T should be further confirmed.
An alternative to classical observational study is Mendelian randomization (MR) study. MR uses an instrumental variable built from genetic variants in nonexperimental data to make a causal inference about the effect of an exposure on an outcome (14). In this study, if low 25(OH)D levels causally lead to lower total T levels, genetic variants associated with lower25(OH)D status should be associated with lower total T levels. Because allelic variants are inherited randomly from parent to offspring during meiosis and do not change over time, they are not prone to potential confounding factors (15). Thus, analogous to natural randomized controlled trials (RCT), MR could avoid problems in traditional epidemiological studies such as inadequate control of confounders and reverse causation (14).
On the basis of the large, community-based sample from the Survey on Prevalence in East China for Metabolic Diseases and Risk Factors (SPECT-China) study, we adopted an MR approach to test the hypotheses that low plasma 25(OH)D concentrations caused by genetic variants were associated with low androgen levels. A vitamin D genetic risk score (VD_GRS) was constructed to represent the genetic susceptibility.
Methods
Participants
The data were from the ongoing SPECT-China study, which is a large, cross-sectional study. Recruitment and enrollment have been previously described in detail (16–18). Briefly, Chinese citizens ≥18 years old who had lived in their current area for ≥6 months were selected. We excluded subjects with severe communication problems or acute illness, or who were unwilling to participate. From February 2014 to May 2016, 12,666 subjects who were 18 to 93 years old were recruited for the SPECT-China study from 23 sites in Shanghai, Zhejiang, Jiangxi, Jiangsu, and Anhui Province, among whom 5118 men were not taking hormone replacement therapy. Among them, genotype information was available for 4257 participants (83.2%). We further excluded participants who had missing information on more than two single nucleotide polymorphism (SNP) genotypes (n = 3). Finally, 4254 men were involved in this analysis.
The study received approval from the Ethics Committee of Shanghai Ninth People’s Hospital, Shanghai JiaoTong University School of Medicine. All procedures followed complied with the ethical standards of the responsible committee on human experimentation (institutional and national) and with the Helsinki Declaration of 1975, as revised in 2008. Written informed consent was obtained for all study participants.
Measurements
Interview and collection of biological specimens at each site was undertaken with a single assessment protocol. Blood samples were obtained between 7 am and 10 am after fasting for at least 8 hours. Blood was refrigerated immediately after phlebotomy, and after 2 to 4 hours, it was centrifugated and the serum was aliquoted and frozen in a central laboratory. Glycated hemoglobin (HbA1c) was measured using HPLC (MQ-2000PT; Medconn, Shanghai, China). Fasting plasma glucose (FPG) levels were measured by a Beckman Coulter AU 680 (Beckman Coulter, Brea, CA).
25(OH)D and total T levels were detected by investigators who were blinded to phenotypic and genotypic data. 25(OH)D was measured with a chemiluminescence assay (ADVIA Centaur XP; Siemens, Germany). The detection range of the assay for 25(OH)D is 10.5 to 375nmol/L. Total T levels also were detected with a chemiluminescence assay (Immulite 2000; Siemens, Erlangen, Germany). The minimal detectable limit for total T was 0.7 nmol/L. The intra-assay variations were calculated from three duplicate determinations in an assay, and the interassay variations were calculated from results of 500 separate assays, with duplicate samples in each assay. The interassay and intra-assay coefficients of variation were 6.6% and 5.7%, respectively, for total T.
Weight and height were measured when subjects wore light clothes without shoes. Body mass index (BMI) was calculated as weight (kg) divided by height squared (m2).
Definitions
Current smoking was defined as having smoked ≥100 cigarettes in one’s lifetime and currently smoking cigarettes (19). Diabetes was determined as a previous diagnosis by health care professionals, FPG level ≥7.0 mmol/L, or HbA1c ≥6.5%. Hypertension was assessed as systolic blood pressure (SBP) ≥140 mm Hg or diastolic blood pressure (DBP) ≥90 mm Hg or self-reported previous diagnosis of hypertension by physicians. Each of the 23 sites was allocated to high or low economic status in comparison with the gross domestic product per capita of the whole nation (US$6807 according to the World Bank) in 2013.
Genotyping, genetic loci selection, and GRS construction
DNA was extracted from peripheral blood leukocytes by using a blood genomic DNA extraction kit (DP603; Tiangen Biotech, Beijing, China) on an automated nucleic acid extraction instrument (YOSE-S32; Tiangen Biotech). Specific assays were designed using the Geneious Pro, version 4.8.3 (https://www.geneious.com/). Mass determination was carried out with the JUNO and data acquisition was performed with Fluidigm SNP Genotyping Analysis software, version 4.1.3 (Fluidigm, South San Francisco, CA) (20). Amplification reactions were performed in a total volume of 10 μL in optical 96-well plates. Thermal cycler conditions of real-time PCR were as follows: 10 minutes at 95°C (hold stage), 15 seconds at 95°C for DNA denaturation, and 1 minute at 60°C for annealing and extension for 40 cycles using a BIO-RAD C1000 Touch Real-Time PCR system. Call rates of all SNPs were >98%.
The four vitamin D–related SNPs [7-dehydrocholesterol reductase (DHCR7)-rs12785878; cytochrome P450 family 2 subfamily R member 1 (CYP2R1)-rs10741657; vitamin D binding protein (GC)-rs2282679; and cytochrome P450 family 24 subfamily A member 1 (CYP24A1)-rs6013897] were chosen on the basis of the recent genomewide association study on 25(OH)D (21). They all reached a genomewide significance level (P < 5 × 10⁻⁸) and were not in linkage disequilibrium.
Statistical analysis
We conducted the analyses using SPSS, version 24, statistical software (IBM, Armonk, NY). A two-sided P value < 0.05 indicated significance. Continuous variables were presented as the mean ± SD and categorical variables as a percentage.
Construction of the GRS was performed using the additive genetic model for each SNP (coded as 0, 1, and 2 to genotypes containing none, one, or two risk alleles, respectively) (22). For the VD_GRS, we created a weighted score by multiplying the number of 25(OH)D decreasing alleles of each SNP with the respective β coefficient reported from a large study of an Asian population (23), and then adding all values. The characteristics of the individual SNPs in the VD_GRS are listed in Table 1. The weighted GRS was used in the current study, and the unweighted GRS was used in the sensitivity analysis.
Information of each SNP in VD_GRS
| Gene | Chromosome | Position | SNP | Effect Allele | EAF | χ2 | P for HWE |
|---|---|---|---|---|---|---|---|
| GC | 4 | 71742666 | rs2282679 | G | 0.32 | 0.02 | >0.05 |
| CYP2R1 | 11 | 14893332 | rs10741657 | G | 0.64 | 0.48 | >0.05 |
| DHCR7 | 11 | 71456403 | rs12785878 | G | 0.56 | 0.43 | >0.05 |
| CYP24A1 | 20 | 54125940 | rs6013897 | A | 0.17 | 2.99 | >0.05 |
Abbreviations: EAF, effect allele frequency; HWE, Hardy-Weinberg equilibrium.
The strength of the applied instruments were evaluated using the F statistic [F = (R2* (n − 2))/(1 − R2)] (24), with values >10 regarded as useful for MR analysis (15).
Linear regression analyses were performed to determine the associations of the VD_GRS and 25(OH)D with total T. Model 1 adjusted for age, economic status, and current smoking (yes or no). Model 2 was additionally adjusted for BMI, hypertension (yes or no), and diabetes (yes or no).
When applying the MR method, the weighted VD_GRS was used as the instrumental variable estimators. The formal MR analyses to examine the causal effect of 25(OH)D on total T were done using the instrumental variable ratio method (15). For the lower total T levels because of lower vitamin D status, the computational formula was βIV(VD-T) = βVD_GRS–total T/βVD_GRS–25(OH)D, where IV is instrumental variable. The model was adjusted for age, economic status, current smoking (yes or no), BMI, hypertension (yes or no), and diabetes (yes or no). The SE and CI for the instrumental variable estimators were estimated by the delta method. The following formulas were used:
Results
Association of SNPs with exposure and outcome
We tested the association of the four 25(OH)D-related SNPs with exposure (i.e., 25(OH)D) and outcome (i.e., total T). Unstandardized coefficients (95% CI) of additive regression models are shown in Figs. 1 and 2. In the four 25(OH)D-related SNPs, two SNPs located at the GC or DHCR7 loci were significantly associated with 25(OH)D in this study (Fig. 1). None of the four 25(OH)D-related SNPs individually exhibited significant associations with total T (P ≥ 0.10; Fig. 2).
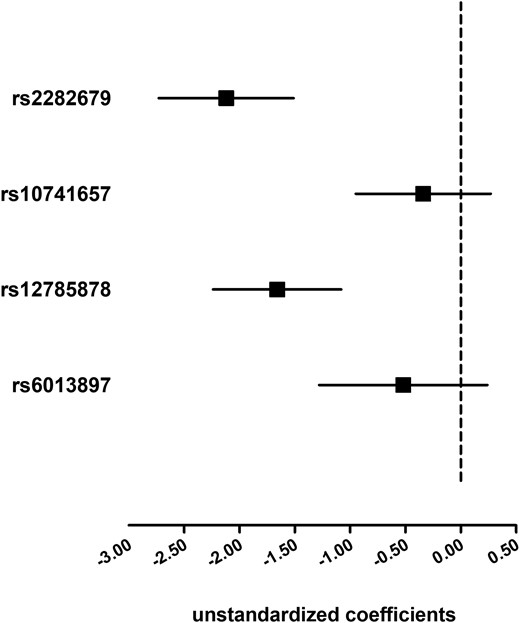
Association of the four 25(OH)D-related SNPs with 25(OH)D. Linear regression analyses were used and the model was adjusted for age, economic status, current smoking, BMI, hypertension, and diabetes. Solid squares represent unstandardized coefficients of each individual SNP with 25(OH)D. The 95% CIs are denoted by lines.
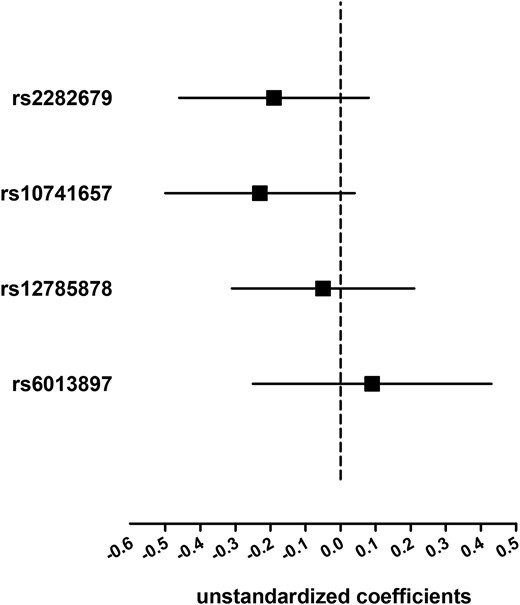
Association of the four 25(OH)D-related SNPs with total T. Linear regression analyses were used and the model was adjusted for age, economic status, current smoking, BMI, hypertension, and diabetes. Solid squares represent unstandardized coefficients of each individual SNP with total T. The 95% CIs are denoted by lines.
Pleiotropic effects of SNPs
We checked whether the SNPs showed any association with 25(OH)D or T-related major metabolic traits. Therefore, we tested the potential associations of the SNPs with BMI, FPG, HbA1c, SBP, and DBP using an additive model. The results are presented in Table 2. None of the 25(OH)D-related SNPs exerted pleiotropic effects.
Association Between Each Individual SNP With Metabolic Confounders
| BMI | FPG | HbA1c | SBP | DBP | ||||||
|---|---|---|---|---|---|---|---|---|---|---|
| β (SE) | P | β (SE) | P | β (SE) | P | β (SE) | P | β (SE) | P | |
| rs2282679 | −0.04 (0.08) | 0.67 | 0.01 (0.04) | 0.87 | −0.01 (0.03) | 0.65 | −0.18 (0.46) | 0.69 | 0.07 (0.30) | 0.81 |
| rs10741657 | −0.13 (0.08) | 0.12 | 0.07 (0.04) | 0.07 | 0.02 (0.02) | 0.41 | −0.18 (0.45) | 0.68 | −0.16 (0.29) | 0.59 |
| rs12785878 | 0.05 (0.08) | 0.51 | 0.06 (0.04) | 0.11 | 0.02 (0.02) | 0.30 | 0.31 (0.43) | 0.48 | 0.02 (0.28) | 0.95 |
| rs6013897 | 0.11 (0.10) | 0.30 | 0.05 (0.05) | 0.30 | <0.01 (0.03) | 0.99 | −0.27 (0.57) | 0.63 | −0.50 (0.37) | 0.17 |
Data are expressed as unstandardized coefficients (SE).
Characteristics of study participants according to VD_GRS quartiles
As expected, with the increasing VD_GRS, serum 25(OH)D concentrations gradually and markedly increased. We showed a stepwise lower total T level with increases in the VD_GRS. However, the aggregated allele score was neither consistently associated with any of the investigated biochemical markers such as FPG, HbA1c, SBP, and DBP, nor with the risk factors such as smoking status, diabetes, hypertension, or BMI (Table 3).
Characteristics of Study Participants According to the Weighted VD_GRS
| Characteristic | VD_GRS | P for Trenda | |||
|---|---|---|---|---|---|
| Q1 | Q2 | Q3 | Q4 | ||
| VD_GRS | ≤0.64 | 0.65–0.89 | 0.90–1.16 | ≥1.17 | |
| No. of participants | 1067 | 1063 | 1160 | 964 | |
| Age, y | 55.6 (13.2) | 55.5 (13.3) | 56.0 (12.9) | 55.7 (13.0) | 0.62 |
| 25(OH)D, nmol/L | 45.4 (14.1) | 44.0 (13.3) | 42.5 (13.2) | 41.5 (12.7) | <0.001 |
| BMI, kg/m2 | 25.0 (3.4) | 25.0 (3.4) | 25.0 (3.5) | 24.9 (3.5) | 0.48 |
| FPG, mmol/L | 5.7 (1.4) | 5.7 (1.5) | 5.7 (1.6) | 5.8 (1.8) | 0.06 |
| HbA1c, % | 5.7 (1.0) | 5.7 (1.0) | 5.7 (1.1) | 5.8 (1.2) | 0.17 |
| SBP, mm Hg | 134.8 (20.9) | 134.5 (20.2) | 134.6 (20.8) | 134.3 (20.9) | 0.68 |
| DBP, mm Hg | 82.2 (13.3) | 82.2 (12.6) | 82.1 (13.0) | 81.5 (12.8) | 0.24 |
| Current smoker, % | 45.9 | 46.0 | 49.0 | 48.8 | 0.09 |
| Economic status, low/high, % | 33.8/66.2 | 34.7/65.3 | 35.7/64.3 | 36.1/63.9 | 0.24 |
| Diabetes, % | 15.7 | 17.3 | 16.5 | 18.4 | 0.18 |
| Hypertension, % | 55.1 | 53.5 | 53.6 | 51.4 | 0.13 |
| Total T, nmol/L | 16.8 (6.2) | 16.7 (5.9) | 16.7 (6.3) | 16.5 (6.1) | 0.30 |
Data are reported as the mean (SD) for continuous variables or as a numerical proportion for categorical variables.
Abbreviation: Q, quartile.
Calculated by ANOVA and χ2 tests.
Association of VD_GRS and 25(OH)D with total T
First, a 1-SD increase of 25(OH)D was positively and significantly associated with total T level after adjustment for age, economic status, and current smoking (β, 0.45; 95% CI, 0.26 to 0.63; see model 1 column in Table 4). Further adjusting for metabolic profiles slightly attenuated the association, but it remained significant (β, 0.40; 95% CI, 0.23 to 0.58).
Associations of VD_GRS and 25(OH)D With Total T
| Model 1a | Model 2b | |
|---|---|---|
| Per-SD increase of VD_GRS | −0.23 (−0.41 to −0.04)c | −0.19 (−0.37 to −0.02)c |
| VD_GRS quartile | ||
| 1 | 0.60 (0.07–1.13)c | 0.52 (0.02–1.02)c |
| 2 | 0.38 (−0.16 to 0.91) | 0.34 (−0.16–0.85) |
| 3 | 0.30 (−0.22 to 0.82) | 0.28 (−0.22 to 0.77) |
| 4 | 0.00 (Ref.) | 0.00 (Ref.) |
| P for trend | 0.03 | 0.04 |
| Per SD increase of 25(OH)D | 0.45 (0.26–0.63)d | 0.40 (0.23–0.58)d |
Data reported as β coefficients and 95% CIs.
Model 1 adjusted for age, economic status, and current smoking.
Model 2 adjusted for terms in model 1, BMI, hypertension (yes or no), and diabetes (yes or no).
P < 0.05.
P < 0.001.
Next, we measured the association of VD_GRS with total T level. As shown in Table 4, the per-SD increment of VD_GRS was negatively and significantly associated with total T level after adjustment for age, economic status, and current smoking (β, −0.23; 95% CI, −0.41 to −0.04; see model 1 column in Table 4). Further adjusting for BMI, hypertension (yes or no), and diabetes (yes or no) did not alter the results (β, −0.19; 95% CI, −0.37 to −0.02; see model 2 column in Table 4). In addition, we found that the effects of VD_GRS on total T level were unchanged when GRS was modeled as the variable categorized into quartiles. Compared with the highest VD_GRS quartile, the lowest quartile was associated with total T (β, 0.52; 95% CI, 0.02 to 1.02; P for trend = 0.04).
Figure 3 shows the association of genetically determined 25(OH)D with total T level. In the instrumental variable analysis, the causal regression coefficient (βIV) of genetically determined 25(OH)D for total T was 0.12 (95% CI, 0.02 to 0.22).
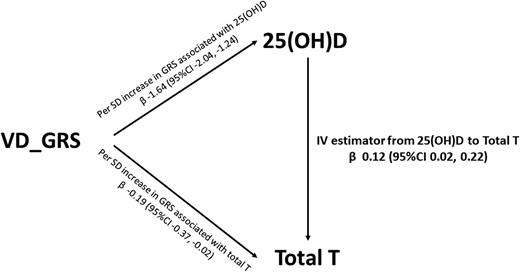
Instrumental variable (IV) estimated association between 25(OH)D and total T. Data were adjusted for age, economic status, current smoking, BMI, hypertension, and diabetes.
In a sensitivity analysis, similar associations were observed for the unweighted VD_GRS. The causal estimate from 25(OH)D to total T was 0.12 (95% CI, 0.01 to 0.23).
Discussion
In this cross-sectional survey of 4254 community-dwelling Chinese adults, we adopted MR design to examine the causal link between 25(OH)D and total T levels. Our study demonstrated that a genetic decrease in 25(OH)D was associated with lower T level, providing evidence in support of a causal role of vitamin D in raising T levels.
Vitamin D receptor has been observed in the male reproductive system (25) and vitamin D receptor knockout mice have gonadal insufficiency (26), both of which suggest a potential role of vitamin D in the production of male reproductive hormones. This notion is supported by an association of vitamin D and androgen levels in men, suggested by observational studies (8–11). In line with these findings, Pilz et al. (12) reported a significant increase in T concentration after vitamin D supplementation for 1 year in overweight men with 25(OH)D level <50 nmol/L. Two other studies have also showed that vitamin D treatment improves androgen levels (27, 28). However, in a post hoc analysis by Heijboer et al. (13) of three small intervention studies of limited duration (6 to 16 weeks) in men with normal T concentrations, no beneficial vitamin D effect on T was observed. A recent RCT also demonstrated that 12 weeks of vitamin D administration had no significant effect on T status in 100 middle-aged eugonadal men with 25(OH)D level <75 nmol/L (29). The discrepancy in the results of previous clinical trials may lie in different study designs and subjects, baseline T levels, and the methods adopted for T detection (29). Of note, an important difference between MR studies and RCTs is that MR studies describe the association of a lifelong exposure to vitamin D–lowering alleles in the general population, whereas RCTs only provide insights from supplementation for shorter periods in individuals at risk during the time of study. Thus, long-term RCTs are warranted to fully investigate the impact of vitamin D supplementation in elevating androgen levels.
In MR, genetic variant(s) are used as instrumental variables to explore the causal effect of the exposure on the outcome. In our study, the four 25(OH)D SNPs were combined into a GRS. The GRS is a convenient way of summarizing the susceptibility of the overall contribution of multiple genetic variants associated with an exposure of interest (30). Because one SNP explains very little of the fraction of a trait variance, using a GRS as an instrumental variable instead of each individual SNP helps increase power and make stronger instruments (15). To be a valid instrumental variable, three fundamental MR assumptions should be met (15, 31). First, the GRS should be associated with the exposure. All SNPs used in this study are robustly associated with vitamin D status in large genomewide association studies (32). In the current study, we also observed a significant association between the calculated risk score comprising these four SNPs and 25(OH)D level. Second, the GRS should not be correlated with any confounders of the exposure-outcome relation. In our study, we found the VD_GRS was not associated with BMI, smoking status, diabetes, and hypertension, which were common potential confounders of the vitamin D–T association (Table 5). We further assessed the pleiotropic effects of each SNP on the confounders and also found no evidence for the SNPs we used being associated with confounders. Third, the GRS is independent of the outcome, except possibly via its influence on the exposure. It means that the genetic instruments affect the outcome only through the exposure (i.e., by no other routes between VD_GRS and total T). Considering this assumption, we analyzed the association between each SNP with the outcome. As expected, none of the four SNPs was significantly associated with total T. Notably, additional adjustment for 25(OH)D greatly attenuated the association between VD_GRS and total T, and it was no longer statistically significant (β, −0.15, 95% CI, −0.32 to 0.03), which also indicated that the association of VD_GRS with lower androgen was mediated by 25(OH)D.
Association of 1 Unit Increment of the GRSs With Metabolic Traits
| VD_GRS | P | VD_GRSunweighted | P | |
|---|---|---|---|---|
| Continuous variable, β (95% CI) | ||||
| 25(OH)D | −1.64 (−2.04 to −1.24) | <0.001 | −1.58 (−1.98 to −1.18) | <0.001 |
| BMI | −0.02 (−0.12 to 0.09) | 0.78 | −0.01 (−0.11 to 0.10) | 0.93 |
| FPG | 0.04 (−0.01 to 0.08) | 0.06 | 0.04 (−0.01 to 0.07) | 0.06 |
| HbA1C | 0.01 (−0.02 to 0.05) | 0.39 | 0.01 (−0.02 to 0.05) | 0.42 |
| SBP | −0.08 (−0.67 to 0.50) | 0.78 | −0.11 (−0.69 to 0.48) | 0.73 |
| DBP | −0.12 (−0.51 to 0.26) | 0.52 | −0.15 (−0.54 to 0.23) | 0.43 |
| Categorical variable, OR (95% CI) | ||||
| Current smoking | 0.96 (0.90–1.02) | 0.14 | 0.95 (0.90–1.02) | 0.14 |
| Diabetes | 1.06 (0.97–1.15) | 0.21 | 1.06 (0.97–1.15) | 0.19 |
| Hypertension | 0.95 (0.89–1.02) | 0.18 | 0.95 (0.89–1.02) | 0.16 |
Multiple linear regression was performed.
In our main analysis, there were concerns that the DHCR7 gene converts 7-dehydrocholesterol to cholesterol (32), providing a substrate for sex hormones (33). Hence, this SNP may affect T levels via a vitamin D–independent mechanism. Nonetheless, we conducted a sensitivity analysis to examine the effect of excluding this SNP. When the DHCR7 SNP was excluded, our results were unchanged [the causal estimate from 25(OH)D to total T was 0.18 (95% CI 0.01 to 0.35)].
The identification of a causal relationship between 25(OH)D and T may have important clinical implications, because vitamin D deficiency is common, and vitamin D supplementation is relatively safe and cost-effective (7). T is the primary male sex hormone. In addition to maintaining development of male reproductive tissues and secondary sexual characteristics, accumulating evidence has shown that androgen deficiency may contribute to cardiovascular disease and be involved in a myriad of metabolic disorders in men (34, 35). Accordingly, a causal link between vitamin D and T, with a potential increase of T concentration after vitamin D supplementation, is of clinical interest.
The strengths of our study were its well-defined, community-based population, the MR design that largely avoided the possibility of residual confounding and reverse causation, and the created VD_GRS representing the combined effect of the established common genetic variations of 25(OH)D as the instrumental variable. In addition, our results represent the probable causal association of exposure to genetically determined 25(OH)D with total T in the general population.
However, there are several limitations we should acknowledge. First, all participants were of Asian descent; thus, our findings may not be necessarily applicable to other ethnicities. Second, we created our VD_GRS only on the basis of common variants, which was considered to represent a limited amount of variance in 25(OH)D. We were unable to assess the potential contribution of rare variants. Third, only 2.7% of our subjects had apparent vitamin D deficiency [25(OH)D <20 nmol/L]. It remains unknown whether apparent vitamin D deficiency leads to T deficiency. Fourth, although we found no evidence for the instrumental variable being associated with confounders we measured, we cannot rule out associations with unmeasured confounders.
In conclusion, we demonstrated that genetically lowered 25(OH)D level is associated with lower total T level in people of Chinese descent, raising the possibility of the potential therapeutic benefits of vitamin D supplementation in increasing androgen levels. Further prospective cohort and multiethnicity MR studies should be performed in subjects with apparent vitamin D deficiency to confirm the causal vitamin D–T relationships.
Acknowledgments
Financial Support: This study was supported by National Natural Science Foundation of China (Grants 81570726 to Y.L. and 81600609 to N.W.); Shanghai JiaoTong University School of Medicine (Grant 2014 to Y.L.); Science and Technology Commission of Shanghai Municipality (Grants 16410723200 to N.W. and 16411971200 to Y.L.); Shanghai Municipal Commission of Health and Family Planning (Grant 2017YQ053 to N.W.); Commission of Health and Family Planning of Pudong District (Grant PW2015D-5 to Y.L.); and The Fourth Round of Three-year Public Health Action Plan of Shanghai (Grant 15GWZK0202 to Y.L.).
Author Contributions: N.W. and Y.L. designed the research, contributed to the discussion, reviewed and edited the manuscript, and take full responsibility for the work as a whole. C.C. designed the study, wrote the manuscript, and contributed to the discussion. C.C. and H.Z. conducted the research, analyzed the data, and reviewed and edited the manuscript. J.C., P.W., Y.C., Q.L., C.W., and F.X. conducted the research and contributed to the discussion.
Disclosure Summary: The authors have nothing to disclose.
Abbreviations:
- 25(OH)D
25-hydroxyvitamin D
- BMI
body mass index
- DBP
diastolic blood pressure
- DHCR7
7-dehydrocholesterol reductase
- FPG
fasting plasma glucose
- GRS
genetic risk score
- HbA1c
glycated hemoglobin
- MR
Mendelian randomization
- RCT
randomized controlled trial
- SBP
systolic blood pressure
- SNP
single-nucleotide polymorphism
- SPECT-China
Survey on Prevalence in East China for Metabolic Diseases and Risk Factors
- T
testosterone
- VD_GRS
vitamin D genetic risk score
References
Author notes
C.C. and H.Z. contributed equally to this study.
