


Abstract
The risk for dementia among subjects who are obese with normal metabolic profiles, or called metabolically healthy obese (MHO), remains uninvestigated.
To determine the association between late-life metabolic health and obesity status and risk of incident dementia.
Retrospective cohort study.
The National Health Insurance System, Republic of Korea.
A total of 12,296,863 adults >50 years old who underwent health examinations from 2009 to 2012 without baseline history of dementia.
Incident overall dementia, Alzheimer’s disease (AD), and vascular dementia (VaD).
Among subjects ≥60 years old, 363,932 (6.4%) developed dementia during a median follow-up of 65 months (interquartile range 51 to 74 months). The MHO group showed the lowest incidence of overall dementia [hazard ratio (HR) 0.85; 95% CI, 0.84 to 0.86] and AD (HR 0.87; 95% CI, 0.86 to 0.88), but not VaD, compared with the metabolically healthy nonobese group. All components of metabolic syndrome except obesity significantly elevated the risk of dementia, and these associations were more pronounced in VaD. In particular, being underweight dramatically increased the risk of dementia.
The MHO phenotype in late life demonstrated lower risk of overall dementia and AD but not VaD. Additional studies in other populations are warranted to elucidate current results and may predict individuals most at risk for developing dementia.
As society ages, the prevalence of dementia increases. Currently, 35 million people have dementia, a number that is expected to double every 20 years (1, 2). Dementia is characterized by the coexistence of memory impairment and at least one cognitive functional deficit (3). It is also a contributing cause of death, because dementia is usually accompanied by immobility, malnutrition, and weight loss (4). Medical care costs for people with dementia are increasing and are substantially greater than those for cancer, heart disease, or other diseases (5).
The most common type of dementia is Alzheimer’s disease (AD), which accounts for 60% to 80% of cases, followed by vascular dementia (VaD) (6). Aging, family history, apolipoprotein E4 phenotype, and lower educational level are well-known risk factors for both AD and VaD (6, 7). In addition, recent evidence suggests that both VaD and AD are closely related to cardiovascular risk factors such as hypertension, diabetes mellitus (DM), hyperlipidemia, and cigarette smoking (8–11). Regarding the association between obesity and dementia, midlife obesity is associated with an elevated risk of dementia (12, 13), whereas in late life there is a reversed causation (13, 14).
Recently, several studies have suggested improvement in clinical outcomes among a subgroup of subjects who are obese with normal metabolic profiles despite increased adiposity, called metabolically healthy obese (MHO) (15). These subjects exhibited lower insulin resistance and visceral adiposity and were not at higher risk of cardiovascular disease (CVD) and all-cause mortality compared with metabolically healthy nonobese (MHNO) subjects (15, 16). In contrast, with regard to the development of hypertension, type 2 DM, and chronic kidney disease (CKD), MHO subjects were at 1.4- to 1.6-fold higher risk than their nonobese counterparts (17–19). However, to our knowledge there are no studies reporting the relationship between the MHO phenotype and the development of dementia. Therefore, we investigated the impact of the MHO phenotype on incident dementia according to body mass index (BMI) and metabolic health status by using a nationwide population-based cohort study.
Materials and Methods
Study population
The National Health Insurance System (NHIS) of Korea consists of the two major programs: National Health Insurance (NHI), which covers 97% of the population, and Medical Aid (MA), which covers the remaining 3% of the population (with low income). All Koreans must be registered in one of these two systems. Since 2006, the database of MA beneficiaries has been integrated into the NHIS database (20, 21). This database contains demographic information (eg, age, sex, income level), claim information [diagnosis defined by International Classification of Diseases (ICD) codes and details of prescriptions], and health checkup information (results of basic laboratory tests and questionnaires about past medical history, current medications, and lifestyle). The NHIS national health screening program is recommended biannually, and the participation rate is high, recorded at 74.8% in 2014 (20–22). In the current study, we used NHIS data, a well-established cohort representing the entire Korean population, which is >50 million. This study was approved by the Institutional Review Board of the Yonsei University Health System, Severance Hospital (no. 4-2016-0770), and informed consent from study subjects was waived because of the retrospective cohort nature of the study.
We included subjects who underwent health examinations between 1 January 2009 and 31 December 2012. Of the 23,503,802 adults, subjects who had missing baseline data (n = 195,777), age <50 years (n = 10,926,515), and those who received a diagnosis of dementia before the index period (n = 84,647) were excluded. A total of 12,296,863 subjects were enrolled in the study and were followed for a median of 65 months [interquartile range (IQR) 51 to 74 months]. To determine the association between late-life metabolic health and obesity status and the risk of incident dementia, 5,669,488 subjects aged ≥60 years were mainly analyzed, and the late middle-age group of 50 to 60 years (n = 6,627,375) was further analyzed in the supplemental analysis.
Clinical and laboratory measurements
As part of the health examinations, all subjects completed a questionnaire on their medical history, use of tobacco and alcohol, and exercise habits. Smoking habits were categorized as noncurrent or current, alcohol use was classified as <30 g per day or ≥30 g per day (heavy drinker), and exercise level was categorized as less than three times per week or moderate to vigorous exercise three or more times of per week (physically active). We defined low socioeconomic status as income in the lowest 20%. BMI was calculated as body weight (in kilograms) divided by height (in square meters). Blood pressure (BP) was measured in the sitting position after 5 minutes of rest. After overnight fasting, blood samples were collected. Serum glucose, total cholesterol, triglyceride (TG), high-density lipoprotein (HDL), and low-density lipoprotein (LDL) were measured. We calculated glomerular filtration rate by using the four-variable Modification of Diet in Renal Disease Study equation (23). Baseline comorbidities were identified as follows: hypertension (ICD-10 codes I10 to I13 or I15 and treatment with antihypertensive medications, or systolic/diastolic BP ≥140/90 mm Hg), type 2 DM (ICD-10 codes E11 to E14 and antidiabetic drugs, or fasting glucose level ≥126 mg/dL), hyperlipidemia (ICD-10 code E78 with lipid-lowering agents, or serum total cholesterol ≥240 mg/dL), CKD (estimated glomerular filtration rate <60 mL/min/1.73 m2), previous myocardial infarction (ICD-10 codes I21 to I22), and ischemic stroke (ICD-10 codes I63 to I64).
Definition of incident dementia
Incident dementia was considered to be a diagnosis of dementia (ICD-10 codes F00, G30, F01, F02, F03, G23.1, G31.0, G31.1, G31.82, G31.83, G31.88, and F10.7) and prescription of antidementia medication at the same time. The antidementia medications could include an acetylcholinesterase inhibitor (rivastigmine, galantamine, or donepezil) or N-methyl-d-aspartate receptor antagonist (memantine), which are most commonly used to treat dementia (24). Patients with dementia were grouped into AD (ICD-10 codes F00 and G30) or VaD (ICD-10 code F01) by the diagnosis code at the first visit. If diagnoses of both AD and VaD were recorded at the first visit, we used the diagnosis of the second visit.
Definitions of metabolic health and obesity status
Obesity phenotypes were based on the Asia-Pacific BMI criteria (nonobese <25 kg/m2 or obese ≥25 kg/m2), which were established by the World Health Organization Western Pacific Region (25). To identify a subject as metabolically healthy, we used the Adult Treatment Panel III (ATP-III) definition (26). The waist circumference criterion was not used because of its collinearity with BMI under the definition of previous studies (19, 27). Metabolically healthy was defined as meeting no more than one of the following four criteria: a systolic BP ≥130 mm Hg, diastolic BP ≥85 mm Hg, or on antihypertensive treatment; TG ≥150 mg/dL; fasting plasma glucose ≥100 mg/dL or on antidiabetic treatment; or HDL-C <40 mg/dL in men and <50 mg/dL in women. According to these criteria, subjects were categorized as follows: MHNO, BMI <25 kg/m2 and less than two metabolic risk factors; metabolically unhealthy nonobese (MUNO), BMI <25 kg/m2 and two or more metabolic risk factors; MHO, BMI ≥25 kg/m2 and less than two metabolic risk factors; or metabolically unhealthy obese (MUO): BMI ≥25 kg/m2 and two or more metabolic risk factors.
Statistical analysis
All continuous variables are expressed as a mean (SD), and categorical data are presented as numbers (percentages). The characteristics of study subjects according to metabolic health and obesity status were compared via one-way ANOVA for continuous variables and the χ2 test for categorical variables. Dementia-free survival curves were constructed via the Kaplan-Meier method, and between-group differences were compared via log-rank tests. Person-years of follow-up were calculated from the date of the health examination to the date of diagnosis of dementia or to 31 December 2016, whichever came first. Multivariate Cox proportional hazards regression analysis was performed to identify hazard ratios (HRs) of incident dementia according to metabolic health and obesity status: unadjusted in model 1; age and sex were adjusted in model 2; and tobacco and alcohol use, exercise habits, socioeconomic status, and LDL-C were further adjusted in model 3. The MHNO group was used as a reference, and results are presented as HR and 95% CI. Subgroup analyses were conducted by dividing the subjects according to smoking, drinking, and exercise status to adjust for the influence of modifiable risk factors, which were different in the baseline profiles among the four groups. We also conducted supplemental analyses. First, because being underweight is associated with vitamin and mineral deficiencies and because undetected subtle dementia may cause body weight loss, sensitivity analyses were conducted after exclusion of subjects with BMI <18.5 kg/m2. Second, given the increasing incidence of dementia in younger people, we further analyzed the effect of metabolic health and obesity status on the development of dementia in subjects aged 50 to 60 years. All statistical analyses were performed in SAS version 9.2 (SAS Institute, Cary, NC) and R programming version 3.1.0 (The R Foundation for Statistical Computing, Vienna, Austria, http://www.R-project.org). A P <0.05 was considered significant.
Results
Baseline characteristics of study subjects
The baseline clinical and biochemical characteristics of the subjects are summarized in Table 1. Among 5,669,488 subjects aged >60 years, 1,738,074 (30.7%), 1,852,845 (32.7%), 644,447 (11.4%), and 1,434,122 (25.3%) were categorized into the MHNO, MUNO, MHO, and MUO groups, respectively. The mean age was 67.1 years, 45.7% were male, and mean BMI was 24.1 kg/m2.
Baseline Characteristics of Study Subjects According to Metabolic Health and Obesity
| Characteristic | Nonobese (n = 3,590,919) | Obese (n = 2,078,569) | ||
|---|---|---|---|---|
| MHNO (n = 1,738,074) | MUNO (n = 1,852,845) | MHO (n = 644,447) | MUO (n = 1,434,122) | |
| Age, y | 66.8 ± 6.4 | 68.1 ± 6.8 | 65.8 ± 5.6 | 66.9 ± 6.0 |
| Male sex | 867,637 (49.9) | 865,703 (46.7) | 263,261 (40.9) | 595,782 (41.5) |
| Height, cm | 158.9 ± 8.6 | 158.3 ± 8.8 | 157.7 ± 8.6 | 157.8 ± 8.8 |
| Weight, kg | 55.6 ± 7.9 | 56.8 ± 8.0 | 67.3 ± 8.1 | 68.4 ± 8.6 |
| BMI, kg/m2 | 22.0 ± 2.0 | 22.6 ± 1.8 | 27.0 ± 1.8 | 27.4 ± 2.1 |
| Systolic BP, mm Hg | 122.3 ± 14.8 | 132.0 ± 15.6 | 126.1 ± 14.7 | 133.6 ± 15.2 |
| Diastolic BP, mm Hg | 75.0 ± 9.5 | 79.4 ± 9.9 | 77.2 ± 9.5 | 80.5 ± 9.8 |
| Fasting glucose, mg/dL | 92.8 ± 16.0 | 111.0 ± 30.9 | 93.1 ± 14.4 | 112.0 ± 29.6 |
| Total cholesterol, mg/dL | 196.6 ± 36.2 | 197.5 ± 40.4 | 201.6 ± 36.9 | 200.4 ± 40.6 |
| TG, mg/dL | 98.3 ± 42.5 | 163.2 ± 93.9 | 106.4 ± 43.7 | 175.2 ± 95.4 |
| HDL-C, mg/dL | 59.0 ± 17.7 | 50.3 ± 17.7 | 57.7 ± 17.3 | 49.2 ± 17.0 |
| LDL-C, mg/dL | 118.2 ± 33.4 | 115.4 ± 36.9 | 122.8 ± 34.3 | 117.1 ± 37.4 |
| Current smoker | 285,388 (16.4) | 293,240 (15.8) | 59,865 (9.3) | 150,405 (10.5) |
| Heavy drinker | 68,470 (3.9) | 92,641 (5.0) | 20,785 (3.2) | 61,843 (4.3) |
| Exercise | 759,858 (43.7) | 750,817 (40.5) | 284,349 (44.1) | 585,875 (40.9) |
| Low socioeconomic status | 384,236 (22.1) | 414,186 (22.4) | 139,787 (21.7) | 315,948 (22.0) |
| Comorbidities | ||||
| Hypertension | 484,857 (27.9) | 1,234,184 (66.6) | 262,942 (40.8) | 1,086,237 (75.7) |
| Diabetes | 75,192 (4.3) | 539,691 (29.1) | 26,257 (4.1) | 469,584 (32.7) |
| Hyperlipidemia | 149,566 (8.6) | 253,593 (13.7) | 67,287 (10.4) | 212,404 (14.8) |
| CKD | 162,082 (9.3) | 285,461 (15.4) | 72,966 (11.3) | 247,832 (17.3) |
| Previous myocardial infarction | 77,872 (4.5) | 127,374 (6.9) | 37,534 (5.8) | 116,146 (8.1) |
| Previous ischemic stroke | 80,878 (4.7) | 144,502 (7.8) | 33,838 (5.3) | 111,809 (7.8) |
Values are presented as mean (SD) for continuous variables and n (%) for categorical variables.
Figure 1 shows the distribution by ATP-III criteria for metabolic syndrome in the four groups. All parameters showed higher prevalence in the metabolically unhealthy groups than in the metabolically healthy groups. Of these, the most common ATP-III criterion for metabolic syndrome was high BP (69.3%), followed by hyperglycemia (54.8%), hypertriglyceridemia (49.2%), and low HDL-C (43.6%).
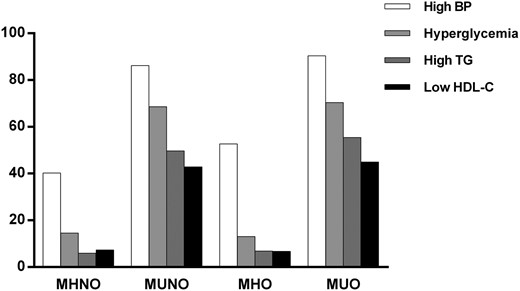
Distribution of metabolic syndrome criteria by metabolic health and obesity status.
Risk of incident dementia according to metabolic health and obesity status
During 29,089,302 person-years of follow-up, a total of 363,932 subjects (6.4%) developed incident dementia. Among them, 267,368 (73.5%) had AD and 43,918 (12.1%) had VaD. The crude incidence rate of overall dementia was 5.7% (99,538/1,738,074) in the MHNO group, 8.1% (150,341/1,852,845) in the MUNO group, 4.3% (27,675/644,447) in the MHO group, and 6.0% (86,378/1,434,122) in the MUO group. Figure 2 shows the Kaplan-Meier curves for overall dementia-free survival for each group. Subjects in the MHO group had the lowest probabilities of developing incident dementia, and the probabilities increased sequentially for the MHNO, MUO, and MUNO groups (log rank P < 0.001).
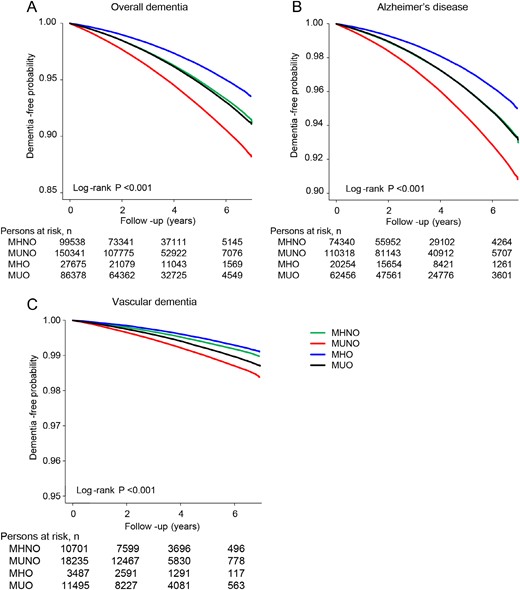
Dementia-free survival by Kaplan-Meier. (A) Overall dementia. (B) AD. (C) VaD. Subjects were followed for a median of 65 months (IQR 51 to 74 months). Cumulative dementia-free probability is presented in the y-axis. Plots use different y-axis scales.
The incidence rates (number of events per 1000 person-years) and HRs of overall dementia, AD, and VaD according to metabolic health and obesity status are demonstrated in Table 2. Adjusted HRs (95% CIs) of the MUNO, MHO, and MUO groups for incident overall dementia were 1.16 (1.15 to 1.17), 0.85 (0.84 to 0.86), and 1.01 (0.99 to 1.02), respectively, compared with the MHNO group after adjustment for age, sex, tobacco and alcohol use, exercise level, socioeconomic status, and LDL-C (model 3). With regard to the subtypes of dementia, subjects in the MHO group showed a significantly lower HR for AD compared with the MHNO group; however, a protective effect was not observed in VaD. In addition, those who were metabolically unhealthy were associated with higher dementia risk, and this effect was more prominent in VaD than AD, demonstrating a 30% to 40% risk elevation. There was no sex-related difference in the incidence of dementia (data not shown).
HRs for the Development of Dementia According to Metabolic Health and Obesity Status
| Group | Incident Cases, n | Person-Years, n | Incident Ratea | Model 1b | Model 2c | Model 3d |
|---|---|---|---|---|---|---|
| Overall dementia | ||||||
| MHNO | 99,538 | 8,928,576 | 11.1 | 1 (reference) | 1 (reference) | 1 (reference) |
| MUNO | 150,341 | 9,386,923 | 16.0 | 1.44 (1.43–1.45) | 1.20 (1.19–1.21) | 1.16 (1.15–1.17) |
| MHO | 27,675 | 3,364,116 | 8.2 | 0.74 (0.73–0.75) | 0.86 (0.84–0.87) | 0.85 (0.84–0.86) |
| MUO | 86,378 | 7,409,687 | 11.7 | 1.05 (1.04–1.06) | 1.04 (1.03–1.05) | 1.01 (0.99–1.02) |
| AD | ||||||
| MHNO | 74,340 | 8,928,576 | 8.3 | 1 (reference) | 1 (reference) | 1 (reference) |
| MUNO | 110,318 | 9,386,923 | 11.8 | 1.41 (1.40–1.43) | 1.16 (1.15–1.18) | 1.38 (1.35–1.42) |
| MHO | 20,254 | 3,364,116 | 6.0 | 0.72 (0.71–0.73) | 0.84 (0.83–0.85) | 0.87 (0.86–0.88) |
| MUO | 62,456 | 7,409,687 | 8.4 | 1.01 (1.00–1.02) | 1.00 (0.99–1.02) | 1.29 (1.25–1.32) |
| VaD | ||||||
| MHNO | 10,701 | 8,928,576 | 1.2 | 1 (reference) | 1 (reference) | 1 (reference) |
| MUNO | 18,235 | 9,386,923 | 1.9 | 1.62 (1.59–1.66) | 1.42 (1.38–1.45) | 1.41 (1.38–1.44) |
| MHO | 3,487 | 3,364,116 | 1.0 | 0.86 (0.83–0.90) | 0.99 (0.96–1.03) | 1.02 (0.98–1.06) |
| MUO | 11,495 | 7,409,687 | 1.6 | 1.29 (1.26–1.33) | 1.32 (1.28–1.35) | 1.33 (1.29–1.36) |
Values with statistical significance are bold.
Incident rate for 1000 person-years.
Unadjusted.
Adjusted for age and sex.
Further adjusted for tobacco and alcohol use, exercise, socioeconomic status, and LDL-C.
Furthermore, we conducted subgroup analyses by dividing the subjects according to smoking, drinking, and exercise status: subjects without modifiable risk factors (noncurrent smoker, no heavy drinker, and physically active; n = 1,978,111) and subjects with modifiable risk factors (current smoker, heavy drinker, and not physically active; n = 60,564). Consistent with the main results, the MHO group showed the lowest incidence of overall dementia and AD; incident VaD was not affected, regardless of the presence of modifiable risk factors (Table 3). In particular, the protective effect of the MHO phenotype on the development of AD was more prominent in the dementia-prone subjects with risk factors (HR 0.71 in the group with risk factors vs 0.88 in the group with no risk factors).
Contribution of Metabolic Health and Obesity Status on the Development of Dementia According to the Presence of Modifiable Risk Factors
| Group | Without Modifiable Risk Factorsa | With Modifiable Risk Factorsb | ||
|---|---|---|---|---|
| Model 1c | Model 2d | Model 1c | Model 2d | |
| Overall dementia | ||||
| MHNO | 1 (reference) | 1 (reference) | 1 (reference) | 1 (reference) |
| MUNO | 1.07 (1.06–1.09) | 1.05 (1.03–1.07) | 0.77 (0.68–0.86) | 1.00 (0.89–1.12) |
| MHO | 0.79 (0.77–0.81) | 0.89 (0.87–0.92) | 0.65 (0.53–0.79) | 0.81 (0.67–0.98) |
| MUO | 1.42 (1.40–1.44) | 1.18 (1.16–1.20) | 1.23 (1.14–1.33) | 1.32 (1.23–1.43) |
| AD | ||||
| MHNO | 1 (reference) | 1 (reference) | 1 (reference) | 1 (reference) |
| MUNO | 1.03 (1.01–1.05) | 1.00 (0.98–1.03) | 0.75 (0.65–0.86) | 1.00 (0.87–1.15) |
| MHO | 0.78 (0.76–0.80) | 0.88 (0.86–0.91) | 0.55 (0.43–0.71) | 0.71 (0.55–0.91) |
| MUO | 1.39 (1.37–1.42) | 1.15 (1.13–1.17) | 1.17 (1.06–1.28) | 1.26 (1.15–1.38) |
| VaD | ||||
| MHNO | 1 (reference) | 1 (reference) | 1 (reference) | 1 (reference) |
| MUNO | 1.41 (1.34–1.48) | 1.39 (1.32–1.46) | 0.97 (0.74–1.27) | 1.19 (0.91–1.56) |
| MHO | 0.97 (0.90–1.04) | 1.07 (1.00–1.15) | 0.77 (0.48–1.22) | 0.91 (0.57–1.45) |
| MUO | 1.66 (1.58–1.74) | 1.43 (1.37–1.51) | 1.44 (1.19–1.75) | 1.52 (1.25–1.85) |
Values with statistical significance are bold.
Subjects of noncurrent smoker, not heavy drinker, and physically active.
Subjects of current smoker, heavy drinker, and not physically active.
Unadjusted.
Adjusted for age, sex, socioeconomic status, and LDL-C.
Impact of metabolic syndrome and its components on the risk of incident dementia
Next, we examined the association between BMI, components of metabolic syndrome, and incident dementia (Table 4). Compared with subjects who are not obese, subjects who are obese had a lower risk of overall dementia (HR 0.90; 95% CI, 0.89 to 0.91) and AD (HR 0.88; 95% CI, 0.87 to 0.89), but obesity had no beneficial impact on VaD (HR 1.01; 95% CI, 0.99 to 1.03). All metabolic syndrome criteria (high BP, hyperglycemia, high TG, and low HDL-C) were significantly associated with the development of dementia regardless of type, and these associations were more pronounced in VaD. Meeting two or more criteria for metabolic syndrome was also highly correlated with the development of overall dementia, and the adjusted HR was significantly higher in VaD than in AD (HR 1.37 vs 1.14).
HRs for Developing Dementia According to Obesity Status and Metabolic Syndrome Criteria
| Criteria | Overall Dementia | AD | VaD | |||||
|---|---|---|---|---|---|---|---|---|
| n | Adjusted HRa (95% CI) | n | Adjusted HRa (95% CI) | n | Adjusted HRa (95% CI) | |||
| Obesityb | ||||||||
| No (n = 3,590,919) | 249,879 | 1 (reference) | 184,658 | 1 (reference) | 28,936 | 1 (reference) | ||
| Yes (n = 2,078,569) | 114,053 | 0.90 (0.89–0.91) | 82,710 | 0.88 (0.87–0.89) | 14,982 | 1.01 (0.99–1.03) | ||
| High BPc | ||||||||
| No (n = 1,737,573) | 86,464 | 1 (reference) | 65,197 | 1 (reference) | 8,800 | 1 (reference) | ||
| Yes (n = 3,931,915) | 277,468 | 1.10 (1.09–1.11) | 202,171 | 1.05 (1.04–1.06) | 35,118 | 1.44 (1.41–1.48) | ||
| Hyperglycemiad | ||||||||
| No (n = 3,053,488) | 178,572 | 1 (reference) | 132,326 | 1 (reference) | 20,711 | 1 (reference) | ||
| Yes (n = 2,616,000) | 185,360 | 1.21 (1.20–1.22) | 135,042 | 1.19 (1.18–1.20) | 23,207 | 1.30 (1.28–1.33) | ||
| High TGe | ||||||||
| No (n = 3,807,141) | 238,245 | 1 (reference) | 175,715 | 1 (reference) | 28,040 | 1 (reference) | ||
| Yes (n = 1,862,347) | 125,687 | 1.07 (1.06–1.08) | 91,653 | 1.06 (1.05–1.07) | 15,878 | 1.15 (1.13–1.17) | ||
| Low HDL-Cf | ||||||||
| No (n = 4,059,350) | 239,860 | 1 (reference) | 175,794 | 1 (reference) | 29,029 | 1 (reference) | ||
| Yes (n = 1,610,138) | 124,072 | 1.08 (1.07–1.09) | 91,574 | 1.07 (1.06–1.08) | 14,889 | 1.16 (1.14–1.18) | ||
| Metabolic syndromeg | ||||||||
| No (n = 2,382,521) | 127,213 | 1 (reference) | 94,594 | 1 (reference) | 14,188 | 1 (reference) | ||
| Yes (n = 3,286,967) | 236,719 | 1.18 (1.17–1.19) | 172,774 | 1.14 (1.13–1.15) | 29,730 | 1.37 (1.35–1.40) | ||
Values with statistical significance are bold.
Adjusted for age, sex, tobacco and alcohol use, exercise, and socioeconomic status.
BMI ≥25 kg/m2.
Systolic BP ≥130 mm Hg or diastolic BP ≥85 mm Hg or on antihypertensive medication.
Fasting plasma glucose 100 mg/dL or on antidiabetic medication.
TG ≥150 mg/dL.
HDL-C <40 mg/dL in men or <50 mg/dL in women.
Meet two or more metabolic syndrome criteria.
Supplemental analyses
A sensitivity analysis (exclusion of underweight subjects with BMI <18.5 kg/m2) revealed that the MHO group showed lower risks of overall dementia and AD but lost statistical significance in VaD (Table 5). However, the risk of dementia was higher in the MUO group, whereas it was lower in the MUNO group, suggesting that being underweight contributes significantly to the development of dementia.
Sensitivity Analysis for the Development of Dementia After Exclusion of Underweight Subjects
| Group | Incident Cases, n | Person-Years, n | Incident Ratea | Model 1b | Model 2c | Model 3d |
|---|---|---|---|---|---|---|
| Overall dementia | ||||||
| MHNO | 88,406 | 8,401,410 | 10.5 | 1 (reference) | 1 (reference) | 1 (reference) |
| MUNO | 141,267 | 9,128,208 | 15.5 | 1.11 (1.10–1.12) | 1.07 (1.06–1.08) | 1.07 (1.06–1.08) |
| MHO | 27,675 | 3,364,116 | 8.2 | 0.78 (0.77–0.79) | 0.88 (0.87–0.89) | 0.88 (0.88–0.90) |
| MUO | 86,378 | 7,409,687 | 11.7 | 1.47 (1.46–1.49) | 1.21 (1.20–1.22) | 1.21 (1.20–1.22) |
| AD | ||||||
| MHNO | 65,867 | 8,401,410 | 7.8 | 1 (reference) | 1 (reference) | 1 (reference) |
| MUNO | 103,566 | 9,128,208 | 11.3 | 1.08 (1.06–1.09) | 1.03 (1.02–1.04) | 1.03 (1.02–1.04) |
| MHO | 20,254 | 3,364,116 | 6.0 | 0.77 (0.76–0.78) | 0.86 (0.85–0.88) | 0.87 (0.86–0.88) |
| MUO | 62,456 | 7,409,687 | 8.4 | 1.45 (1.44–1.47) | 1.18 (1.17–1.19) | 1.17 (1.16–1.19) |
| VaD | ||||||
| MHNO | 9643 | 8,401,410 | 1.2 | 1 (reference) | 1 (reference) | 1 (reference) |
| MUNO | 17,282 | 9,128,208 | 1.9 | 1.35 (1.32–1.39) | 1.34 (1.30–1.38) | 1.35 (1.31–1.38) |
| MHO | 3487 | 3,364,116 | 1.0 | 0.90 (0.87–0.94) | 1.01 (0.97–1.05) | 1.03 (0.99–1.07) |
| MUO | 11,495 | 7,409,687 | 1.6 | 1.65 (1.61–1.69) | 1.42 (1.39–1.46) | 1.42 (1.38–1.45) |
Values with statistical significance are bold.
Incident rate for 1000 person-years.
Unadjusted.
Adjusted for age and sex.
Further adjusted for tobacco and alcohol use, exercise, socioeconomic status, LDL-C.
Similar patterns were noted for subjects aged 50 to 60 years (n = 6,627,375), although the protective effect of the MHO phenotype on overall dementia was smaller than that in subjects aged >60 years (Tables 6 and 7). Additionally, the MUO group of subjects aged 50 to 60 years showed a much higher risk of VaD than those aged >60 years (HR 1.71 vs 1.33), suggesting that metabolic abnormalities have a greater impact on the incidence of dementia in middle-aged patients.
Baseline Characteristics of Study Subjects According to Metabolic Health and Obesity in Subjects Aged 50 to 60 Years
| Characteristic | Nonobese (n = 4,270,579) | Obese (n = 2,356,796) | ||
|---|---|---|---|---|
| MHNO (n = 3,282,724) | MUNO (n = 987,855) | MHO (n = 1,024,260) | MUO (n = 1,332,536) | |
| Age, y | 53.5 ± 3.3 | 54.6 ± 3.4 | 53.7 ± 3.3 | 54.4 ± 3.4 |
| Male sex | 1,468,731 (44.7) | 454,427 (46.0) | 546,028 (53.3) | 695,994 (52.2) |
| Height, cm | 161.5 ± 8.0 | 161.6 ± 8.2 | 161.9 ± 8.4 | 162.3 ± 8.7 |
| Weight, kg | 58.1 ± 7.6 | 60.4 ± 7.5 | 70.2 ± 8.0 | 72.9 ± 9.2 |
| BMI, kg/m2 | 22.2 ± 1.8 | 23.1 ± 1.5 | 26.78 ± 1.7 | 27.6 ± 2.2 |
| Systolic BP, mm Hg | 119.5 ± 14.1 | 128.9 ± 14.8 | 123.3 ± 13.8 | 131.0 ± 14.6 |
| Diastolic BP, mm Hg | 74.9 ± 9.7 | 80.2 ± 10.0 | 77.4 ± 9.6 | 81.8 ± 9.9 |
| Fasting glucose, mg/dL | 94.9 ± 19.1 | 112.8 ± 34.7 | 95.3 ± 17.2 | 111.8 ± 31.4 |
| Total cholesterol, mg/dL | 200.0 ± 34.5 | 205.9 ± 43.8 | 204.2 ± 34.2 | 206.4 ± 41.5 |
| TG, mg/dL | 98.1 ± 17.2 | 161.2 ± 18.9 | 109.8 ± 18.2 | 169.4 ± 18.8 |
| HDL-C, mg/dL | 58.3 ± 15.7 | 51.1 ± 16.2 | 55.6 ± 15.4 | 49.6 ± 15.8 |
| LDL-C, mg/dL | 119.9 ± 31.9 | 118.9 ± 41.1 | 124.5 ± 31.8 | 119.5 ± 38.9 |
| Current smoker | 675,096 (20.6) | 222,377 (22.5) | 186,371 (18.2) | 273,367 (20.5) |
| Heavy drinker | 174,917 (5.3) | 74,104 (7.5) | 67,816 (6.6) | 117,302 (8.8) |
| Exercise | 1,688,721 (51.4) | 490,834 (49.7) | 540,187 (52.7) | 658,377 (49.4) |
| Low socioeconomic status | 723,132 (22.0) | 227,418 (23.0) | 215,868 (21.1) | 299,117 (22.5) |
| Comorbidities | ||||
| Hypertension | 569,118 (17.3) | 541,839 (54.9) | 256,199 (25.0) | 821,072 (61.6) |
| Diabetes | 154,171 (4.7) | 256,067 (25.9) | 48,092 (4.7) | 341,823 (25.7) |
| Hyperlipidemia | 458,779 (14.0) | 539,040 (54.6) | 155,503 (15.2) | 638,897 (48.0) |
| CKD | 111,024 (3.4) | 52,927 (5.4) | 36,746 (3.6) | 70,943 (5.3) |
| Previous myocardial infarction | 40,662 (1.2) | 40,868 (4.1) | 14,702 (1.4) | 55,136 (4.1) |
| Previous ischemic stroke | 41,234 (1.3) | 35,804 (3.6) | 14,855 (1.4) | 45,748 (3.4) |
Values are presented as mean (SD) for continuous variables and n (%) for categorical variables.
HRs for the Development of Dementia According to Metabolic Health and Obesity Status in Subjects Aged 50 to 60 Years
| Group | Incident Cases, n | Person-Years, n | Incident Ratea | Model 1b | Model 2c | Model 3d |
|---|---|---|---|---|---|---|
| Overall dementia | ||||||
| MHNO | 12,678 | 17,056,868 | 0.7 | 1 (reference) | 1 (reference) | 1 (reference) |
| MUNO | 6611 | 5,171,781 | 1.3 | 1.38 (1.34–1.43) | 1.19 (1.16–1.23) | 1.19 (1.16–1.23) |
| MHO | 3601 | 5,356,227 | 0.7 | 0.90 (0.87–0.94) | 0.88 (0.85–0.91) | 0.90 (0.87–0.93) |
| MUO | 7188 | 6,962,901 | 1.0 | 1.71 (1.66–1.76) | 1.42 (1.28–1.46) | 1.41 (1.37–1.45) |
| AD | ||||||
| MHNO | 7903 | 17,056,868 | 0.5 | 1 (reference) | 1 (reference) | 1 (reference) |
| MUNO | 3967 | 5,171,781 | 0.8 | 1.31 (1.26–1.36) | 1.11 (1.07–1.16) | 1.11 (1.07–1.16) |
| MHO | 2184 | 5,356,227 | 0.4 | 0.88 (0.84–0.92) | 0.86 (0.82–0.90) | 0.88 (0.83–0.92) |
| MUO | 4252 | 6,962,901 | 0.6 | 1.65 (1.58–1.71) | 1.33 (1.28–1.38) | 1.33 (1.28–1.38) |
| VaD | ||||||
| MHNO | 2437 | 17,056,868 | 0.1 | 1 (reference) | 1 (reference) | 1 (reference) |
| MUNO | 1467 | 5,171,781 | 0.3 | 1.72 (1.61–1.83) | 1.52 (1.43–1.62) | 1.53 (1.44–1.63) |
| MHO | 769 | 5,356,227 | 0.1 | 1.00 (0.92–1.08) | 0.97 (0.89–1.05) | 0.99 (0.92–1.08) |
| MUO | 1713 | 6,962,901 | 0.2 | 1.98 (1.85–2.11) | 1.73 (1.62–1.84) | 1.71 (1.60–1.82) |
Values with statistical significance are bold.
Incident rate for 1000 person-years.
Unadjusted.
Adjusted for age and sex.
Further adjusted for tobacco and alcohol use, exercise, socioeconomic status, and LDL-C.
Discussion
In this longitudinal nationwide study, we analyzed the risk of incident dementia according to late-life metabolic health and obesity status. Among the four groups, MHO subjects showed the lowest incidences of overall dementia and AD but were no different in the development of VaD. Furthermore, the protective effect of the MHO phenotype on AD was maintained in both high-risk and low-risk groups, excluding underweight subjects, and in middle-age subjects, although the degree was different. Unhealthy metabolic profiles were positively associated with incident dementia, particularly VaD, and obesity was associated with a lower risk of developing AD.
With respect to the impact of metabolic status on dementia, our study revealed that having two or more metabolic abnormalities was associated with development of both AD and VaD. This effect was more prominent in VaD, with a 41% greater risk in MUNO subjects compared with MHNO subjects and a 31% greater risk in MUO subjects compared with MHO subjects. Furthermore, all criteria for metabolic syndrome (high BP, hyperglycemia, high TG, and low HDL-C) were associated with a higher risk of incident dementia.
Hypertension is reported to increase the risk of incident VaD 2.0- to 4.6-fold in female subjects, but the HR in male subjects was not statistically significant (28, 29). However, a meta-analysis of six longitudinal studies demonstrated that hypertension is associated with VaD (odds ratio 1.59; 95% CI, 1.29 to 1.95) (30). Our findings indicate that high BP is associated with VaD (HR 1.44; 95% CI, 1.41 to 1.48). DM is also a well-known risk factor for incident dementia, increasing risk 1.5- to 2.0-fold; the impact was evident in the development of VaD, showing an HR of 2.0 to 2.5, but its relationship to AD was not consistent (31–34). In our study, hyperglycemia increased the risk of overall dementia and AD 1.2-fold and raised the risk of VaD 1.3-fold. The impact on VaD was less than expected, probably because we defined hyperglycemia as including both prediabetes and diabetes (either fasting plasma glucose ≥100 mg/dL or on antidiabetic treatment), whereas previous studies were conducted only in patients with diabetes. Regarding hyperlipidemia and dementia, the published findings are inconsistent (34–37). However, in our large-scale analyses, both high TG and low HDL-C were associated with a 6% to 16% higher risk of dementia. The inconsistent results may be explained by differences in study design, such as age or ethnicity of subjects, and different definitions of hyperlipidemia.
Previous studies investigating the association between obesity and the development of dementia reported that midlife obesity was associated with a 1.7- to 2.0-fold higher risk of incident dementia (12, 38). In contrast, most recent studies revealed that being overweight or obese in old age is protective for dementia development (13, 14, 39–41). Regarding mortality, overweight subjects with AD showed a longer survival compared with those with normal weight (42). Our study results are in line with previous study results showing significant risk reduction of AD in old subjects who are obese. These results are consistent with the hypothesis of the “obesity paradox,” in which overweight or subjects who are obese are predicted to have lower mortality than normal weight subjects in various established disease cohorts (43–45). When we further analyzed the effect of metabolic health and obesity status on the development of dementia in subjects aged 50 to 60 years, the MHO group consistently demonstrated the lowest incidence of overall dementia and AD but to a lesser extent than that in subjects aged ≥60 years. In addition, when underweight subjects were excluded from the analysis, the risk of dementia increased in the MUO group, whereas the risk in the MUNO group decreased, suggesting that being underweight had a great impact on the incidence of dementia.
Several possible mechanisms explain the beneficial role of the MHO phenotype in development of dementia. First, unintentional weight loss in older adults is usually associated with malnutrition and coexisting chronic diseases (46). Actually, many studies have demonstrated that weight loss precedes the diagnosis of dementia by 10 years (47, 48). Second, plasma IGF-1 levels decline in the underweight group (49). By exerting neurotrophic activities in the hippocampus, IGF-1 is associated with better cognitive performance (50), and decreased serum IFG-1 levels turned out to be an independent risk factor for AD and VaD (51). Third, adipokines secreted from adipose tissue may play a role (52). A higher circulating leptin level is associated with a higher cerebral brain volume, including the hippocampus, and is inversely correlated with cognitive impairment and incident dementia (53, 54). Fourth, persistent organic pollutants (POPs) such as polychlorinated biphenyls and polychlorinated dibenzofurans have been reported to cause various toxic effects, especially in neurocognitive function (55, 56). Exposure to POPs was associated with dose-dependent deterioration of attention, memory, and learning ability (57, 58), which suggests potential links to dementia. Because POPs are usually lipophilic and are distributed in adipose tissue, serum concentrations increase after weight loss, with redistribution to tissues such as brain (59).
Our study has several limitations. First, dementia and other comorbidities were identified from claim data in the NHIS database. There is a possibility of coding errors or underestimation or overestimation. To avoid overestimation and to raise diagnostic accuracy, we defined dementia by using both ICD-10 codes and history of prescription antidementia drugs. The incidence rate of overall dementia (12.5 per 1000 person-years) reported in this study is consistent with the rates reported in previous studies in China, Japan, and Europe (60–62), which raises the reliability of our study. Second, BMI or metabolic status can change over time in a substantial proportion of the population; however, our study did not reflect longitudinal changes in body weight or laboratory findings. Third, because the mean BMI of the MHO group was 27.0 kg/m2, the study results may not be generalizable to a more severely obese group. Fourth, despite this longitudinal study design, our findings cannot be used to make causal inferences. Additional prospective are needed to determine metabolic health and obesity status as predisposing factors for dementia. Fifth, information about the apolipoprotein E4 phenotype, educational level, vitamin B12 and vitamin D status, and thyroid function test was not available. Despite these limitations, this study investigated the risk of incident dementia among different metabolic phenotypes in older adults. We analyzed a nationwide population over 29,089,304 person-years of follow-up. The large sample size provided statistical power to demonstrate associations between metabolic health and obesity status and dementia.
In summary, the current study illustrated different risks for dementia according to metabolic health and obesity status in late life in an Asian population-based cohort. The MHO phenotype showed a 13% to 15% lower risk of overall dementia and AD, compared with the MHNO phenotype, but no difference in the incidence of VaD. Increased dementia incidence in the metabolically unhealthy groups was more prominent in VaD, and risk reduction in obese groups was evident in AD. Additional studies in other populations are warranted to elucidate the effect of metabolic health status and obesity on dementia.
Acknowledgments
The authors thank Dong-Su Jang (medical illustrator, Medical Research Support Section, Yonsei University College of Medicine, Seoul, Republic of Korea) for his help with the illustrations and Caron Modeas (North Carolina State University) for providing English editorial assistance.
Financial Support: This research was supported by a grant from the Basic Science Research Program through a National Research Foundation of Korea grant, funded by the Ministry of Science and ICT (NRF-2016R1A5A1010764, to Y.H.L.), and an Institute for Information & Communications Technology Promotion grant, funded by the Korean government (no. 2017-0-01779, “A Machine Learning and Statistical Inference Framework for Explainable Artificial Intelligence,” to K.J.K.).
Author Contributions: J.Y.L., K.H., G.K., E.H., H.C., and Y.H.L. conceived and designed the study. K.H. had the main responsibility for statistical analysis, and J.Y.L., K.H., G.K., E.H., and Y.H.L. analyzed and interpreted the data. J.Y.L. and Y.H.L. drafted the manuscript, and all authors reviewed and commented on drafts for important intellectual content. All authors approved the final manuscript and the decision to submit for publication. Y.H.L. obtained the funding and is the guarantor of the study. Y.H.L. is the guarantor of this work and as such had full access to all the data in the study and takes responsibility for the integrity of the data and the accuracy of the data analysis.
Disclosure Summary: The authors have nothing to disclose.
Abbreviations:
- AD
Alzheimer’s disease
- ATP-III
Adult Treatment Panel III
- BMI
body mass index
- BP
blood pressure
- CKD
chronic kidney disease
- CVD
cardiovascular disease
- DM
diabetes mellitus
- HDL
high-density lipoprotein
- HR
hazard ratio
- ICD
International Classification of Diseases
- IQR
interquartile range
- LDL
low-density lipoprotein
- MA
Medical Aid
- MHNO
metabolically healthy nonobese
- MHO
metabolically healthy obese
- MUNO
metabolically unhealthy nonobese
- MUO
metabolically unhealthy obese
- NHI
National Health Insurance
- NHIS
National Health Insurance System
- POP
persistent organic pollutant
- TG
triglyceride
- VaD
vascular dementia
