


Abstract
Impaired fasting glucose (IFG) and impaired glucose tolerance (IGT) are highly pathophysiologic heterogeneous prediabetes conditions that can occur in all age groups, from youth to elderly people.
We evaluated whether distinct age-related phenotypes exist among individuals with IFG or IGT.
479 young (aged 18 to 35 years), 699 adult (45 to 55 years) and 240 older (≥65 years) subjects underwent an oral glucose tolerance test (OGTT). From the OGTT results, the participants were grouped as follows: young age and normal glucose tolerance (NGT), adult age and NGT, older age and NGT, IFG young subjects, IFG adult subjects, IFG older subjects, IGT young (Y-IGT) subjects, IGT adult (A-IGT) subjects, and IGT older (O-IGT) subjects.
Insulin sensitivity and secretion, insulin clearance, and β-cell function.
Peripheral insulin sensitivity assessed using the Matsuda index, basal and glucose-stimulated insulin secretion, and β-cell function estimated using the disposition index were decreased in IFG adult subjects and IFG older subjects compared with IFG young subjects. A-IGT and Y-IGT subjects exhibited a progressively greater degree of hepatic insulin resistance assessed using the liver insulin resistance index, and reduced insulin clearance compared with O-IGT subjects. In contrast, the Matsuda index did not differ among Y-IGT, A-IGT, and O-IGT subjects. Basal and glucose-stimulated insulin secretion and β-cell function were lower in A-IGT and O-IGT subjects compared with Y-IGT individuals.
Subjects with IFG or IGT exhibited different age-related pathophysiologic characteristics. A more precise phenotyping of subjects with IGT or IFG could help to better design individualized preventive approaches to counteract diabetes progression.
The prevalence of type 2 diabetes and prediabetes conditions [i.e., impaired glucose tolerance (IGT) and impaired fasting glucose (IFG)] has been continuously increasing worldwide, mostly due to unmodifiable and modifiable factors, including global population aging, unhealthy diets, and sedentary lifestyles (1–3). It is widely known that aging is associated with a progressive decline in glucose tolerance, resulting in an increased prevalence of prediabetes and type 2 diabetes in elderly populations (4–9).
In contrast, during the past 3 decades, an alarming increase in the occurrence of prediabetes conditions and type 2 diabetes has been observed among young subjects as a consequence of a progressive diffusion of obesity among children and adolescents (10–14). Recently, it was reported that overweight/obese youth with IGT have greater insulin secretion and reduced insulin sensitivity compared with overweight/obese adults (15, 16), in line with previous observations indicating the negative effect of aging on β-cell function (6, 17). However, puberty is a state transiently associated with reduced insulin sensitivity (18), and whether these age-related pathophysiological disparities among subjects with IGT hold true in young, middle age, and older people across a wide range of body weights remains unsettled.
The aim of the present study was, therefore, to evaluate whether different age-related metabolic characteristics exist among adults with normal glucose tolerance (NGT), isolated IFG, and IGT, to gain insights into the potential pathophysiological mechanisms implicated in the development of dysglycemic conditions.
Materials and Methods
The CATAMERI (Catanzaro metabolic risk factors) study is an ongoing observational study recruiting individuals aged ≥18 years (upper age limit: <90 years) with one or more cardiometabolic risk factors, including elevated blood pressure, dyslipidemia, dysglycemia, overweight/obesity, and a family history of type 2 diabetes (19–21). To date, 5070 individuals have been recruited. For the present study, those subjects aged 36 to 44 or 56 to 64 years and those with missing data for the oral glucose tolerance test (OGTT)-derived insulin sensitivity and secretion indexes were excluded. Thus, we analyzed the data from a cohort of 1418 subjects, including 479 young (age: 18 to 35 years), 699 adult (age: 45 to 55 years), and 240 older (age: ≥65 years) individuals. All participants underwent a complete medical history and physical examination, including measurement of body mass index (BMI), waist circumference, and body composition evaluated using bioelectrical impedance. After an overnight fast, each study participant underwent a 75-g OGTT with 0-, 30-, 60-, 90-, and 120-minute sampling for plasma glucose and insulin assay. From the OGTT data, the individuals were classified as having NGT when the fasting plasma glucose was <100 mg/dL and the 2-hour postload glucose was <140 mg/dL, isolated IFG when the fasting plasma glucose was 100 to 125 mg/dL and the 2-hour postload glucose was <140 mg/dL, and IGT when the fasting plasma glucose was <126 mg/dL and the 2-hour postload glucose was 140 to 199 mg/dL, in accordance with the American Diabetes Association criteria (1).
The hospital ethical committee (Comitato Etico Azienda Ospedaliera “Mater Domini”) approved the study protocol, and each study participant gave written informed consent to be enrolled in the study in accordance with principles of the Declaration of Helsinki.
Analytical determinations
Glucose, triglycerides, and total and high-density lipoprotein (HDL) cholesterol levels were measured using enzymatic methods (Roche, Basel, Switzerland). Serum insulin concentrations were assessed using a chemiluminescence-based assay (Immulite®, Siemens, Milan, Italy). Glycated hemoglobin (HbA1c) was determined using high performance liquid chromatography and a National Glycohemoglobin Standardization Program–certified automated analyzer (Adams HA-8160 HbA1C analyzer; Menarini, Florence, Italy).
Calculations
The weight-adjusted-waist index, a measure of adiposity, was calculated as the waist circumference (in cm) divided by the square root of weight (kg) (cm/√kg), as previously described (22).
Different surrogate measures of insulin sensitivity were computed. The liver insulin resistance (IR) index was calculated using the formula: −0.091 + (log insulin area under the curve [AUC] 0 to 120 minutes × 0.400) + (log fat mass percentage × 0.346) − (log HDL cholesterol × 0.408) + (log BMI × 0.435) (23). The Matsuda index was calculated as follows: 10,000/square root of (fasting glucose × fasting insulin) × (mean glucose × mean insulin during OGTT) (24). The fasting C-peptide/insulin ratio was calculated to estimate insulin clearance, as previously reported (25).
Basal insulin secretion was assessed using homeostasis model assessment of β-cell function (HOMA-β) index: calculated as 20 × fasting insulin/fasting glucose − 3.5 (26). The incremental AUC of insulin was divided by the incremental AUC of glucose during the 0- to 30-minutes of the OGTT as a measure of early insulin secretion (27). Total insulin secretion was estimated by the InsAUC0–120/GlucAUC0–120, which was calculated by dividing the incremental insulin AUC by the incremental glucose AUC during the 0- to 120-minute period of the OGTT (21). To evaluate β-cell function, the so-called disposition index was calculated as follows: InsAUC0–30/GlucAUC0–30 × Matsuda index (28).
Statistical analysis
Data for continuous variables are presented as mean ± SD. Given their skewed distribution, triglycerides, HDL, fasting C-peptide, fasting and postload insulin, fasting C-peptide/insulin ratio, InsAUC0–30/GlucAUC0–30, and InsAUC0–120/GlucAUC0–120 were natural log transformed for statistical analysis. Categorical variables were compared using the χ2 test. Differences in clinical parameters among the study groups were tested using a general linear model with post hoc Fisher least significant difference correction for pairwise comparisons. To estimate the interaction between age and glucose tolerance status on glucose homeostasis parameters, we performed a multivariate linear regression analysis in a model that included age, glucose tolerance status, and their interaction term, in addition to sex and BMI. We considered a two-sided P value ≤ 0.05 to indicate statistical significance. The described statistical analyses were performed using the SPSS software program, version 20 (IBM Corp., Armonk, NY).
Sample size calculation was performed using the G*power 3.1.9.2 program. The study had 80% power for an α of 0.05 to detect 15% to 20% differences in pathophysiological abnormalities among the study groups.
Results
Demographic and anthropometric characteristics in young, adult, and older subjects with NGT, IFG, or IGT
The demographic and anthropometric characteristics of the study cohort are reported in Table 1. Of the 1418 nondiabetic individuals, 908 (64%) were classified as NGT, 183 (12.9%) as IFG, and 327 (23%) as IGT. The study participants were grouped according to age and glucose tolerance as follows: (i) young age and NGT (n = 408; Y-NGT), (ii) adult age and NGT (n = 406; A-NGT), (iii) older age and NGT (n = 94; O-NGT), (iv) young age and isolated IFG (n = 28; Y-IFG), (v) adult age and isolated IFG (n = 107; A-IFG), (vi) older age and isolated IFG (n = 48; O-IFG), (vii) young age and IGT (n = 43; Y-IGT), (viii) adult age and IGT (n = 186; A-IGT), and (ix) older age and IGT (n = 98; O-IGT).
Clinical Characteristics of Study Population Subdivided by Age and Glucose Tolerance
| Characteristic | NGT | IFG | IGT | |||||||||
|---|---|---|---|---|---|---|---|---|---|---|---|---|
| Young | Adult | Older | P Value | Young | Adult | Older | P Value | Young | Adult | Older | P Value | |
| Sex | 0.01 | 0.91 | 0.01 | |||||||||
| Male | 139 | 167 | 46 | 17a | 63b | 30 | 14c | 106b | 50 | |||
| Female | 269 | 239 | 48 | 11a | 44b | 18 | 29c | 80b | 48 | |||
| Age, y | 27 ± 5 | 50 ± 3 | 71 ± 5 | 0.0001 | 29 ± 6 | 50 ± 3 | 70 ± 4 | 0.0001 | 29 ± 5 | 50 ± 3 | 71 ± 5 | 0.0001 |
| Family history of type 2 diabetes | 132 (32) | 137 (34) | 15 (16) | 0.09 | 7 (25) | 35 (33) | 17 (35)d | 0.63 | 17 (40)e | 79 (43)f | 29 (30)d | 0.10 |
| BMI, kg/m2 | 27.6 ± 5.6 | 28.6 ± 4.5 | 28.3 ± 4.4 | 0.02g | 28.1 ± 5 | 29.1 ± 4 | 29.4 ± 4 | 0.05g | 30.3 ± 4.7c,h | 30.2 ± 4.1i,j | 29.8 ± 3.9d | 0.56g |
| Weight | 0.0001 | 0.02 | 0.44 | |||||||||
| Normal weight | 151 | 83 | 24 | 11 | 18 | 4 | 7a,c | 15i,k | 11d | |||
| Overweight | 96 | 181 | 38 | 9 | 53 | 27 | 16a,c | 76i,k | 44d | |||
| Obese | 161 | 142 | 32 | 8 | 36 | 17 | 20a,c | 95i,k | 43d | |||
| Waist circumference, cm | 92 ± 15 | 97 ± 12 | 100 ± 10 | 0.0001g | 93 ± 14 | 98 ± 10 | 102 ± 8 | 0.001g | 99 ± 13h,l | 103 ± 11i,k | 102 ± 10 | 0.37g |
| WWI, cm/√kg | 10.4 ± 0.9 | 10.9 ± 0.8 | 11.7 ± 0.8 | 0.0001g | 10.4 ± 0.8 | 10.9 ± 0.6 | 11.7 ± 0.7 | 0.001g | 10.8 ± 0.8c,h | 11.2 ± 0.6i,j | 11.8 ± 0.7d | 0.01g |
| Fat body mass, % | 31.4 ± 10 | 31.7 ± 9 | 36.5 ± 7 | 0.04g | 34.1 ± 13 | 34.6 ± 12 | 37.2 ± 8 | 0.05g | 34.4 ± 7 | 30.9 ± 8 | 32.9 ± 10 | 0.86g |
| Fat free mass, % | 68.6 ± 10 | 68.1 ± 10 | 63.3 ± 7 | 0.04g | 65.9 ± 13 | 65.3 ± 12 | 62.8 ± 8 | 0.05g | 65.5 ± 8 | 69.0 ± 8 | 67.1 ± 10 | 0.84g |
| Total cholesterol, mg/dL | 179 ± 34 | 200 ± 39 | 205 ± 39 | 0.0001 | 191 ± 39e | 211 ± 33f | 208 ± 39 | 0.04 | 195 ± 36a | 200 ± 36 | 195 ± 41 | 0.24 |
| HDL cholesterol, mg/dL | 50 ± 10 | 49 ± 10 | 51 ± 9 | 0.13 | 49 ± 10 | 49 ± 11 | 51 ± 17 | 0.41 | 51 ± 14 | 49 ± 16 | 51 ± 11 | 0.611 |
| Triglycerides, mg/dL | 93 ± 48 | 109 ± 39 | 117 ± 52 | 0.0001 | 132 ± 79e | 138 ± 72f | 146 ± 80d | 0.05 | 126 ± 50h | 138 ± 51i | 130 ± 53d | 0.22 |
Data presented as mean ± SD or n (%). Triglycerides and HDL cholesterol levels were log transformed for statistical analysis; however, values in Table 1 represent back transformation to the original scale. Categorical variables were compared using the χ2 test. Comparisons between study groups were performed using a general linear model for multiple comparisons. P values refer to results after analysis with adjustment for sex and BMI.
Abbreviation: WWI, weight-adjusted-waist index.
P < 0.01 vs Y-NGT.
P < 0.01 vs A-NGT.
P < 0.05 vs Y-IFG.
P < 0.05 vs O-NGT.
P < 0.05 vs Y-NGT.
P < 0.05 vs A-NGT.
P values refer to results after analyses with adjustment for sex.
P < 0.001 vs Y-NGT.
P < 0.001 vs A-NGT.
P < 0.05 vs A-IFG.
P < 0.01 vs A-IFG.
P < 0. 01 vs Y-IFG.
Within the individuals with NGT or IFG, we observed a progressive increase in adiposity measures, including BMI, waist circumference, weight-adjusted-waist index, and fat body mass and a graded decrease in the fat free mass with aging. In contrast, no difference in BMI, waist circumference, fat mass, or free fat mass was found among the 3 groups with IGT (Table 1).
Glucose and insulin concentrations during OGTT in young, adult, and older subjects with NGT
The levels of HbA1c and the fasting and postload glucose were progressively increased in the A-NGT and O-NGT individuals compared with those in the Y-NGT group (Table 2; Fig. 1A). Compared with the Y-NGT subjects, the A-NGT and O-NGT individuals displayed a graded decrease in the fasting and 30-minute postload insulin concentrations and progressively augmented 60- and 90- minute postload insulin levels (Table 2; Fig. 1B).
Glucose Homeostasis Parameters of Study Participants Stratified According to Age and Glucose Tolerance
| Parameter | NGT | IFG | IGT | |||||||||
|---|---|---|---|---|---|---|---|---|---|---|---|---|
| Young | Adult | Older | P Value | Young | Adult | Older | P Value | Young | Adult | Older | P Value | |
| HbA1c, % | 5.2 ± 0.4 | 5.4 ± 0.3 | 5.5 ± 0.4 | 0.0001 | 5.4 ± 0.4a | 5.6 ± 0.3b | 5.7 ± 0.3c | 0.02 | 5.3 ± 0.3a | 5.6 ± 0.4d | 5.7 ± 0.4e | 0.0001 |
| Fasting glucose, mg/dL | 84 ± 7 | 88 ± 7 | 89 ± 7 | 0.0001 | 105 ± 6f | 106 ± 6d | 108 ± 6g | 0.04 | 89 ± 10f,h | 98 ± 10d,i | 100 ± 11g,j | 0.0001 |
| 2-Hour postload glucose, mg/dL | 99 ± 20 | 106 ± 19 | 109 ± 19 | 0.0001 | 106 ± 19a | 113 ± 19b | 117 ± 15c | 0.05 | 157 ± 15f,h | 161 ± 15d,i | 165 ± 17g,j | 0.008 |
| IGT | NA | NA | NA | NA | NA | NA | NA | NA | 36 | 104 | 46 | 0.0001 |
| Combined IFG+IGT | NA | NA | NA | NA | NA | NA | NA | NA | 7 | 82 | 52 | 0.0001 |
| Fasting C peptide, ng/mL | 1.9 ± 0.9 | 1.8 ± 0.8 | 1.9 ± 0.7 | 0.32 | 2.0 ± 0.9 | 2.0 ± 0.8 | 2.1 ± 0.6 | 0.53 | 2.3 ± 0.9k,l | 2.3 ± 1.0d,m | 2.2 ± 0.9c | 0.75 |
| Fasting insulin, μU/mL | 13 ± 9 | 12 ± 7 | 11 ± 6 | 0.0001 | 16 ± 10a | 13 ± 8n | 12 ± 6 | 0.03 | 19 ± 10f | 15 ± 7b | 14 ± 10c | 0.005 |
| 2-Hour postload insulin, μU/mL | 67 ± 61 | 67 ± 51 | 78 ± 65 | 0.24 | 67 ± 52 | 78 ± 69 | 97 ± 63 | 0.02 | 192 ± 170f,h | 141 ± 114d,i | 127 ± 81g,o | 0.02 |
| Glucose AUC0–120 | 221 ± 39 | 250 ± 39 | 260 ± 38 | 0.0001 | 260 ± 46f | 290 ± 43d | 293 ± 42g | 0.01 | 308 ± 37f,h | 335 ± 43d,i | 344 ± 44g,j | 0.0001 |
| Insulin AUC0–120 | 150 ± 113 | 155 ± 101 | 166 ± 150 | 0.16 | 159 ± 105 | 167 ± 145 | 201 ± 91 | 0.006 | 261 ± 190f,h | 205 ± 159d,p | 189 ± 106c | 0.04 |
Data presented as mean ± SD. Fasting C-peptide, fasting and 2-hour postload insulin, and insulin AUC0–120 levels were log transformed for statistical analysis; however, values in the table represent back transformation to the original scale. Comparisons between the study groups were performed using a general linear model for multiple comparisons. P values refer to results after analyses with adjustment for sex and BMI.
P < 0.05 vs Y-NGT.
P < 0.01 vs A-NGT.
P < 0.05 vs O-NGT.
P < 0.001 vs A-NGT.
P < 0.01 vs O-NGT.
P < 0.001 vs Y-NGT.
P < 0.001 vs O-NGT.
P < 0.001 vs Y-IFG.
P < 0.001 vs A-IFG.
P < 0.001 vs O-IFG.
P < 0.01 vs Y-NGT.
P < 0.05 vs Y-IFG.
P < 0.05 vs A-IFG.
P < 0.05 vs A-NGT.
P < 0.05 vs O-IFG.
P < 0.01 vs A-IFG.
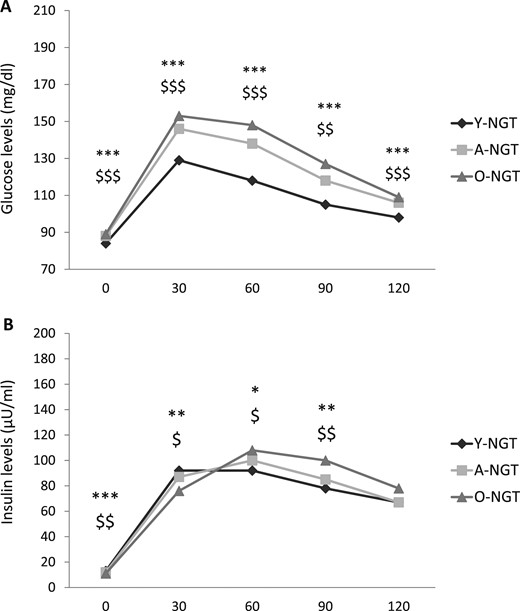
Plasma (A) glucose and (B) insulin levels during OGTT in young, adult, and older subjects with NGT. *P < 0.05, **P < 0.01, and ***P < 0.001 for O-NGT vs Y-NGT. $P < 0.05, $$P < 0.01, and $$$P < 0.001 for A-NGT vs Y-NGT.
Glucose and insulin concentrations during OGTT in young, adult, and older subjects with isolated IFG
Compared with Y-IFG individuals, the A-IFG and O-IFG subjects displayed a graded increase in HbA1c and fasting and postload glucose levels (Table 2; Fig. 2A). A progressive decrease in fasting plasma insulin was found in the A-IFG and O-IFG subjects compared with Y-IFG individuals. In contrast, the 60-, 90-, and 120-minute postload insulin and insulin AUC0–120 levels were progressively greater in the A-IFG and O-IFG subjects than in the Y-IFG subjects (Table 2; Fig. 2B).
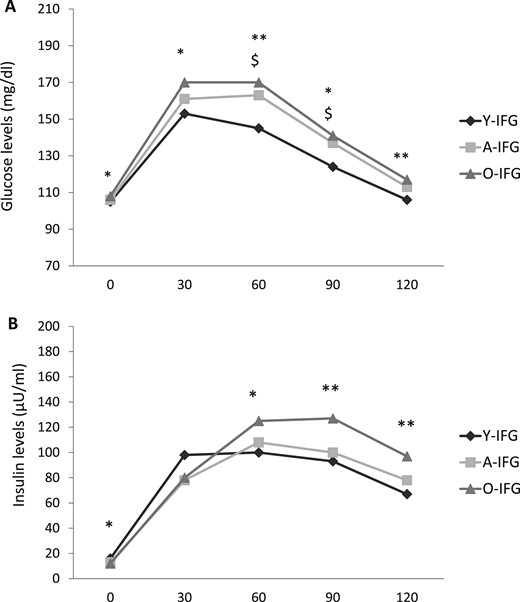
Plasma (A) glucose and (B) insulin levels during OGTT in young, adult, and older subjects with IFG. *P < 0.05, **P < 0.01 for O-NGT vs Y-NGT. $P < 0.05 for A-NGT vs Y-NGT.
Compared with their counterparts with NGT, the Y-IFG, A-IFG, and O-IFG subjects exhibited greater levels of HbA1c and fasting and postload glucose (Table 2) (29). The fasting plasma insulin was significantly greater in the Y-IFG and A-IFG subjects compared with their counterparts with NGT but not in the O-IFG group. No significant differences in the postload insulin levels were found between the IFG and NGT groups (Table 2) (29).
Glucose and insulin concentrations during OGTT in young, adult, and older subjects with IGT
Compared with the Y-IGT, the A-IGT and O-IGT subjects showed significantly greater HbA1c and fasting and postload glucose levels. Accordingly, a greater proportion of A-IGT and O-IGT subjects had combined IFG and IGT compared with the Y-IGT group (Table 2).
The A-IGT and O-IGT individuals exhibited reduced fasting and postload insulin concentrations compared with those of the Y-IGT subjects (Table 2; Fig. 3). Compared with their counterparts with NGT, the Y-IGT, A-IGT, and O-IGT subjects exhibited significantly greater levels of HbA1c and fasting and postload glucose and insulin levels (Table 2) (29).
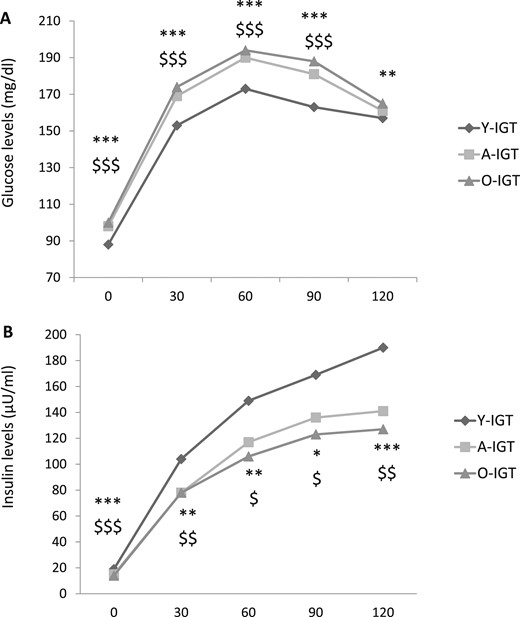
Plasma (A) glucose and (B) insulin levels during OGTT in young, adult, and older subjects with IGT. *P < 0.05, **P < 0.01, and ***P < 0.001 for O-NGT vs Y-NGT. $P < 0.05, $$P < 0.01, and $$$P < 0.001 for A-NGT vs Y-NGT.
Insulin sensitivity, insulin clearance, insulin secretion, and β-cell function in young, adult, and older subjects with NGT
Compared with the Y-NGT individuals, the A-NGT and O-NGT subjects exhibited progressively lower values of the Matsuda index of insulin sensitivity after adjustment for sex, BMI, and a family history for type 2 diabetes (Table 3; Fig. 4A). In contrast, no significant differences among the three groups were observed in hepatic insulin resistance, as estimated by the liver IR index (Table 3; Fig. 4B), and insulin clearance, as estimated using the fasting C-peptide/insulin ratio. Compared with the Y-NGT subjects, the A-NGT and O-NGT individuals showed a progressive decrease in basal insulin secretion assessed using the HOMA-β index and reduced glucose-stimulated early phase and total insulin secretion as estimated by InsAUC0–30/GluAUC0–30 and InsAUC0–120/GluAUC0–120, respectively (Table 3; Fig. 4C). To attain a more precise measure of β-cell function, we calculated the disposition index by multiplying the InsAUC0–30/GluAUC0–30 for insulin sensitivity estimated by the Matsuda index; thus, adjusting insulin secretion for the actual insulin sensitivity (28). Compared with the Y-NGT subjects, the A-NGT and O-NGT individuals displayed a graded decrease in β-cell function as measured by the disposition index (Table 3; Fig. 4D).
Indexes of Insulin Sensitivity, Insulin Clearance, Insulin Secretion, and β-Cell Function Stratified by Age and Glucose Tolerance
| Variable | NGT | IFG | IGT | |||||||||
|---|---|---|---|---|---|---|---|---|---|---|---|---|
| Young | Adult | Older | P Value | Young | Adult | Older | P Value | Young | Adult | Older | P Value | |
| Insulin sensitivity | ||||||||||||
| Liver IR index | 2.5 ± 0.5 | 2.5 ± 0.4 | 2.4 ± 0.4 | 0.65a | 2.6 ± 0.5 | 2.5 ± 0.3 | 2.6 ± 0.3b | 0.17a | 2.8 ± 0.4c,d | 2.7 ± 0.3e,f | 2.6 ± 0.3b | 0.05a |
| Matsuda index | 5.1 ± 0.1 | 4.7 ± 0.1 | 4.5 ± 0.2 | 0.04 | 4.1 ± 0.5 | 3.6 ± 0.8 | 2.9 ± 0.3 | 0.04 | 2.8 ± 0.3c,g | 2.8 ± 0.2e,h | 2.9 ± 0.2i | 0.91 |
| Insulin clearance | ||||||||||||
| Fasting C-peptide/insulin | 0.18 ± 0.12 | 0.18 ± 0.08 | 0.20 ± 0.08 | 0.17 | 0.16 ± 0.05 | 0.18 ± 0.09 | 0.19 ± 0.07 | 0.11 | 0.15 ± 0.10 | 0.17 ± 0.08 | 0.19 ± 0.06 | 0.05 |
| Insulin secretion | ||||||||||||
| HOMA-β | 204 ± 129 | 162 ± 98 | 151 ± 76 | 0.0001 | 130 ± 80c | 110 ± 67e | 99 ± 46i | 0.02 | 250 ± 161g,j | 155 ± 90f | 140 ± 92k,l | 0.0001 |
| InsAUC0–30/GluAUC0–30 | 8.7 ± 5.2 | 7.5 ± 4.8 | 6.7 ± 4.0 | 0.0001 | 7.6 ± 5.5 | 5.8 ± 3.4e | 6.6 ± 3.4 | 0.03 | 9.2 ± 4.3 | 6.2 ± 3.9e | 6.0 ± 3.7k | 0.0001 |
| InsAUC0–120/GlucAUC0-120 | 0.66 ± 0.45 | 0.62 ± 0.34 | 0.62 ± 0.52 | 0.02 | 0.61 ± 0.44 | 0.58 ± 0.43 | 0.70 ± 0.35 | 0.09 | 0.84 ± 0.52j | 0.61 ± 0.44 | 0.55 ± 0.31m | 0.004 |
| β-Cell function | ||||||||||||
| InsAUC0–30/GluAUC0–30 × Matsuda index | 34.8 ± 15.5 | 28.7 ± 15.3 | 24.8 ± 11.9 | 0.0001 | 21.7 ± 8.9c | 17.0 ± 7.0e | 17.1 ± 7.2i | 0.03 | 18.2 ± 6.9c,d | 14.5 ± 6.4e,n | 14.0 ± 6.6i,m | 0.01 |
Data presented as mean ± SD. Fasting C-peptide/insulin ratio, InsAUC0–30/GlucAUC0–30, InsAUC0–120/GlucAUC0–120, InsAUC0–30/GlucAUC0–30 × Matsuda index were log transformed for statistical analysis. Comparisons among the study groups were performed using a general linear model for multiple comparisons. P values refer to results after analyses with adjustment for sex, BMI, and family history of type 2 diabetes.
P values refer to results after analyses with adjustment for sex and family history for type 2 diabetes.
P < 0.01 vs O-NGT.
P < 0.001 vs Y-NGT.
P < 0.05 vs Y-IFG.
P < 0.001 vs A-NGT.
P < 0.001 vs A-IFG.
P < 0.001 vs Y-IFG.
P < 0.01 vs A-IFG.
P < 0.001 vs O-NGT.
P < 0.05 vs Y-NGT.
P < 0.05 vs O-NGT.
P < 0.05 vs O-IFG.
P < 0.01 vs O-IFG.
P < 0.05 vs A-IFG.
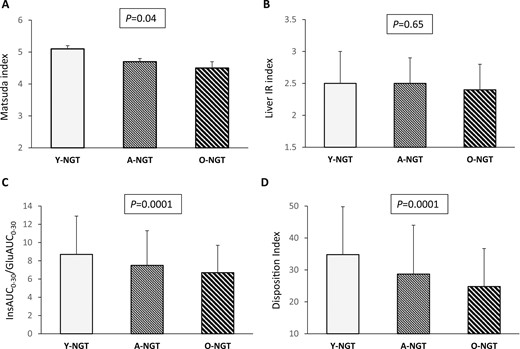
(A) Matsuda index, (B) liver IR index, (C) InsAUC0–30/GluAUC0–30, and (D) disposition index of β-cell function in young, adult, and older subjects with NGT. P values above the graphs refer to analysis of covariance analyses with adjustment for sex, BMI, and a family history of type 2 diabetes.
Insulin sensitivity, insulin clearance, insulin secretion, and β-cell function in young, adult, and older subjects with isolated IFG
After adjustment for sex, BMI, and family history for type 2 diabetes, the A-IFG and O-IFG subjects showed, compared with the Y-IFG group, a significant graded decrease in the Matsuda index of insulin sensitivity. However, no important difference was found in the liver IR index and insulin clearance among the three groups (Table 3; Fig. 5A and 5B). In contrast, the A-IFG and O-IFG subjects exhibited a significant decline in basal and glucose-stimulated early-phase insulin secretion and a reduction in β-cell function compared with the Y-IFG individuals (Table 3; Fig. 5C and 5D).
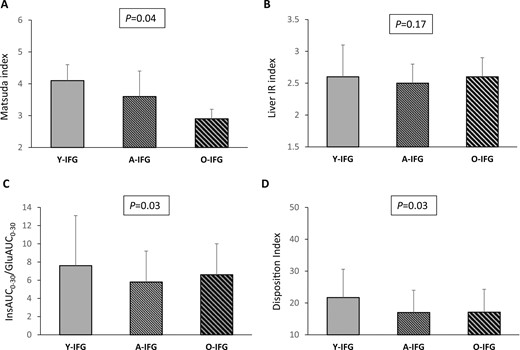
(A) Matsuda index, (B) liver IR index, (C) InsAUC0–30/GluAUC0–30, and (D) disposition index of β-cell function in young, adult, and older subjects with IFG. P values above the graphs refer to analysis of covariance analyses with adjustment for sex, BMI, and a family history of type 2 diabetes.
Insulin sensitivity, insulin clearance, insulin secretion, and β-cell function in young, adult, and older subjects with IGT
After adjustment for sex, BMI, and family history for type 2 diabetes, the values of the Matsuda index were not significantly different among the Y-IGT, A-IGT, and O-IGT groups (Table 3; Fig. 6A). In contrast, the A-IGT and Y-IGT groups exhibited progressively greater values of the liver IR index and reduced insulin clearance compared with the O-IGT individuals (Table 3; Fig. 6B). The basal and glucose-stimulated insulin secretion estimated using HOMA-β, InsAUC0–30/GluAUC0–30, and InsAUC0–120/GluAUC0–120 indexes were significantly lower in A-IGT and O-IGT subjects compared with the Y-IGT group. Accordingly, a reduction in β-cell function was observed in the A-IGT and O-IGT subjects compared with the Y-IGT individuals (Table 3; Fig. 6C and 6D). Moreover, the differences in the glucose homeostasis parameters observed among the three age groups of individuals with IGT were maintained even after adjustment for the fat mass percentage, in addition to sex and a family history of type 2 diabetes (29).
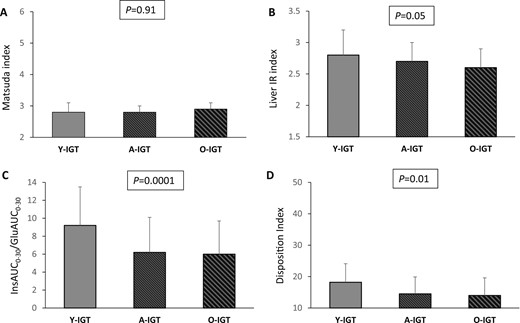
(A) Matsuda index, (B) liver IR index, (C) InsAUC0–30/GluAUC0–30, and (D) disposition index of β-cell function in young, adult, and older subjects with IGT. P values above the graphs refer to analysis of covariance analyses with adjustment for sex, BMI, and a family history of type 2 diabetes.
Interaction between age and glucose tolerance on glucose homeostasis measures
Next, to estimate the interaction between age and glucose tolerance status on glucose homeostasis parameters, we performed a multivariate linear regression analysis in a model that included age, glucose tolerance status, and their interaction term, in addition to sex and BMI. Age was associated positively with glucose AUC0–120 and negatively with basal and glucose-stimulated insulin secretion assessed by HOMA-β and InsAUC0–30/GluAUC0–30, and β-cell function independently of sex, BMI, and glucose tolerance (Table 4). Furthermore, we found a significant age-glucose tolerance interaction on glucose homeostasis parameters, including glucose and insulin AUC0–120, insulin sensitivity assessed using the Matsuda index, and β-cell function.
Multivariate Linear Regression Analysis of Interaction Between Age and Glucose Tolerance Status on Glucose Homeostasis Parameters
| Variable | Glucose AUC0–120 | Insulin AUC0–120 | Matsuda Index | Liver IR Index | HOMA β | InsAUC0–30/GluAUC0–30 | Disposition Index | |||||||
|---|---|---|---|---|---|---|---|---|---|---|---|---|---|---|
| β | P Value | β | P Value | β | P Value | β | P Value | β | P Value | β | P Value | β | P Value | |
| Age | 0.25 | 0.0001 | 0.01 | 0.91 | −0.04 | 0.155 | 0.01 | 0.84 | −0.14 | 0.0001 | −0.21 | 0.0001 | −0.26 | 0.0001 |
| Glucose tolerance | 0.83 | 0.0001 | 0.35 | 0.001 | −0.48 | 0.0001 | 0.41 | 0.001 | 0.12 | 0.24 | −0.22 | 0.02 | −0.74 | 0.0001 |
| Age × glucose tolerance | −0.25 | 0.0001 | −0.25 | 0.02 | 0.21 | 0.02 | −0.22 | 0.08 | −0.12 | 0.28 | 0.11 | 0.31 | 0.41 | 0.0001 |
Multivariate linear regression model, including age, glucose tolerance, and their interaction term as independent variables, in addition to sex and BMI.
Abbreviation: β, standardized coefficient β.
Discussion
It has been reported that subjects with type 2 diabetes diagnosed by increased fasting glucose concentrations or 2-hour postload glucose concentrations, or both, have distinct pathophysiologic abnormalities and natural histories (30–32). Likewise, IGT and IFG are highly heterogeneous dysglycemic conditions with respect to their pathogenesis and progression toward full diabetes (33). Recently, it was reported that overweight/obese youth with IGT will have greater insulin secretion and reduced insulin sensitivity compared with overweight/obese adults with IGT (15, 16). However, because obesity and pubertal transition are known to affect glucose homeostasis, it is not clear whether the reported metabolic contrasts between youth and adult subjects are dependent on age rather than the peripubertal-related changes in body composition and hormonal patterns.
In the present cross-sectional study performed on nondiabetic adult subjects, we found that A-IFG and O-IFG individuals exhibited lower insulin sensitivity and greater total insulin response after glucose ingestion compared with Y-IFG individuals. However, the A-IFG and O-IFG individuals showed reduced basal and glucose-stimulated early-phase insulin secretion and impaired β-cell function measured by the disposition index compared with Y-IFG individuals, indicating a compromised ability to compensate for reduced peripheral insulin sensitivity. Thus, these data suggest that individuals with IFG arrive at a similar dysglycemic condition via divergent age-dependent changes.
Next, we observed that peripheral insulin sensitivity estimated using the Matsuda index was not substantially different among the three age groups of individuals with IGT. We observed a progressively increased degree of hepatic insulin resistance as assessed by the liver IR index in A-IGT and Y-IGT subjects compared with O-IGT individuals. Accordingly, because the liver is the primary site of insulin clearance (34), a graded decrease in the fasting C-peptide/insulin ratio, a measure of insulin clearance, was observed in the A-IGT and Y-IGT groups compared with the O-IGT group. Moreover, we found a progressive decrease in basal, early-phase, and total glucose-stimulated insulin secretion indexes with aging in the subjects with IGT. These findings have indicated that older subjects with IGT have a greater impairment in compensatory insulin secretory function compared with young people. In contrast, young individuals with IGT exhibit a greater degree of hepatic insulin resistance and a marked increase in insulin secretion compared with older IGT individuals, suggesting that impaired β-cell function is the major pathophysiological contributor to glucose intolerance in older individuals and insulin resistance is the most prominent defect in younger subjects with IGT.
By performing a multivariate linear regression analysis, we discerned a significant age–glucose tolerance interaction on levels of plasma glucose and insulin during OGTT, insulin sensitivity assessed using the Matsuda index, and β-cell function. This interaction suggests that the effect of age on these parameters of glucose homeostasis might differ among subjects with different glucose tolerance.
Our findings indicating that subjects with isolated IFG or IGT exhibited age-related heterogeneity in pathophysiologic characteristics might have important clinical implications. Because lifestyle and pharmacological interventions in subjects with prediabetes conditions have been shown to prevent or delay the development of diabetes (35–38), a more precise phenotyping of subjects with IGT or isolated IFG could help to better design individualized preventive approaches to slow or halt diabetes progression. The observation that older subjects with isolated IFG have a lower Matsuda index and a decreased free fat mass compared with young subjects with IFG provides the rationale to hypothesize that lifestyle physical activity interventions might be more efficacious in older subjects with isolated IFG than in younger people. Additionally, our findings indicating that older subjects with IFG or IGT have lower β-cell function compared with the younger people support the idea that older individuals with IGT or IFG could benefit more than young subjects from therapeutic strategies aimed to increase insulin production and secretion, such those based on dipeptidyl peptidase-4 inhibitors or glucagon-like peptide-1 receptor agonists, which have been shown to exert positive effects on β-cell function (39–42), improve glucose tolerance, and prevent diabetes development in high-risk subjects (43, 44). In contrast, given the increased hepatic insulin resistance with relatively conserved insulin secretion capacity found in young subjects with IGT compared with the older individuals, it is conceivable that the therapeutic approaches aimed to improve hepatic insulin sensitivity and decrease β-cell demand such as metformin and thiazolidinediones (35, 45–48) might be useful in young subjects with IGT. Nonetheless, intervention studies are required to ascertain the clinical utility of personalized pharmaceutical intervention in those with IGT and IFG on the basis of age-related characteristics.
The determination of HbA1c levels has become a commonly used screening tool for identifying subjects with diabetes or prediabetes (1). Because a positive association between age and HbA1c level, independent of the plasma glucose concentrations, has been previously reported (49–51), it is plausible that individuals with HbA1c-defined prediabetes might exhibit age-related pathophysiologic defects distinct from those captured by the OGTT-defined groups of prediabetes. However, further studies are needed to establish whether different age-dependent metabolic phenotypes also exist among subjects with HbA1c-defined prediabetes.
Our study had several strengths, including the large sample size, the inclusion of subjects with wide age and BMI ranges, the detailed characterization of the study population performed by a trained staff, the centralization of biochemical analyses performed on fresh rather than stored samples, and the exclusion of conditions known to affect glucose homeostasis. However, a number of limitations should also be recognized. First, given the cross-sectional design of the study, we could not establish the causal relationship between age-dependent metabolic alterations and prediabetes development. Second, the IGT group was formed by individuals with isolated IGT or combined IFG and IGT, two prediabetes states having different pathophysiological defects (31, 52). Given the low and unbalanced number of individuals in the three age groups with IGT and combined IFG/IGT, the present study was underpowered to detect age-related differences in metabolic alterations among subjects with isolated IGT or combined IFG/IGT. Moreover, participants underwent a single 75-g OGTT to assess glucose tolerance. Although such an approach is common in clinical practice, it is possible that some subjects might have been misclassified. Next, insulin secretion was estimated using OGTT-derived indexes, which could have been influenced by an incretin effect, rather than hyperglycemic clamp or intravenous glucose tolerance test. However, glucagon-like peptide-1 concentrations have been reported to be increased in older subjects compared with younger subjects (53), arguing against the possibility that the reduced insulin response to the oral glucose load observed in older subjects is caused by a lower incretin effect. Moreover, given the lack of data on the postload C-peptide levels and the relatively short duration of OGTTs, we could not evaluate insulin secretion using minimal model indexes of β-cell function (54). However, both InsAUC0–30/GluAUC0–30 and InsAUC0–120/GluAUC0–120 are commonly used measures of glucose-stimulated insulin secretion in epidemiological studies, previously validated against hyperglycemic clamp or intravenous glucose tolerance test (27, 55, 56). Furthermore, hepatic and peripheral insulin sensitivity was assessed by surrogate measures rather than by clamp studies, which represent the reference standard method to estimate insulin sensitivity. Nevertheless, clamp procedures are not practicable in large studies because they are expensive, invasive, and time-consuming. The Matsuda index is a well-known proxy measure of insulin sensitivity, previously validated against the euglycemic hyperinsulinemic clamp and mainly reflecting skeletal muscle insulin responsiveness (24, 57). In contrast, the liver IR index is an extensively validated indicator of liver insulin resistance (23, 57). Next, we evaluated body composition using bioelectrical impedance rather than more accurate methods such dual-energy X-ray absorptiometry. However, the latter is more expensive and not feasible in large studies. Additionally, our observations could have been influenced by the stratification of study participants into three glucose tolerance groups according to the fasting and postload glucose values, which were used to calculate the OGTT-derived insulin sensitivity and secretion indexes. Considering these methodological limitations, further pathophysiologic studies with direct and more accurate evaluation of insulin sensitivity and secretion are required to confirm our results. Finally, the present results were only from white individuals and should be confirmed in other ethnic groups such as black individuals, who are known to exhibit greater insulin response for a given degree of insulin sensitivity compared with their white counterparts.
In conclusion, our data have demonstrated that individuals with IFG or IGT exhibit different age-related pathophysiologic characteristics. Given the pathophysiologic heterogeneity underlying prediabetes conditions, the age of occurrence of IFG or IGT conditions should be considered for more precise phenotyping of subjects with isolated IFG or IGT to better design individualized preventive approaches aimed at counteracting type 2 diabetes development.
Acknowledgments
Author Contributions: T.V.F. researched and analyzed the data and wrote and edited the manuscript. E.P., E.S., A.S., and F.A. researched the data and reviewed the manuscript. M.P. and F.P. reviewed the manuscript and contributed to the discussion. G.S. designed the study, interpreted the data, and wrote the manuscript.
Disclosure Summary: The authors have nothing to disclose.
Abbreviations:
- A-IFG
adult age and impaired fasting glucose
- A-IGT
adult age and impaired glucose tolerance
- A-NGT
adult age and normal glucose tolerance
- AUC
area under the curve
- BMI
body mass index
- HbA1c
glycated hemoglobin
- HDL
high-density lipoprotein
- HOMA-β
homeostasis model assessment of β-cell function
- IFG
impaired fasting glucose
- IGT
impaired glucose tolerance
- IR
insulin resistance
- NGT
normal glucose tolerance
- OGTT
oral glucose tolerance test
- O-IFG
older age and impaired fasting glucose
- O-IGT
older age and impaired glucose tolerance
- O-NGT
older age and normal glucose tolerance
- Y-IFG
young age and impaired fasting glucose
- Y-IGT
young age and impaired glucose tolerance
- Y-NGT
young age and normal glucose tolerance
