


Abstract
Pegvisomant (PEG) in monotherapy or combined with somatostatin analogs (SSAs) is used to control acromegaly, improving metabolism. However, the metabolic changes induced by PEG have not been systematically reviewed.
To address the following questions: does PEG or the combination of PEG and SSAs affect fasting plasma glucose (FPG), glycosylated Hb (HbA1c), glucose load (2-hour oral glucose tolerance test), insulin levels [fasting plasma insulin (FPI)], homeostatic model assessment of insulin resistance (HOMA-I), homeostatic model assessment of β-cell function, lipid profile, or body mass index? Are the effects disease-related or drug-related?
Indexed databases up to January 2019.
Prospective interventional trials reporting glycometabolic outcomes under PEG or PEG plus SSAs for a minimum of 6 months.
Three reviewers screened eligible publications (7248), three others extracted the outcomes, and all assessed the risk of biases.
Thirteen studies were included in the PEG and 5 in the PEG plus SSAs analysis (overall 550 subjects). PEG significantly decreased FPG [effect size (ES) −0.80 mmol/L (95% CI, −1.06 to −0.55); P = 0.000], HbA1c [ES −0.43% (95% CI, −0.56 to −0.31); P = 0.000], FPI [ES −5.31 mU/L (95% CI, −10.23 to −0.39); P = 0.034], and HOMA-I [ES −0.61 (95% CI, −1.17 to −0.04); P = 0.034]. Effects on FPG and FPI were not correlated to IGF-1 changes. The addition of PEG to SSAs mitigated the effects of SSAs on metabolism, producing an overall neutral effect.
Independently of disease control, PEG in monotherapy or combined with SSAs seems to improve glucose metabolism, reducing FPG, HbA1c, FPI, and HOMA-I.
Excess GH, the cause of acromegaly, also impairs glucose metabolism. The reported prevalence of diabetes mellitus (DM) in patients with acromegaly ranges from 19% to 56%, contributing to increased cardiovascular morbidity and mortality (1–5). This wide range is due to differences in the study populations and the diagnostic criteria for DM used at the baseline (1, 3, 5).
Insulin resistance is considered the hallmark for the development of DM in acromegaly. Excess GH impairs insulin secretion and reduces glucose uptake, favoring lipolysis, free fatty acid (FFA) release, and hepatic glucose production (1, 3, 5, 6). GH hypersecretion also impairs insulin sensitivity through indirect mechanisms such as adipokine imbalance, favoring local and systemic inflammation (6). Acromegaly has also been associated with pancreatic β-cell dysfunction (3, 7). All of the above mechanisms may persist even when GH levels are under control, explaining the persistence of metabolic alterations even after successful treatment (3, 8).
Pegvisomant (PEG), a GH receptor blocker, is the most powerful drug available to lower IGF-1 levels (3, 9, 10). In clinical trials, it was effective in up to 90% of patients with acromegaly (11, 12); its response rate in real life, however, is ∼60% to 70% (13, 14). PEG treatment has favorable effects on glucose metabolism, lowering fasting plasma glucose (FPG) and glycosylated Hb (HbA1c) and improving glucose tolerance (3, 15–17). It also improves insulin sensitivity, FFA, basal lipolysis, and endogenous glucose production rate, which reflect hepatic output (15, 18).
Whether the favorable effects of PEG are the consequence of improved biochemical control or a drug-specific effect remains unaddressed. A recent meta-analysis investigated the effect of somatostatin analogs (SSAs) on a complete panel of metabolic parameters, finding that they reduce insulin levels and increase HbA1c and after-load glucose, with neutral effects on fasting glucose (19) to an extent that is proportional to disease control (lowering of GH and IGF-1). Combination PEG and SSA therapy is effective in inducing biochemical control of poorly controlled acromegaly (3, 10, 15); whether the addition of PEG counteracts the metabolic changes induced by SSAs has not been investigated.
To date, no meta-analysis has evaluated the effects of PEG or PEG plus SSAs on glucose metabolism. The aim of the present meta-analysis is to address the following questions: (i) does PEG affect FPG, HbA1c, glucose load [2-hour oral glucose tolerance test (OGTT)], fasting plasma insulin (FPI), homeostatic model assessment of insulin resistance (HOMA-I), homeostatic model assessment of pancreatic β-cell function (HOMA-β), triglycerides (TGDs), total cholesterol (Total-C), high-density lipoprotein cholesterol (HDL-C), low-density lipoprotein cholesterol (LDL-C), or body mass index (BMI)? (ii) Does the combination of PEG and SSAs affect FPG, HbA1c, 2-hour OGTT, FPI, HOMA-I, HOMA-β, TGDs, Total-C, HDL-C, LDL-C, and BMI? (iii) Are these effects disease-related or drug-related?
Methods
We performed the meta-analysis following a rigorous protocol in accordance with the Cochrane Collaboration and Preferred Reporting Items for Systematic Reviews and Meta-analyses statements (20).
Search strategy
A comprehensive search of English-language articles published from 1999 to 2018 was conducted in several databases (MEDLINE, Embase, Cochrane Library, and Scopus) between March 2017 and March 2018. The key words were: acromegaly AND diabetes, acromegaly AND medical treatment, and acromegaly treatment. A subsequent search including the following key words: glucose intolerance/hyperglycemia/glucose AND acromegaly did not retrieve additional eligible studies. A final update of the search was conducted in January 2019, but no further studies were included.
Study selection
We selected all studies that met the following eligibility criteria: (i) randomized controlled trials (RCTs) and nonrandomized prospective interventional trials; (ii) PEG or combination PEG plus SSA treatment in patients with acromegaly; (iii) at least 6 months’ follow-up; and (iv) assessment of glucose metabolism parameters before and after PEG or PEG plus SSA treatment. Reviews, animal studies, retrospective studies, and nonoriginal articles were excluded.
Three reviewers (E.S., C.P., and D.G.) independently screened all identified titles and abstracts and evaluated potentially eligible publications. The corresponding authors were contacted if the full texts were not available, but no further studies were obtained.
There was a high level of interobserver agreement (92%; 23 out of 25 studies were included for the full-text relevance assessment). Disagreements were solved by consensus after open discussion. Figure 1 shows the study selection process.
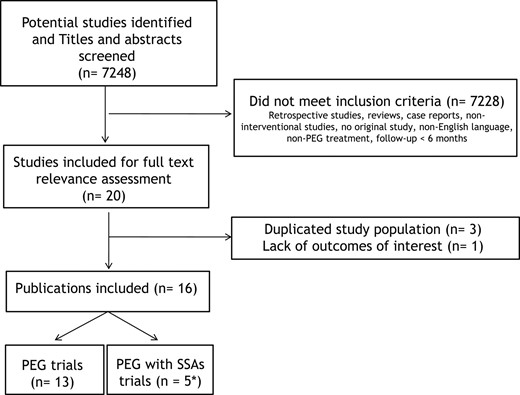
Flow chart of the literature eligibility assessment process. *Two publications were included in both analyses.
Data extraction and quality assessment
Three reviewers (A.C., T.F., and C.P.) independently extracted the following data: study design (RCTs and prospective interventional studies), age, sex, previous sample population treatments, treatment schedule (PEG or PEG plus SSAs, mean dosage, and follow-up), and percentage of disease control expressed as normal IGF-1 adjusted for age and sex. Table 1 (12, 17, 21–34) shows the details of the included studies.
Details of Selected Studies
| First Author, Year (Reference No.) | No. of Patients (Male/Female) | Age (y) (Mean ± SD or Range) | Mean Follow-Up (mo) | Dosage (Mean or Range) | Disease Controla (%) |
|---|---|---|---|---|---|
| PEG monotherapy | |||||
| van der Lely et al., 2001 (12) | 152 (85/67) | 46 ± 14 | 18 | 19.6 mg/d | 57 |
| Rose and Clemmons, 2002 (21) | 5 | 22–71 | 18–20 (range) | 10–30 mg/d | 80 |
| Parkinson et al., 2002 (22) | 20 (9/11) | 59 ± 14 | 10 | — | 100 |
| Sesmilo et al., 2002 (23) | 48 (25/23) | 45 ± 12 | 18 | 10–35 mg/d | 71 |
| Drake et al., 2003 (24) | 7 (3/4) | 59 ± 13 | 8b | 10–25 mg/d | — |
| Barkan et al., 2005 (25) | 53 (27/26) | 49 (23–81) | 8 | 16 mg/d | 78 |
| Plockinger and Router, 2008 (26) | 5 (2/3) | 58 ± 14 | 6 | 10–25 mg/d | 100 |
| Ghigo et al., 2009 (27) | 57 (28/29) | 49 ± 14 | 12 | 5–35 mg/d | 51 |
| Trainer et al., 2009 (28) | 25 (15/10) | 49 (24–67) | 10 | 5–30 mg/d | 60 |
| De Martino et al., 2010 (29) | 11 (4/7) | 44 ± 10 | 18 | 26.5 mg/d | 80 |
| Urbani et al., 2013 (17) | 18 | — | 6 | 18.9 mg/d | — |
| Auriemma et al., 2012 (30) | 19 (8/11) | 44 ± 9 | 18 | 25.4 mg/d | 85 |
| Muhammad et al., 2016 (31) | 15 (7/8) | 35–80 | 12 | 80 mg/wkb | 73 |
| Combination therapy PEG and SSAs | |||||
| De Marinis et al., 2007 (32) | 10 (5/5) | 46 ± 8 | 12 | OCT 40 mg/28 d, PEG 10–25 mg/d | — |
| Trainer et al., 2009 (28) | 26 (17/9) | 40 (24–65) | 10 | OCT 30 mgb/28 d, PEG 5–30 mg/d | 73 |
| Madsen et al., 2011 (33) | 12 (6/6) | 55 ± 5 | 6 | OCT 6.7–20 mg/28 d or LAN 24–60 mg/28 d, PEG 52.5 mg/wkb | 100 |
| Urbani et al., 2013 (17) | 31 | — | 6 | OCT 30 mg/28 d or LAN 120 mg/28 d, PEG 10 mg/d | 42 |
| Auriemma et al., 2017 (34) | 36 (14/22) | 52 ± 10 | 78b | OCT 30–40 mg/28 d or LAN 60–240 mg/28 d, PEG 30–280 mg/wk | 83 |
The percentage of disease control is expressed using the following criteria: normal IGF-1 levels adjusted to age and sex.
Median.
The quality control checks on extracted data were performed by another investigator (E.G.), and all six reviewers involved in study selection and extraction independently assessed the risk of bias for all trials on the basis of the Cochrane risk-of-bias algorithm modified for non-RCTs by removing inapplicable criteria (Table 2) (12, 17, 21–35).
Risk of Bias Summary per Cochrane Metrics
| First Author, Year (Reference No.) | Selection Bias | Performance Bias | Detection Bias | Attrition Bias | Reporting Bias | Other Bias |
|---|---|---|---|---|---|---|
| PEG monotherapy | ||||||
| van der Lely et al., 2001 (12) | NE | NE | NE | + | − | − |
| Rose and Clemmons, 2002 (21) | NE | NE | NE | − | − | + |
| Parkinson et al., 2002 (22) | NE | NE | NE | − | − | − |
| Sesmilo et al., 2002 (23) | NE | NE | NE | − | + | − |
| Drake et al., 2003 (24) | NE | NE | NE | − | − | − |
| Barkan et al., 2005 (25) | NE | NE | NE | − | − | − |
| Plockinger and Router, 2008 (26) | NE | NE | NE | − | − | − |
| Ghigo et al., 2009 (27) | NE | NE | NE | − | − | − |
| Trainer et al., 2009 (28) | ? | ? | ? | + | + | − |
| De Martino et al., 2010 (29) | NE | NE | NE | − | − | − |
| Urbani et al., 2013 (17) | NE | NE | NE | − | − | − |
| Auriemma et al., 2012 (30) | NE | NE | NE | − | − | − |
| Muhammad et al., 2016 (31) | NE | NE | NE | − | + | − |
| Combination therapy PEG and SSAs | ||||||
| De Marinis et al., 2007 (32) | NE | NE | NE | − | − | − |
| Trainer et al., 2009 (28) | ? | ? | ? | + | + | − |
| Madsen et al., 2011 (33) | NE | NE | NE | − | − | − |
| Urbani et al., 2013 (17) | NE | NE | NE | − | − | − |
| Auriemma et al., 2017 (34) | NE | NE | NE | − | − | − |
− indicates low risk; + indicates high risk; ? indicates unclear risk of bias.
Abbreviation: NE, not evaluable.
Outcomes
Outcomes of interest included changes in FPG, HbA1c, 2-hour OGTT, FPI, HOMA-I, HOMA-β, TGDs, Total-C, HDL-C, LDL-C, and BMI. Data about the glycemic status of patients and their antidiabetic therapies were extracted. We considered only the last follow-up evaluation, excluding interim data. Studies with overlapping populations were excluded, and only those with the most complete and recent data were selected.
Data synthesis and statistical analysis
We extracted mean ± SD or median and range at baseline and posttreatment or difference from baseline and/or percentage of change for all of the above outcomes. When SE was reported, we calculated the corresponding SD, and, if necessary, we converted units of measurements in line with the International System of Units. We contacted the authors to obtain any missing data (SD or pre- or posttreatment values), but no further data were obtained.
To explore if the duration of follow-up influences the effects of PEG on glucose metabolism outcomes, the studies were stratified by mean follow-up (<12 months or ≥12 months). They were then categorized by the percentage of patients with normal IGF-1, arbitrarily divided into two groups (<80% or ≥80% patients at target) to establish if the effect of PEG on glucose metabolism correlates with disease control.
Data were entered into Stata 10.1 (StataCorp, College Station, TX). We computed the mean difference (MD) between postvalues and prevalues; negative values indicate prevalues higher than postvalues. The SE of the MD was calculated taking into account the correlation between the pre-post measures. We performed the meta-analysis using a random-effects model for combining data into a pooled MD. We evaluated heterogeneity using the χ2 test, quantifying inconsistency by I2. This describes the percentage of the variability in effect estimates that is due to heterogeneity rather than sampling error, ranging from 0 (no heterogeneity) to 100 (maximum heterogeneity). This index was interpreted using the classification proposed by Higgins et al. (36): I2 0% indicated no heterogeneity, I2 25% is low heterogeneity, I2 50% is moderate heterogeneity, and I2 75% indicates high heterogeneity. A possible effect of the post- to pre-MD in sex distribution in IGF-1 values was investigated by performing a meta-regression analysis. This was performed only for FPG and FPI, because of the paucity of studies evaluating the other outcomes. Publication bias was investigated by funnel plot. The estimated effect size (ES) was reported as MD and 95% CI. A P value <0.05 was considered statistically significant.
Results
Study selection
The data search retrieved 7248 potentially relevant studies. Of these, 7228 were excluded based on title and abstract screening, and 4 were excluded after full-text analysis. The main reasons for exclusion were not in English, not in humans, not interventional prospective studies, not using PEG or PEG plus SSAs, nonrelevant outcomes, and too short follow-up (<6 months). This left 16 eligible studies reporting 18 intervention groups: 13 for PEG (12, 17, 21–31) and 5 for PEG plus SSAs (17, 28, 32–34).
Study characteristics
Table 1 (12, 17, 21–34) summarizes the characteristics of the included studies. In the PEG monotherapy analysis, the outcomes of interest were reported as primary or secondary end points. Data were available from 435 intention-to-treat subjects receiving PEG in 13 studies (12, 17, 21–31). Study characteristics varied in: (i) daily dose (5 to 35 mg daily); (ii) mean follow-up (6 to 20 months); and (iii) previous treatments received (neurosurgery and/or radiotherapy and/or medical therapy). All studies enrolled both male and female patients, with a mean age of 49.8 years (range 21 to 81 years). All studies were interventional prospective, and two were RCTs (27, 28). Three trials were funded by pharmaceutical companies (26–28).
The metabolic parameters in patients receiving PEG plus SSAs were reported as primary or secondary end points in 5 studies (17, 28, 32–34) for a total of 115 intention-to-treat subjects. Study characteristics varied in: (i) daily dose (PEG 5 to 40 mg daily combined with octreotide long-acting release 6.7 to 40 mg for 4 weeks or lanreotide slow release 24 to 240 mg every 4 weeks); (ii) mean follow-up [between 6 and 12 months for all studies, except one with a median follow-up of 78 months (34)]; and (iii) previous treatments. All studies enrolled both male and female patients, with a mean age of 48.3 years (range 24 to 65 years). All studies were interventional prospective, and two were RCTs (28, 33). Two trials were funded by pharmaceutical companies (28, 33).
PEG monotherapy
The overall analysis of the 9 studies investigating FPG (347 patients) revealed a significant decrease in blood glucose [ES −0.80 mmol/L (95% CI, −1.06 to −0.55 mmol/L); P = 0.000], but with a high heterogeneity (I2 = 97.9%; P = 0.000) (12, 17, 21, 24, 25, 27–30). The improved FPG was accompanied by a significant decrease in HbA1c [ES −0.43% (95% CI, −0.56 to −0.31%); P = 0.000] with moderate heterogeneity in the 6 studies (I2 = 58.7%; P = 0.033) reporting data on 135 patients (17, 21, 25, 28, 30, 31). Figure 2 shows the results of PEG effect on FPG and HbA1c. Although the main analysis of glucose 2-hour OGTT did not show significant changes [ES −2.75 mmol/L (95% CI, −5.91 to 0.41 mmol/L); P = 0.088], only 4 studies (153 patients) were included, with extremely high heterogeneity (I2 = 99.4%; P = 0.000) (17, 25, 27, 28). Furthermore, PEG reduced FPI levels in 8 studies on 363 patients: the ES was −5.31 mU/L (95% CI, −10.23 to −0.39 mU/L; P = 0.034), but with high heterogeneity (I2 = 99.4%; P = 0.000) (12, 17, 21, 23, 25, 27, 29, 30). Consistent with the findings for FPG and FPI, PEG also decreased HOMA-I [ES −0.61 (95% CI, −1.17 to −0.04); P = 0.034] in 5 studies (61 patients), with a high heterogeneity (I2 = 82.8%; P = 0.000) (17, 22, 24, 26, 29). Figure 3 shows the results of PEG effect on FPI and HOMA-I. Five studies (103 patients) provided data on TGDs, revealing a borderline increase after treatment with an ES of 0.12 mmol/L (95% CI, −0.00 to 0.25 mmol/L; P = 0.051) and low heterogeneity (I2 = 14.8%; P = 0.320) (22, 23, 26, 29, 30). No change was found in Total-C [5 studies, 250 patients; ES: 0.08 mmol/L (95% CI, −0.11 to 0.27 mmol/L); P = 0.410] and LDL-C [4 studies, 84 patients; ES: 0. 13 mmol/L (95% CI, −0.23 to 0.501 mmol/L); P = 0.479], with low and moderate heterogeneity among the studies, respectively (I2 = 27.3%, P = 0.239; and I2 = 68.2%, P = 0.024). A trend toward significance was found in HDL-C levels, revealing a slight increase after PEG treatment [4 studies, 84 patients, ES: 0.07 mmol/L (95% CI, −0.00 to 0.15 mmol/L); P = 0.056], with high heterogeneity among the studies (I2 = 77.3%; P = 0.004). No change was found in BMI in the four available studies [ES −0.06 kg/m2 (95% CI, −0.45 to 0.33 kg/m2); P = 0.755, I2 = 0.0%; and P = 0.534] (21, 22, 29, 30).
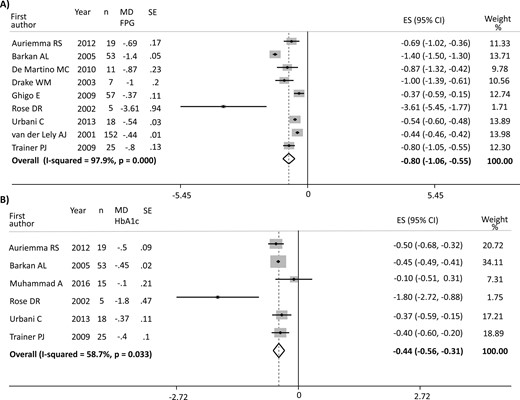
(A) Results of the main analysis of PEG effects on FPG in acromegaly. (B) Results of the main analysis of PEG effects on HbA1c in acromegaly. Single studies are identified by first author and publication year. Weights are from random-effects analysis. The P value in boldface parentheses refers to I2.
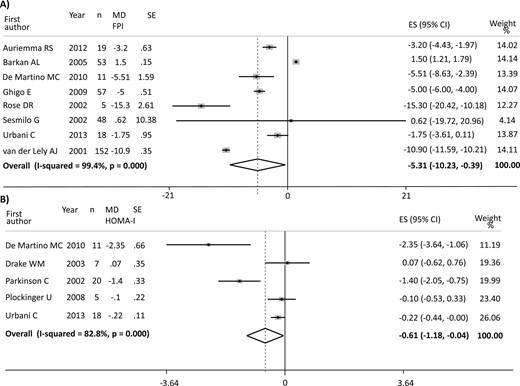
(A) Results of the main analysis of PEG effects on FPI in acromegaly. (B) Results of the main analysis of PEG effects on HOMA-I in acromegaly. Single studies are identified by first author and publication year. Weights are from random-effects analysis. The P value in boldface parentheses refers to I2.
With regard to the glycemic status of patients and their antidiabetic therapies, only a minority of the studies reported both pre- and posttreatment data. Therefore, it has not been possible to adjust for this confounding factor. Overall, in 13 out of 13 available studies, all provide only the number of patients with diabetes at baseline, for a total of 63 out of 435 patients (14.5%), but just 1 study (17) provides posttreatment data. Moreover, only two studies (21, 25) report the antidiabetic therapies used and any change occurring in therapies after PEG treatment.
The results for both the main and subgroup analyses for length of follow-up and disease control are reported in Table 3 (12, 17, 21–31). The subgroup analysis did not show any considerable differences compared with the main analysis. The paucity, but also the homogeneity, of studies reporting full details of the daily dose-regimen (with most studies reporting only the dose range) prevented a dose-subgroup analysis. In particular, only 6 out of 13 studies provide full details on the mean daily doses with a mean dosage of 19.6 mg/d, resulting in too few studies for each group to perform meaningful comparisons. Anyway, the studies included seems to be sufficiently homogeneous according to the dose-regimen, with dose ranging from 5 to 35 mg/d in the majority of them.
Summary of Results of PEG Meta-Analysis on Glucose Metabolism Outcomes: Main Analysis and Subgroups by Follow-Up and Disease Control
| Main Analysis | No. of Patients | Mean Difference (95% CI) | P Value | I2 (%) | References |
|---|---|---|---|---|---|
| FPG, mmol/L | 347 | −0.80 (−1.06 to −0.55) | 0.000 | 97.9 | (12, 17, 21, 24, 25, 27–30) |
| HbA1c, % | 135 | −0.43 (−0.56 to −0.31) | 0.000 | 58.7 | (17, 21, 25, 28, 30, 31) |
| FPI, mU/L | 363 | −5.31 (−10.23 to −0.39) | 0.034 | 99.4 | (12, 17, 21, 23, 25, 27, 29, 30) |
| 2-h OGTT Glycemia, mmol/L | 153 | −2.75 (−5.91 to 0.41) | 0.088 | 99.4 | (17, 25, 27, 28) |
| HOMA-I | 61 | −0.61 (−1.17 to −0.04) | 0.034 | 82.8 | (17, 22, 24, 26, 29) |
| TGDs, mmol/L | 103 | 0.12 (−0.00 to 0.25) | 0.051 | 14.8 | (22, 23, 26, 29, 30) |
| Total-C, mmol/L | 250 | 0.08 (−0.11 to 0.27) | 0.410 | 27.3 | (12, 22, 23, 29, 30) |
| HDL-C, mmol/L | 84 | 0. 07 (−0.00 to 0.15) | 0.056 | 77.3 | (22, 23, 26, 29) |
| LDL-C, mmol/L | 84 | 0. 13 (−0.23 to 0.50) | 0.479 | 68.2 | (22, 23, 26, 29) |
| BMI, kg/m2 | 51 | −0.06 (−0.45 to 0.33) | 0.755 | 0 | (21, 22, 29, 30) |
| Subgroup follow-up (<12 mo) | |||||
| FPG, mmol/L | 103 | −0.93 (−1.50 to −0.37) | 0.001 | 98.6 | (17, 24, 25, 28) |
| HbA1c, % | 96 | −0.45 (−0.48 to −0.41) | <0.001 | 0 | (17, 25, 28) |
| FPI, mU/L | — | — | — | — | — |
| 2-h OGTT Glycemia, mmol/L | 96 | −3.63 (−7.74 to 0.48) | 0.084 | 98.6 | (17, 25, 28) |
| HOMA-I | 50 | −0.38 (−0.86 to 0.10) | 0.123 | 77.7 | (17, 22, 24, 26) |
| TGDs, mmol/L | — | — | — | — | — |
| BMI, kg/m2 | — | — | — | — | — |
| Subgroup follow-up (≥12 mo) | |||||
| FPG, mmol/L | 244 | −0.60 (−0.86 to −0.34) | <0.001 | 75.5 | (12, 21, 27, 29, 30) |
| HbA1c, % | 39 | −0.64 (−1.24 to −0.03) | 0.039 | 82.1 | (21, 30, 31) |
| FPI, mU/L | 292 | −7.35 (−10.77 to −3.94) | <0.001 | 93.8 | (12, 21, 23, 27, 29, 30) |
| 2-h OGTT Glycemia, mmol/L | — | — | — | — | — |
| HOMA-I | — | — | — | — | — |
| TGDs, mmol/L | 78 | 0.11 (−0.08 to 0.30) | 0.270 | 50.9 | (23, 29, 30) |
| BMI, kg/m2 | 35 | −0.17 (−0.66 to 0.32) | 0.505 | 0 | (21, 29, 30) |
| Subgroup disease control (<80%) | |||||
| FPG, mmol/L | 287 | −0.75 (−1.35 to −0.16) | 0.013 | 99.1 | (12, 25, 27, 28) |
| HbA1c, % | 93 | −0.41 (−0.54 to −0.27) | <0.001 | 30.1 | (25, 28, 31) |
| FPI, mU/L | 310 | −4.33 (−11.19 to 2.53) | 0.216 | 99.3 | (12, 23, 25, 27) |
| 2-h OGTT Glycemia, mmol/L | — | — | — | — | — |
| HOMA-I | — | — | — | — | — |
| TGDs, mmol/L | — | — | — | — | — |
| BMI, kg/m2 | — | — | — | — | — |
| Subgroup disease control (≥80%) | |||||
| FPG, mmol/L | 35 | −1.17 (−1.97 to −0.36) | 0.004 | 78.3 | (21, 29, 30) |
| HbA1c, % | — | — | — | — | — |
| FPI, mU/L | 35 | −7.50 (−13.17 to −1.83) | 0.010 | 90.2 | (21, 29, 30) |
| 2-h OGTT Glycemia, mmol/L | — | — | — | — | — |
| HOMA-I | — | — | — | — | — |
| TGDs, mmol/L | 55 | 0.03 (−0.13 to 0.20) | 0.693 | 0 | (22, 26, 29, 30) |
| BMI, kg/m2 | — | — | — | — | — |
Combination therapy: PEG plus SSAs
Five studies investigated the effect of PEG plus SSAs combined treatment. There was no significant change in FPG [4 studies, 89 patients; ES −0.09 mmol/L (95% CI, −0.58 to -0.40 mmol/L); P = 0.721], but the heterogeneity was very high (I2 = 93.5%; P = 0.000) (17, 32–34). HbA1c analysis was possible in 4 studies (103 patients), revealing a borderline decrease [ES −0.12% (95% CI, −0.24 to 0.00%); P = 0.052] with moderate heterogeneity (I2 = 91.2%; P = 0.000) (17, 28, 32, 34), whereas FPI was significantly reduced (4 studies and 89 patients) with an ES of −3.63 mU/L (95% CI, −4.11 to −3.14 mU/L; P = 0.000) and no heterogeneity (I2 = 0.0%; P = 0.470) (17, 32–34). No significant change was observed in HOMA-I [ES −0.98 (95% CI, −2.33 to 0.37); P = 0.154, I2 = 60.5%; and P = 0.079] (17, 32, 34) or HOMA-β [ES of −29.99 (95% CI, −67.67 to 7.68); P = 0.119, I2 = 88.2%; and P = 0.000] (17, 32, 34) in the 3 studies (77 patients) investigating these parameters.
Table 4 (17, 28, 32–34) summarizes the results of the main analysis. Meta-analysis was not possible for glucose 2-hour OGTT, TGDs, Total-C, HDL-C, LDL-C, and BMI because of the paucity of data.
Summary of Results of PEG Combined With SSAs Meta-Analysis on Glucose Metabolism Outcomes
| Main Analysis | No. of Patients | Mean Difference (95% CI) | P Value | I2 (%) | References |
|---|---|---|---|---|---|
| FPG (mmol/L) | 89 | −0.09 (−0.58 to 0.40) | 0.721 | 93.5 | (17, 32–34) |
| HbA1c (%) | 103 | −0.12 (−0.24 to 0.00) | 0.052 | 92.2 | (17, 28, 32, 34) |
| FPI (mU/L) | 89 | −3.63 (−4.11 to −3.14) | 0.000 | 0 | (17, 32–34) |
| HOMA-I | 77 | −0.98 (−2.33 to 0.37) | 0.154 | 60.5 | (17, 32, 34) |
| HOMA-β (%) | 77 | −29.99 (−67.67 to 7.68) | 0.119 | 88.2 | (17, 32, 34) |
With regard to the glycemic status of patients and their antidiabetic therapies, only a minority of the studies reported both pre- and posttreatment data. Overall, of the 5 available studies, all studies report the number of patients with diabetes at baseline, for a total of 31 out of 115 patients (27%), but just 3 studies (17, 32, 34) provide posttreatment data. Moreover, only one study (34) specifies details regarding antidiabetic therapies used and any changes after PEG plus SSA treatment.
Subgroup analyses were not performed because of the low number of included studies. In particular, only two out of five studies provide full details on the mean or median PEG daily doses, and only three out of five studies provide full details on the mean or median SSA [octreotide (OCT) or lanreotide (LAN)] doses, resulting in too few studies for each group to perform meaningful comparisons.
Meta-regression
Meta-regression analyses were possible only for PEG monotherapy; the IGF-1 MD had no effect on the FPG MD (regression coefficient β = 0.001; SE 0.001; P = 0.336) or on the FPI MD (β = 0.005; SE 0.016; P = 0.645). Overall, no sex distribution effect was found.
Risk of bias
Most of the studies had a low risk of attrition and reporting bias. In the PEG meta-analysis, two had a high risk of attrition bias (12, 28), and three had a high risk of reporting bias (23, 28, 31). In the PEG plus SSAs meta-analysis, one study (28) had a high risk of both attrition bias and reporting bias (Table 2) (12, 17, 21–34). Publication bias was not evaluated, as there was an inadequate number of included trials to properly assess a funnel plot.
Discussion
This meta-analysis reveals that PEG treatment has a positive impact on glucose metabolism, inducing a considerable decrease in FPG and, accordingly, a marked decrease in HbA1c. It also induces a substantial decrease in FPI and, in accordance with the drop in both glucose and insulin levels, we found a noteworthy decrease in HOMA-I. Conversely, PEG plus SSA treatment has no effect on glucose metabolism, except for the decrease in FPI. Because SSAs may worsen glucose metabolism, it is reasonable to argue that the addition of PEG can mitigate this effect toward a neutral balance.
Acromegaly is frequently associated with metabolic disorders (1, 4, 5). The main pathophysiological mechanism is insulin resistance due to excess GH (1, 3, 5, 6). However, the influence of medical therapies on glucose metabolism is still under debate, as a recent study (19) showed that SSAs might increase HbA1c while improving disease control.
Previous reports showed that PEG might have favorable effects on glucose metabolism (37). However, there are still various open issues: (i) if these effects are dependent on better biochemical control; (ii) if they are due to the discontinuation of SSAs (i.e., removal of the inhibitory action of SSAs on insulin secretion); and (iii) if they are drug-related effects exerted on the liver or skeletal muscle.
This meta-analysis evaluates the effects of PEG and PEG plus SSAs on glucose metabolism outcomes and takes account of prospective interventional studies and RCTs only; observational studies (e.g., ACROSTUDY reports) were excluded to avoid extracting potentially incomplete data with a high risk of bias.
The improved glucose metabolism observed after PEG treatment could be explained by the blockade of the GH receptor on peripheral tissues, especially the liver, muscles, and adipose tissue, thus removing the detrimental effect of GH on insulin signaling, lipolysis, and gluconeogenesis. However, we could not exclude an additional effect due to SSA discontinuation. In fact, all of the studies included in the meta-analysis [with the exception of the study by Ghigo et al. (27)] used PEG as second-line medical therapy, so all patients had undergone a previous treatment with SSAs.
These results are consistent with putative pathophysiological mechanisms proposed by other authors: Urbani et al. (17) demonstrated that the disposition index, a parameter linking β-cell function and insulin sensitivity, was higher in patients with acromegaly controlled by PEG therapy than in those under SSAs, suggesting that PEG determined a better profile of the insulin-dependent components of glucose tolerance. Moreover, PEG treatment has also been linked to the decrease in overnight FFA, because of its inhibitory effect on lipolysis, which is influenced by insulin concentrations and degree of adiposity. The study from Higham et al. (18) showed a lower basal glycerol production rate when corrected for insulin after PEG treatment, suggesting an increase in sensitivity of lipolysis to insulin.
In contrast to the improvement in glucose metabolism and insulin resistance, we found a borderline increase in TGDs and HDL-C after PEG treatment. Published data show that PEG increases cholesterol levels (LDL) due to a reduction in hepatic LDL clearance (22). We could speculate a rebound effect after SSA withdrawal, given that we previously showed that SSAs induce a considerable decrease in TGDs (19). However, the effect of PEG on lipidic metabolism needs further investigation to understand the underlying pathophysiological mechanisms.
Subgroup and meta-regression analyses were attempted to explain the heterogeneity among the studies, but inferences were limited by the paucity of available studies. The subgroup analyses, however, do suggest that the improved glucose metabolism observed after PEG therapy is independent of both the treatment duration and disease control. These data are confirmed by meta-regression analysis (which was only possible for FPG and FPI) that did not show any correlation with changes in IGF-1 levels. Overall, these findings suggest that PEG effects are more drug related than disease-control related.
The results of this meta-analysis show that combined treatment with PEG and SSAs has an overall neutral effect on glucose metabolism outcomes, with no remarkable change in FPG nor in HOMA-I and HOMA-β and a marginal trend toward significance in HbA1c reduction. Conversely, the combined treatment induced a notable decrease in FPI levels, with no heterogeneity among the studies. These effects were expected, as (i) the two drugs induce opposite effects on glucose metabolism when given in monotherapy, and (ii) they have an additive effect on FPI, because the direction of change observed in monotherapy is the same for both drugs. SSA treatment can affect insulin, and, to a lesser extent, glucagon secretion in patients with acromegaly through binding to SSTR-5, which is highly expressed in pancreatic β-cells and involved in insulin secretion modulation. This is a possible mechanism through which SSA treatment might affect insulin secretion in patients with acromegaly. The results of a recent study show that SSAs significantly reduce insulin secretion, suggesting that this impairment is due to blunting of postload insulin elevation, with no major effect on fasting glucose (19). Moreover, the study shows a substantial posttreatment drop in HOMA-I, HOMA-β, and TGDs, confirming that the effect of SSAs on insulin secretion plays a major role in the metabolic impairment (19).
Our findings underline the growing need for a tailored treatment of acromegaly based on the patients’ individual clinical situation. Personalized medicine is a hot topic in the most recent literature on acromegaly. Several studies recommend the evaluation of specific biomarkers able to predict response to the different medical treatments, thus increasing efficacy, improving disease control, and reducing costs (38, 39). We propose the addition of a personalized approach based on the patient’s clinical background, with metabolic status guiding toward one or another choice. SSAs could be prescribed more readily for patients with a good metabolic background, whereas those with severely impaired glucose metabolism, such as patients with poorly controlled diabetes, should consider PEG as monotherapy or in combination with SSAs.
PEG is the most powerful drug available to lower IGF-1 levels, but it is expensive and requires daily administration, potentially reducing compliance. However, recent studies (40) showed that a weekly schedule might also be feasible, especially in combination with SSAs. This combination, involving a dose reduction in both PEG and SSAs (15) and, importantly, the reduction/withdrawal of antidiabetic drugs, could improve the cost-benefit ratio of PEG therapy. It has been demonstrated that the control of comorbidities associated with acromegaly reduces the economic burden of the disease (41), and most of these complications are directly or indirectly related to metabolic impairment.
This meta-analysis expands the knowledge on PEG therapy, but it has some limitations. The first is the heterogeneity among the studies, which is only slightly reduced by the subgroup analyses. Second, few studies met our inclusion criteria, especially for PEG combined with SSAs, and subgroup analysis reduced the number considered even further. In fact, the few studies reporting full details on the daily dose-regimen prevented the subgroup analysis. Nevertheless, the studies seem sufficiently homogeneous according to the dose range, with a daily dose ranging from 5 to 35 mg in the majority of them. There is a clear need for more studies exploring the dose dependency of PEG effects, either in monotherapy or combination with SSAs, as the identification of the lower dose to achieve beneficial metabolic effect could be clinically relevant. However, even though few studies were included, they were all prospective and interventional, and this is a strong point of the current study.
The third limitation is that analysis of changes in glycemic status and the use or dose of antidiabetic medications was not possible. A proportion of the patients with diabetic acromegaly might have reduced their medication use. Consequently, our meta-analysis may have underestimated the real beneficial metabolic effect of PEG.
The fourth limitation is that the meta-regression analysis included just 6 studies, whereas the minimum number required for statistical significance is 10. However, the result is partly supported and confirmed by the subgroup analyses, as both converge in showing no effect of disease control (percentage of patients with normal IGF-1 levels).
In conclusion, the currently available studies suggest that PEG, whether given as monotherapy or in combination with SSAs, has beneficial effects on various metabolic parameters, reducing FPG, HbA1c, FPI, and HOMA-I. Further investigation is needed in relation to the effect of PEG on lipidic metabolism, as this seems to be a truly intriguing effect. Furthermore, combination PEG plus SSAs has an overall neutral effect on glucose metabolism, apart from a reduction in FPI. For these reasons, PEG as monotherapy or in combination with SSAs should be considered for the treatment of patients with acromegaly in whom metabolic control is both difficult and a priority for the patient himself or herself.
Acknowledgments
The authors thank Marie-Hélène Hayles for the revision of the English text and the staff at the Interdepartmental Experimental and Molecular Medicine Library (bmedsper) of Sapienza University of Rome for help in the bibliographic search.
Financial Support: This study was supported by Ministry of Education, University and Research-Scientific Independence of Young Researchers Grant RBSI141LY2 and University Grant RM11615505FAAB39.
Disclosure Summary: A.L. reports personal fees from Merck Sharp & Dohme, Novartis, Shire, Novo Nordisk, and Aegerion Pharmaceuticals. A.M.I. reports grants and personal fees from Shire, Novartis, and Ipsen. The remaining authors have nothing to disclose.
Abbreviations:
- BMI
body mass index
- DM
diabetes mellitus
- ES
effect size
- FFA
free fatty acid
- FPG
fasting plasma glucose
- FPI
fasting plasma insulin
- HbA1c
glycosylated Hb
- HDL-C
high-density lipoprotein cholesterol
- HOMA-β
homeostatic model assessment of pancreatic β-cell function
- HOMA-I
homeostatic model assessment of insulin resistance
- LDL-C
low-density lipoprotein cholesterol
- MD
mean difference
- OGTT
oral glucose tolerance test
- PEG
pegvisomant
- RCT
randomized controlled trial
- SSA
somatostatin analog
- TGD
triglyceride
- Total-C
total cholesterol
References
Author notes
T.F. and A.C. contributed equally to this study.
