


Abstract
Calcium and vitamin D treatment does not improve reduced quality of life (QOL) in hypoparathyroidism. Recombinant human (rh) PTH(1-84) therapy improves QOL metrics for up to 5 years. Data on QOL beyond this time point are not available.
To evaluate the effects of 8 years of rhPTH(1-84) therapy on QOL and factors associated with long-term benefit.
Prospective, open-label trial.
Referral center.
Twenty patients with hypoparathyoidism.
RAND 36-Item Short Form Health Survey (SF-36).
rhPTH therapy led to substantial improvement in five of the eight SF-36 domains [vitality, social functioning (SF), mental health (MH), bodily pain (BP) and general health] and three of these domains (SF, MH, BP) were no longer lower than the reference population. The improvement in the mental component summary (MCS) score was sustained through 8 years, while the physical component summary (PCS) score improved through 6 years. A lower baseline QOL score was associated with greater improvement. A threshold value <238 (MCS) and <245 (PCS) predicted long-term improvement in 90% and 100% of the cohort, respectively. In patients whose calcium supplementation was reduced, MCS and PCS scores improved more than those whose supplementation did not decline to the same extent. Improvement in PCS was greater in patients whose calcitriol dosage was reduced and duration of disease was shorter.
rhPTH(1-84) improves long-term well-being in hypoparathyroidism. The improvements are most prominent in those with impaired SF-36 at baseline and those whose requirements for conventional therapy decreased substantially.
Hypoparathyroidism is a rare disease characterized by hypocalcemia and absent or insufficient levels of parathyroid hormone. Standard treatment consists of calcium and active vitamin D supplementation. This standard therapy does not fully replace the functions of PTH and large doses of these supplements, which are often necessary, could be related to long-term complications (1–4). Clinical trials using human PTH(1-34) and recombinant human (rh) PTH(1-84) have demonstrated reduced requirements for calcium and vitamin D supplementation while safely maintaining serum calcium concentrations within the desired range (5–10). rhPTH(1-84) has been available for the treatment of hypoparathyroidism since 2015 in the United States and since 2017 in Europe. One important feature of hypoparathyroidism is reduced quality of life (QOL) as demonstrated in many studies utilizing the RAND 36-Item Short Form Health Survey (SF-36) scale and other metrics (11–14). We and others have previously shown that rhPTH(1-84) therapy is associated with improvement in QOL (15). Because there is no limit in duration of rhPTH(1-84) use in hypoparathyroidism, it is important to monitor these patients long term. In this report, we provide information on the effects of rhPTH(1-84) therapy on QOL in patients with hypoparathyroidism through 8 years of continuous, uninterrupted therapy.
Materials and Methods
Study design
We are conducting an open-label study of rhPTH(1-84) (NPS Pharmaceuticals, Bedminster, NJ/Shire Pharmaceuticals, Dublin, Ireland). The earliest subjects enrolled were initially treated with a dose of 100 μg every other day (16). Alternative dosing regimens of 25, 50, and 75 μg daily were used during the study period when made available to achieve a dose that optimally controlled the serum calcium while minimizing the need for calcium and active vitamin D supplementation. The study has been extended to track these subjects, who may remain on rhPTH(1-84) therapy indefinitely, long term.
Subjects
The diagnosis of hypoparathyroidism was established by a requirement for supplemental calcium and/or active vitamin D to maintain a sufficient serum calcium concentration along with PTH levels that were either undetectable or insufficient in the context of hypocalcemia. Hypoparathyroidism was present for at least 1 year defining the cohort as having chronic disease. All subjects were on stable regimens of supplemental calcium and/or vitamin D for at least 6 months before enrollment. Subjects were excluded if they: (i) had been treated with a bisphosphonate within 5 years or for more than six-month duration at any time; (ii) had been previously treated with PTH-analogues; (iii) were women within 5 years of menopause; and (iv) were using any of the following medications: estrogens, progestins, raloxifene, calcitonin, systemic corticosteroids, fluoride, lithium, statins, loop diuretics, or methotrexate. The following potentially confounding disorders were also exclusionary criteria: Paget disease of bone, diabetes mellitus, chronic liver or renal disease, acromegaly, Cushing syndrome, rheumatoid arthritis, or multiple myeloma.
Subjects were recruited from the Metabolic Bone Diseases Unit of Columbia University Medical Center and from the Hypoparathyroidism Association. The study was approved by the Institutional Review Board of Columbia University Medical Center. All subjects gave written informed consent.
This report comprises 20 patients who were described in the previous 1- and 5-year reports who have reached the 8-year time point with QOL assessments. Twenty-eight subjects discontinued the intervention within the 8-year period because of adverse events (depression, renal cancer, renal failure, vestibular neuritis, loss of bone density at the 1/3 radius, dizziness, gastrointestinal illness, headache), withdrawn consent (n = 7), loss to follow-up (n = 5), nephrolithiasis (n = 2), unrelated health issues (n = 3), logistics of travel (n = 2), and recovery of parathyroid hormone function (n = 2).
Biochemical evaluation
The average of two or three pretreatment serum calcium values was used for the baseline calcium value. Blood sampling was performed 24 hours after the last PTH injection for daily dosing or 48 hours after injection for every other day dosing. Biochemistries were measured by automated techniques. Normal ranges are provided in Table 1.
Baseline Characteristics of the Study Population
| Mean ± SE | Range (Median) | Normal Range | |
|---|---|---|---|
| Age | 44.9 ± 3 | 26–72 (45) | |
| Sex | 80% (16) | ||
| Female, postmenopausal | 44% (7) | ||
| Etiology | |||
| Postsurgical | 60% (12) | ||
| Idiopathic | 40% (8) | ||
| Duration of hypoparathyroidism, y | 25.7 ± 3 | 9–50 (18) | |
| Elemental calcium supplement dose, g/d | 2.9 ± 0.5 | 0–11 (2.4) | |
| Calcitriol supplement dose, μg/d | 0.8 ± 0.2 | 0–3.0 (0.5) | |
| Daily chole- or ergocalciferol vitamin D dose, IU/d | 11,722 ± 5865 | 0–50,000 (500) | |
| Serum calcium, mg/dL | 8.5 ± 0.2 | 6.9–10.1 (8) | 8.6–10.2 |
| PTH, pg/mL | <3–14 | 10–65 | |
| Undetectable | 90% (18) | ||
| Detectable | 10% (2) | ||
| Creatinine, mg/dL | 0.9 ± 0.04 | 0.4–1.1 (1) | 0.5–1.3 |
| Phosphate, mg/dL | 4.4 ± 0.2 | 3–6.7 (5) | 2.5-4.5 |
| Total alkaline phosphatase activity, U/L | 61.6 ± 2 | 48–82 (58) | 33–96 |
| Urinary calcium excretion, mg/d | 222.9 ± 22 | 99–368 (215) | 50–250a |
| 25-hydroxyvitamin D, ng/mL | 77.6 ± 29 | 26–77 (44) | 30–100 |
| 1,25-dihydroxyvitamin D, pg/mL | 47.4 ± 7 | 20–99 (37) | 15–60 |
For men, 50–300.
QOL evaluation
The SF-36 (version 1.0) was developed as part of the Medical Outcomes Study (17). It consists of 36 items covering 8 domains of physical and mental health: physical functioning (PF), role limitations caused by physical health problems (RF), bodily pain (BP), perception of general health (GH), vitality (VT), social functioning (SF), role limitations caused by emotional health problems (RE), and mental health (MH). Scores are normalized to a scale of 0 to 100. Higher scores indicate more favorable physical functioning and psychological well-being. The 8 domains are further grouped into two summary measures: the physical component summary (PCS) comprises PF, RF, BP, and GH and the mental component summary (MCS) comprises VT, SF, RE, and MH (17). Subjects were measured at baseline and after treatment with rhPTH(1-84) at months 0, 12, 24, 36, 48, 60, 72, 84, and 96.
Statistical analysis
A linear mixed-effect model for repeated measures approach was used for comparisons of QOL measures longitudinally across all time points. This method accounts for the within-person correlation of repeated measures. We assessed the predictive value for each of the following variables in the mixed-effects model for the longitudinal trends in the QOL with treatment: age, calcium dose, calcitriol dose, PTH dose, duration of disease, etiology of hypoparathyroidism, serum calcium, and serum phosphate. These standard measures of QOL were also compared with the US reference population using t tests (18). We then stratified our cohort into three groups: subjects with improvement of both MCS scores and PCS scores at 8 years; subjects without improvement in either of these summary quality of life measures at 8 years; subjects with improvement in only one of the summary scores. The χ2 test or Fischer exact test was used for between-group comparisons for categorical variables and independent t tests for between-group comparisons for continuous variables. The ability of the baseline PCS and MCS to discriminate between the groups with and without improvement was evaluated with receiver operating characteristic curves to calculate area under the curve (AUC) and to determine the sensitivity and specificity of the optimal threshold. The threshold for both the PCS and MCS was validated in our 1- and 4-year cohorts of rhPTH(1-84) treatment in hypoparathyroidism. Correlations between duration of disease and QOL measures were assessed by the Spearman correlation test. All statistical tests were two-tailed and P < 0.05 was considered significant. Statistical software R version 3.3.2 (http://www.r-project.org/) and SPSS 23.0 for Windows (IBM Corp., Armonk, NY) were used for the analyses. Data for categorical variables are presented as frequencies and percentages. Data are presented as mean ± SE for continuous variables.
Results
Baseline characteristics
Table 1 shows the baseline characteristics for the 20 patients with hypoparathyroidism. The mean age was 49 ± 3 years (range, 26 to 72 years). Women comprised 80% of the group, consistent with the demographics of the disease. The etiologies of hypoparathyroidism were surgical (60%) and idiopathic (40%). The mean duration of hypoparathyroidism was 26 ± 3 years (range, 9 to 50 years). Baseline characteristics did not differ between those who reached the 8-year time point (n = 20) and the group that did not (n = 49). Specifically, there were no differences in age, sex, duration of disease, calcium and calcitriol supplementation, serum calcium, phosphate, 25-hydroxyvitamin D, 1,25-dihydroxyvitamin D, urinary calcium excretion, and creatinine levels. Baseline MCS and PCS scores for the SF-36 did not differ between those who did or did not reach the 8-year time point. Furthermore, there were no differences in concomitant medications and frequency of hypocalcemic symptoms.
Biochemical evaluation and adherence to treatment
Baseline biochemistries are shown in Table 1. Most subjects maintained serum calcium values of at least 8.0 mg/dL throughout the study period (75% at baseline, ranging from 60% to 84.3% throughout the 8 years). Hypercalcemia was rare (2% of all measured values) and no patient required hospitalization. Compliance with rhPTH(1-84) treatment was excellent (97.7 ± 7.3% at 8 years).
QOL evaluation
Results of the SF-36 survey at baseline before initiation of rhPTH(1-84) and through 8 years of rhPTH(1-84) therapy are shown in Table 2.
QOL Through the Study Period
| Baseline | 1 y | 2 y | 3 y | 4 y | 5 y | 6 y | 7 y | 8 y | |
|---|---|---|---|---|---|---|---|---|---|
| PF | 72.3 ± 4.5 | 76.5 ± 5.4 | 81.8 ± 3.8a | 76.5 ± 5 | 76.3 ± 5.2 | 79.5 ± 4.8 | 80.3 ± 4.3 | 74.8 ± 6.2 | 73 ± 6.3 |
| RF | 52.5 ± 8.1 | 62.5 ± 8.6 | 65 ± 8.6 | 68.8 ± 7.8 | 73.8 ± 7.9a | 70 ± 8.4 | 62.5 ± 8.4 | 61.3 ± 8.6 | 61.3 ± 9.7 |
| RE | 63.3 ± 9.6 | 80 ± 6.6 | 73.3 ± 8.6 | 70 ± 9 | 71.66 ± 8.1 | 83.3 ± 6.6a | 71.7 ± 8.4 | 76.6 ± 7.7 | 71.7 ± 8.8a |
| VT | 35 ± 5 | 50.5 ± 4.8b | 49.3 ± 4.2b | 48.8 ± 4.3b | 49 ± 4.3b | 50.3 ± 5.1b | 48 ± 5.4b | 46.3 ± 5.7b | 45.3 ± 5.6a |
| MH | 60 ± 4.4 | 71.4 ± 4.1b | 70.4 ± 3.8b | 73.2 ± 3.4b | 66 ± 4.3 | 71.4 ± 3.9b | 70.4 ± 4.3b | 69.8 ± 3.92a | 71.2 ± 4b |
| SF | 63.1 ± 5.3 | 75.6 ± 4.9b | 71.9 ± 4.9 | 75.6 ± 4.7b | 72.4 ± 6.0a | 80 ± 5.6b | 75 ± 5.7a | 80.6 ± 5.6b | 78.1 ± 5.2b |
| BP | 55.1 ± 5 | 65.1 ± 5a | 74.5 ± 4.1b | 69.8 ± 5.9b | 66.1 ± 5.4a | 70.3 ± 5.9b | 68.1 ± 5.6b | 64.5 ± 6a | 66.9 ± 6.3a |
| GH | 48.5 ± 4.3 | 64.3 ± 4.7b | 62.5 ± 4.1b | 61.8 ± 4.2b | 58.3 ± 4.5b | 61.5 ± 4.2b | 60.8 ± 5b | 58.8 ± 3.9b | 57.5 ± 4.7b |
| PCS | 228.4 ± 16.3 | 265.4 ± 19.6a | 283.8 ± 16.2b | 276.8 ± 18b | 274.4 ± 16.5b | 281.3 ± 19.4b | 271.6 ± 20.3b | 259.3 ± 19.7 | 258.6 ± 22.1 |
| MCS | 221.5 ± 18.2 | 275 ± 14.7b | 264.8 ± 16.6a | 267.5 ± 16.7b | 259 ± 20a | 285 ± 16.3b | 270 ± 20.7b | 273.3 ± 19.6b | 266.2 ± 19b |
P < 0.05.
P < 0.01 vs baseline.
MCS and PCS scores improved substantially within 1 year from initiating therapy with rhPTH(1-84). MCS scores increased from 221.5 ± 18 at baseline to 275.0 ± 15 at 1 year (P = 0.002) whereas PCS scores increased from 228.4 ± 16 at baseline to 265.4 ± 20 at 1 year (P = 0.01). The improvement in MCS persisted through 8 years of treatment and was substantially higher than baseline at that latest time point (266.2 ± 19, P = 0.009). PCS scores improved substantially through 6 years of therapy and trended higher than baseline at year 7 (259.3 ± 20, P = 0.053) and year 8 (258.6 ± 22, P = 0.059; Fig. 1). Three of the four domains of the MCS score (VT, SF, MH) and two of the four domains of the PCS score (BP, GH) were consistently and substantially higher than baseline throughout the study duration (Table 2). Three domains (MH, SF, GH) increased more at one, five, and 8 years (P < 0.01 compared with baseline; Table 2).
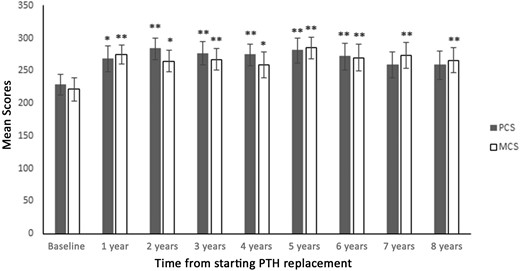
QOL throughout the study period (*P < 0.05 vs baseline; **P < 0.01 vs baseline).
Comparison with reference population
At baseline, all eight domains of the SF-36 score in our cohort with hypoparathyroidism were substantially lower than the normal population (Fig. 2). Of the five domains (VT, SF, MH, BP, GH) that showed substantial improvement after 8 years of rhPTH(1-84) treatment, three of these domains (MH, SF, BP) were no longer lower than the reference population (SF: 78.1 ± 5 vs 83.6 ± 1, P = 0.15; MH: 71.2 ± 4 vs 74.8 ± 0.4, P = 0.18; BP: 66.9 ± 6 vs 75.5 ± 0.5, P = 0.09; Fig. 2).

Normative data, baseline and 8-year scores for the eight domains of SF-36 index (*P < 0.05 vs reference population; **P < 0.01 vs reference population; †P < 0.05 vs baseline; ††P < 0.01 vs baseline).
Comparison between patients with improvement of QOL vs those without
Baseline PCS and MCS scores were substantially lower in patients who showed improvement in both MCS and PCS scores at 8 years (n = 11) than in those who did not (n = 4) (PCS: 196.6 ± 64 vs 303.8 ± 52, P = 0.01, MCS: 183.9 ± 69 vs 278.7 ± 76, P = 0.04). Baseline RF and GH domains of the PCS score were lower (RF: 29.6 ± 29 vs 87.5 ± 14, P = 0.002; VT: 28.2 ± 16 vs 56.3 ± 28, P = 0.03; Fig. 3) and the baseline VT domain of the MCS score was lower (GH: 46.4 ± 17 vs 67.5 ±13, P = 0.04) in the group that improved vs those without improvement. At baseline, there were no substantial differences in age, doses of calcium and calcitriol supplementation, rhPTH(1-84) dose, serum calcium, or serum phosphate levels between patients with and without improvement.
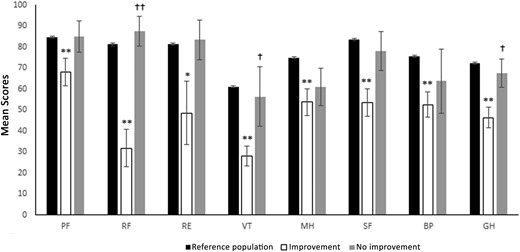
Normative data and baseline scores in patients with and without substantial improvement for the eight domains of SF-36 index (*P < 0.05 compared with reference population; **P < 0.01 compared with reference population; †P < 0.05 compared with the improvement group; ††P < 0.01 compared with the improvement group).
The group with improvement in both MCS and PCS showed a substantially lower score in all eight individual domains compared with the reference population. In contrast, for the group that did not improve, one or more of the individual domains was not substantially different from the reference population (Fig. 3).
In the receiver operating characteristic analysis, baseline MCS score had an AUC of 0.864 (CI: 0.663 to 1.000; P = 0.04). A threshold value <238 distinguished between those with improvement in QOL and those without after 8 years of rhPTH(1-84) therapy with a sensitivity of 81.8% and a specificity of 75.0%.
For baseline PCS score, the AUC was 0.909 (CI: 0.754 to 1.000; P = 0.02). A threshold value <245 distinguished between those with improvement in QOL and those without after 8 years of rhPTH(1-84) therapy with a sensitivity of 81.8% and specificity of 100.0%.
Therefore, a baseline MCS <238 predicted with 90% accuracy patients who improved in both MCS and PCS at the 8-year time-point. A baseline score above this value had a predictive value of nonimprovement of 60%. Similarly, a baseline PCS score <245 could predict with 100% accuracy those who would show improvement in both MCS and PCS at the 8-year time-point. A baseline score above this value had a predictive value of nonimprovement of 67%.
Validation in 1- and 4-year cohorts
We applied these thresholds in larger cohorts with chronic hypoparathyroidism treated with rhPTH(1-84) and with SF-36 assessment after 1 year (n = 56) (14) and 4 years (n = 26) (19).
In the 1-year cohort we found that baseline MCS or PCS below the thresholds predicted individuals with improvement in both MCS and PCS, with 79% and 81% accuracy, respectively.
In the 4-year cohort, a baseline MCS or PCS below the thresholds could predict 80% who would show improvement in both MCS and PCS at 4 years of therapy (Table 3).
Validation of PCS and MCS Thresholds in 1-Year and 4-Year Cohorts
| Threshold | Predicted Improvement in MCS and PCS | Threshold | Predicted Nonimprovement in MCS and PCS | |
|---|---|---|---|---|
| 1-year cohort (n = 56) | ||||
| Baseline MCS | <238 | 79% | ≥238 | 50% |
| Baseline PCS | <245 | 81% | ≥245 | 88% |
| 4-year cohort (n = 26) | ||||
| Baseline MCS | <238 | 80% | ≥238 | 50% |
| Baseline PCS | <245 | 80% | ≥245 | 50% |
Effect of duration of disease
There was a positive and strong correlation between duration of disease and baseline PCS score (r = 0.611, P = 0.004) but not between duration of disease and baseline MCS score (r = 0.253, P = 0.281). There was an inverse relation between duration of disease and the percent change in PCS score at 8 years from baseline (r = −0.560, P = 0.01) but not between duration of disease and percent change in MCS score (r = −0.258, P = 0.272). The group with improvement in QOL at 8 years had a shorter disease duration (20 ± 12 years) than the group that did not show improvement (41 ± 16 years, P = 0.02).
Effect of calcium and calcitriol dose reduction
There was an inverse relation between calcium dosage and both PCS and MCS. For every 1000 mg decrease in calcium supplement dosage during rhPTH(1-84) therapy, there was an improvement in PCS by 12 numerical points (P < 0.01) and MCS by 9 points (P = 0.02). There was an association between calcitriol dosage and PCS but not MCS. For every 1 µg reduction in calcitriol supplementation, there was an improvement in PCS by 28 points (P = 0.01) There were no associations between PCS or MCS scores and age, sex, etiology, dose of rhPTH(1-84) therapy, serum phosphate, and serum calcium.
Discussion
We investigated the effect of rhPTH(1-84) therapy on QOL in individuals with hypoparathyroidism through 8 years using the SF-36 and confirmed the long-term efficacy of rhPTH(1-84) in improving QOL.
Prior to treatment with rhPTH(1-84), QOL measures are compromised in patients with hypoparathyroidism compared with normal subjects (14, 20). Patients with hypoparathyroidism treated with conventional therapy score substantially lower than the normative reference range in all domains of mental and physical health. Treatment with conventional therapy does not restore well-being by this QOL scale despite maintaining calcium and phosphate balance within the therapeutic range (12, 21). On the other hand, our group has shown, both in this study and previously, that rhPTH(1-84) therapy is associated with an improvement in QOL through 1 year, 5 years, and now 8 years of continuous therapy with rhPTH(1-84). The MCS score improved in the entire cohort within the first year of therapy and this improvement persisted through the 8 years. PCS scores also improved within the first year and this improvement persisted statistically through 6 years with near significant trends at 7 and 8 years. At 8 years, five of the eight domains were better with treatment. Of the five domains that were improved at year 8, it is further noteworthy that for three of these domains (MH, SF, BP), the values were no longer different from normal subjects.
The MH component of the SF-36 survey is a standardized measure to quantify general mental health, with a low score reflecting psychological distress and high scores reflecting psychological well-being (17). The low MH scores in our study vis-a-vis calcium and vitamin D supplementation at baseline are consistent with existing studies (22, 23) whereas the reversibility of the MH scores with replacement of rhPTH(1-84) in the long term may suggest a direct or indirect role of PTH in psychological health. This is conceivable because there are data that suggest actions of PTH itself on neurocognitive function. Evidence for this includes the observation that PTH is able to cross the blood–brain barrier (24) in humans and that it is can activate human PTH2 receptors that are abundant in the brain (25). These PTH2 receptors in the brain have been linked to areas involved in regulation of anxiety and depression in animal studies (26, 27).
The BP domain addresses the perception of bodily pain and its limitations on daily functioning (17). Musculoskeletal complaints are characteristic features of hypocalcemia. Even with conventional therapy, the majority of patients with hypoparathyroidism frequently experience physical symptoms such as fatigue, muscle cramps, paresthesias, tetany, joint, or bone pain (28). Large doses of supplemental calcium and vitamin D are typically necessary to prevent patients with hypoparathyroidism from becoming symptomatically hypocalcemic. In this study, a reduction in calcium supplement dose was associated with an improvement in the BP domain (P < 0.01). The restoration in measures in the BP domain with rhPTH(1-84) replacement may reflect a reduction in calcium variability or be directly related to a neurocognitive effect of rhPTH(1-84) therapy.
Baseline QOL scores and duration of disease predicted the change in QOL in response to treatment. The higher QOL scores among those with longer disease duration may reflect the psychological adjustment that humans often make when dealing with a chronic disease. With higher baseline scores, they might not be expected to show dramatic improvements with a different therapeutic approach. In contrast, patients with a lower baseline score and shorter duration of disease were more likely to experience an improvement in QOL. This is consistent with a recent analysis from the REPLACE clinical trial of rhPTH(1-84) study that showed an inverse relation between baseline score and magnitude of change at 24 weeks (15). Furthermore, when we stratified the group for patients who did not show improvement in their QOL, baseline QOL scores were no different from the normal population. In contrast, patients who showed improvement in QOL had impaired performance in all measured domains. These results may help guide clinicians when faced with the decision to consider rhPTH(1-84) therapy in patients with chronic hypoparathyroidism. Our findings help to corroborate recently published guidelines that recommend reduced QOL as an indication for use of rhPTH(1-84) therapy in hypoparathyroidism (29). As noted in the guidelines, however, there are other reasons for considering rhPTH(1-84) in hypoparathyroidism in addition to impaired QOL. Thus, patients who might score well in a QOL survey may still be serious candidates for rhPTH(1-84) by meeting other guidelines.
In this study, we sought to identify clinical QOL thresholds that could be used to define a treatment algorithm for rhPTH(1-84) therapy. Identification of such thresholds would aid clinicians when faced with the most appropriate therapeutic options in management of hypoparathyroidism. A PCS threshold <245 could predict an improvement in QOL with use of rhPTH(1-84) replacement in 100% of patients at 8 years and 80% of patients at 4 years and 1 year. Similarly, a MCS threshold <238 prior to initiating rhPTH(1-84) therapy was able to predict an improvement in QOL in 90% of patients at 8 years and 80% of patients at 4 years and 1 year.
We previously showed that 6 years of rhPTH(1-84) therapy progressively reduced supplemental calcium and 1,25-dihydroxyvitamin D requirements by 53% and 67%, respectively (7). The reduction in calcium dosage was associated with an improvement in both PCS and MCS scores whereas a reduction in calcitriol was associated with an improvement with PCS in this study. The reduced requirements for standard therapy and the associated improvement are thus inherently related to rhPTH(1-84) use.
Open label studies from our group (14, 19) and others (10, 13) have consistently shown the improvement of QOL measures with use of either rhPTH(1-84) or PTH(1-4). These studies contrast a Danish randomized control trial in which rhPTH(1-84) did not improve QOL compared with placebo at 6 months. One possibility is that hypercalcemia occurred more frequently in the treatment group, which may have negated any potential advantage of rhPTH(1-84) in that study. Another possibility is the relatively higher QOL scores at baseline. Indeed, the MCS score was not different from normative controls and this could have accounted for the lack of response. Third, the amounts of calcium and active vitamin D were only reduced when hypercalcemia occurred. It is plausible that the absence of a decrease in standard therapy requirements negated the potential benefit of rhPTH(1-84) therapy. Recently, results from the REPLACE study (15) showed that QOL in patients randomly assigned to rhPTH(1-84) therapy was not substantially better than those randomly assigned to placebo at 24 weeks overall but relative to the subjects’ baseline, those who received rhPTH(1-84) did show substantial improvements. Of note, in REPLACE, when stratifying the analysis by region, patients from North America and Western Europe showed improved QOL compared with placebo whereas those from the Hungarian sites did not. Baseline QOL scores were higher in the Hungarian cohort than the North American and Western European groups, substantiating our observations with regard to the predictive value of baseline QOL measures.
The strength of this study is the well-characterized cohort with chronic hypoparathyroidism with longitudinal follow-up through 8 years. Although the sample size was small, this cohort with long-term data on QOL with rhPTH(1-84) use is unique. A limitation is the potential bias from including only subjects who continued therapy, but the similarity in baseline characteristics among those who did or did not follow through for the entire 8 years is reassuring in this regard and argues against selection bias. The absence of a placebo control is also a limitation, although again the persistence of the findings through 8 years weighs against the likelihood of the placebo effect. Furthermore, within the treatment group, we were able to define markers (e.g., duration of disease, baseline QOL, and extent of supplement reduction) that predicted improvement in QOL or lack thereof. A placebo effect would not be expected to permit these kinds of distinctions within the treatment group. In conclusion, the results of this study show the long-term efficacy of rhPTH(1-84) in improving well-being in patients with chronic hypoparathyroidism. The improvements were more prominent in those whose baseline SF-36 levels were impaired. Baseline MCS and PCS scores could predict the improvement in QOL. A decrease in calcium and active vitamin D requirements was associated with an improvement in well-being. The results may be useful for clinicians in their decision-making for patients with hypoparathyroidism.
Abbreviations:
- AUC
area under the curve
- BP
bodily pain
- GH
general health
- MCS
mental component score
- MH
mental health
- PCS
physical component score
- PF
physical functioning
- QOL
quality of life
- RE
role limitations due to emotional health problems
- RF
role limitations caused by physical health problems
- rh
recombinant human
- SF
social functioning
- SF-36
RAND 36-Item Short Form Health Survey
- VT
vitality
Acknowledgments
Financial Support: This study was funded by National Institutes of Health DK 06950 (to J.P.B., N.E.C., M.R.R); Food and Drug Administration FDA 002525 (to J.P.B.); National Institutes of Health DK32333 (to J.P.B., N.E.C., M.R.R.); and Shire Pharmaceuticals (to N.E.C., M.R.R., J.P.B.).
Disclosure: J.P.B. is a consultant for Amgen, Radius, Ultragenyx, Regeneron, and Shire. N.E.C. is on the speaker’s bureau for Shire. M.R.R. receives research support from Shire and Amgen. The remaining authors have nothing to disclose.
References
Author notes
G.T. and Y.-K.D.T. contributed equally to this work.
