


Abstract
Glucagon-like peptide-1 (GLP-1) is an incretin hormone used therapeutically in type 2 diabetes and obesity. The interplay between ambient free fatty acids (FFAs) and GLP-1 remains unclear. Acipimox suppresses adipose tissue lipolysis via activation of the PUMA-G (also known as HCA2 and GPR109a) receptor.
To investigate whether lowering of serum FFA level with acipimox affects GLP-1 secretion.
Two randomized crossover studies were performed in human subjects. Rat intestine was perfused intra-arterially and intraluminally, and l-cells were incubated with acipimox.
The participants were healthy overweight subjects and hypopituitary adult patients.
The overweight participants received acipimox 250 mg 60 minutes before an oral glucose test. The hypopituitary patients received acipimox 250 mg 12, 9, and 2 hours before and during the metabolic study day, when they were studied in the basal state and during a hyperinsulinemic euglycemic clamp.
Acipimox suppressed FFA but did not affect insulin in the clinical trials. In overweight subjects, the GLP-1 increase after the oral glucose tolerance test (area under the curve) was more than doubled [4119 ± 607 pmol/L × min (Acipimox) vs 1973 ± 375 pmol/L × min (control), P = 0.004]. In hypopituitary patients, acipimox improved insulin sensitivity (4.7 ± 0.8 mg glucose/kg/min (Acipimox) vs 3.1 ± 0.5 mg glucose/kg/min (control), P = 0.005], and GLP-1 concentrations increased ~40%. An inverse correlation between FFA and GLP-1 concentrations existed in both trials. In rat intestine, acipimox did not affect GLP-1 secretion, and l-cells did not consistently express the putative receptor for acipimox.
Acipimox treatment increases systemic GLP-1 levels in both obese subjects and hypopituitary patients. Our in vitro data indicate that the underlying mechanisms are indirect.
Glucagon-like peptide-1 (GLP-1) is secreted from enteroendocrine l-cells in the intestinal epithelium in response to various macronutrients including luminal glucose (1), protein hydrolysates (2), and luminal and vascular lipids (3, 4). Indeed, a variety of short-chain and long-chain fatty acids directly stimulate GLP-1 secretion in several nonhuman, experimental models (4–8) via mechanisms involving free fatty acid (FFA)-sensitive G-protein coupled receptors (FFARs) (9). GLP-1 in turn stimulates insulin secretion and inhibits gastric emptying, and analogs of GLP-1 are used to treat type 2 diabetes (T2D). Moreover, strategies to increase the endogenous production and secretion of GLP-1 are currently being investigated (9).
Circulating FFAs are assumed to play a causal role in the pathogenesis of hepatic and peripheral insulin resistance (10–13), which are hallmarks of T2D (5). Acipimox is a nicotinic acid analog that binds to and activates the protein upregulated in macrophages by interferon-γ (PUMA-G) receptor (14) [mammal equivalent HCA2 (15), also known as GPR109a], resulting in inhibition of the hormone-sensitive lipase and thereby suppression of lipolysis and reduced circulating levels of FFAs and triglycerides (16). Acipimox also improves insulin sensitivity in obese patients (17) by mechanisms that presumably depend on the lipid-lowering actions. A recognized challenge when performing and interpreting acipimox studies is a rebound increase in FFA levels induced by feedback stimulation of GH and ACTH (18), which can be circumvented by studying hypopituitary subjects on stable replacement with GH and hydrocortisone (19).
Because the impact of circulating FFA levels on GLP-1 concentration remains unclear, we tested acute and prolonged effects of acipimox on basal and glucose-stimulated GLP-1 concentration in hypopituitary patients and obese subjects. This testing was followed by in vitro studies using an isolated perfused rat small intestine model and a GLP-1 secreting cell line.
Research Design and Methods
Clinical studies
Two in vivo studies in human subjects were conducted in accordance with the Helsinki Declaration, where all subjects gave their oral and written informed consent to participate. The regional Ethics Committee System approved both study protocols, and protocol 2 was also approved by the Danish Medicines Agency. The protocols were registered at ClinicalTrials.gov [nos. NCT02796950 (submitted 27 May 2016) and NCT01209416 (submitted September 2010)] before the onset of enrollment.
Subjects
Study 1.
Eight overweight but otherwise healthy men with a mean ± SE age of 30 ± 3 years and a body mass index of 30.0 ± 0.7 kg/m2 participated.
Study 2.
The subjects in study 2 were eight hypopituitary men, mean age 53 ± 5 years, with a mean body mass index of 30.3 ± 4.6 kg/m2, on stable replacement therapy with hydrocortisone and GH, as previously described (20). Mean circulating hemoglobin A1c levels at screening were 5.5% ± 0.1% (37 ± 1 mmol/mol). None of the patients had diabetes or any other concomitant chronic disease.
Study protocols
All participants were examined on two occasions separated by ≥2 weeks. After an overnight fast, the subjects were studied in a quiet, thermoneutral indoor environment in the supine position. The subjects fasted during the trials.
Study 1.
At the onset of the study, an IV cannula was inserted into a dorsal hand vein for frequent blood sampling. The hand was wrapped in a heat pad to obtain arterialized venous blood samples. In a randomized, nonblinded study the participants were studied twice after an overnight fast receiving either one oral acipimox dose of 250 mg at t = 0 (acipimox) or no medication (including placebo) (control). After 60 minutes (t = 60) an oral glucose tolerance test (OGTT) with 75 g of glucose solution was performed. Blood sampling was conducted every 15 minutes from t = 0 to 240 minutes.
Study 2.
All patients continued replacement therapy with GH and hydrocortisone during the study; GH was administered subcutaneously at 22.00 hours. Before the metabolic study day, and hydrocortisone was administered at 08.00 hours on the metabolic study day with the patient’s regular replacement dose. Each subject underwent two interventions receiving either acipimox or placebo (control) in a double-blind crossover design. Four doses of oral acipimox capsules (250 mg) or placebo were administered, of which two doses were administered at 20.00 and 23.00 hours on the evening before, and two doses were administered at 06.00 and 10.00 hours on the day of the metabolic study.
The metabolic studies were performed between 08.00 and 13.00 hours (0 to 300 minutes). The subjects were studied in the basal postabsorptive state (“basal”) for 120 minutes, followed by a hyperinsulinemic/euglycemic clamp (“clamp”) for 180 minutes, during which they received a constant infusion of insulin (0.6 mU/kg/min; Actrapid, Novo Nordisk, Gentofte, Denmark). During the insulin infusion, we clamped plasma glucose at 5.0 mmol/L by adjusting the rate of infusion of 20% glucose according to plasma glucose measurements carried out every 10 minutes. Insulin sensitivity was estimated by the glucose infusion rate (GIR) during the last 30 minutes of the clamp. Additional blood samples were drawn every 30 minutes and analyzed for insulin, C-peptide, GLP-1, and FFA. Clamp data from this study not including GLP-1 or GIP measurements have previously been published (20).
Animal and cell studies
The studies were conducted with permission from the Danish Animal Experiments Inspectorate (2013-15-2934-00833) and the local ethics committee in accordance with the guidelines of Danish legislation governing animal experimentation (1987) and the National Institutes of Health (publication number 85-23).
Isolated perfused rat intestine procedure
Male Wistar rats were obtained from Janvier (Saint Berthevin Cedex, France), housed two per cage with ad libitum access to standard chow and water and kept on a 12:12-hour light-dark cycle. Animals were allowed ≥1 week of acclimatization. On the respective day of study, nonfasted rats (mean ± SE weight 443 ± 28 g) were anesthetized by a subcutaneous injection with Hypnorm/midazolam and placed on a heated table (37°C), and the abdomen was opened by a midline insertion. The entire large intestine was removed after ligation of the supplying vasculature, and the small intestine (left in situ) was perfused (7.5 mL/min) with a modified Krebs-Ringer buffer through a catheter inserted in the upper mesenteric artery. Immediately after insertion of the first catheter, a second catheter was inserted into the portal vein to collect perfusion effluent. As soon as proper perfusion flow was established, the rat was euthanized by diaphragm perforation. The Krebs-Ringer buffer contained in addition 0.1% (w/v) BSA (fraction V; cat. no. 1.12018.0500, Merck, Ballerup, Denmark), 5% (w/v) dextran T70 to balance osmolarity (Pharmacosmos, Holbaek, Denmark), and 5 mM pyruvate, fumarate, and glutamate and 10 µM 3-isobutyl-1-methylxanthine (IBMX, cat. no. I5879, Sigma Aldrich), 3.5 mM glucose. Before infusion, the buffer was pH adjusted to 7.4 to 7.5 and bubbled with 95% O2, 5% CO2 to maximally elevate the O2 concentration and ensure a pH of ~7.3 to 7.4 (monitored throughout). A UP100 Universal Perfusion System from Hugo Sachs (Harvard Apparatus, March Hugstetten, Germany) was used, which ensured that the perfusion buffer was 37°C when reaching the organ. The preparation was allowed to stabilize for 25 minutes before collection of the first sample. Thereafter samples were collected each minute and instantly transferred onto ice before being stored at −20°C until hormone analysis (within 2 weeks). Vascular test stimulus was administered intra-arterially (into the upper mesenteric artery) and consisted of acipimox (200 µM, cat. no. A7856, Sigma Aldrich), niacin (cat. no. 1461003-200MG, Sigma Aldrich), 3-hydroxybuturate (cat. no. 226491-5G, Sigma Aldrich), or bombesin acetate salt hydrate (positive control, 10 nM, cat. no. B4272, Sigma Aldrich), all prepared in perfusion buffer and adjusted to pH 7.4 to 7.5. In separate experiments, acipimox (200 µM) was prepared in isotonic saline and administered intraluminally at an initial rate of 2.5 mL/min for 5 minutes, followed by a flow rate of 0.5 mL/min for the remainder of the stimulus period. The bolus administration was included to rapidly replace the isotonic saline present in the lumen at start of stimulation. At the end of stimulation, a similar bolus of isotonic saline was administered, followed by a flow of 0.5 mL/min for the remainder of the experiment. In all experiments, bombesin was added intra-arterially at the end of the protocols to control for responsiveness of the perfused preparation. The methods are described in more detail elsewhere (1). Group sizes were five to seven.
GLUTag cell studies
GLUTag cells (21) were kindly provided by Prof. Dan J. Drucker (Lunenfeld-Tanenbaum Research Institute, Mount Sinai Hospital, Toronto, ON, Canada). Cells were grown at 37°C, 5% CO2 in Nucleon-coated T75 flasks (cat. no. EW-01930-54, Thermo Fisher Scientific, MA) using low-glucose (1.0 g/L) DMEM medium (cat no. 6046, Sigma-Aldrich, Brøndby, Denmark) supplemented with 10% (v/v) fetal bovine serum and 1% (v/v) penicillin (10,000 U/mL)/streptomycin (10,000 μg/mL) (both from Sigma Aldrich) and GlutaMAX (cat. no. 35050061, Gibco, Life Technologies Corporation, CA). Cells were stripped and replated when they reached 70% to 80% confluence. Approximately 18 to 24 hours before secretion experiments, cells were plated onto 24-well plates precoated with matrigel basement membrane (cat. no. 354234, BD Biosciences, Kongens Lyngby, Denmark). On the next day, the now attached and ~80% confluent cells were thoroughly washed with isotonic saline (37°C) and incubated for 2 hours with buffer alone (baseline) or test stimulus prepared in buffer. Supernatants were obtained and centrifuged (1500g, 4°C, 5 minutes) to remove potential floating cells of debris. The resulting supernatants were transferred to fresh Eppendorf tubes, and samples were stored at −20°C until analysis. Test stimulus consisted of 0.1, 1, 10, or 100 mM sodium hydroxybutyrate (cat no. 54965, Sigma Aldrich) or 10 mM glucose + 10 µM forskolin (cat. no. F3917, Sigma Aldrich) 10 μM IBMX (3-Isobutyl-1-methylxanthine, Cat. no. I5879, Sigma Aldrich). The buffer contained 138 mM NaCl, 4.5 mM KCl, 4.2 mM NaHCO3, 1.2 mM NaH2PO4, 2.5 mM CaCl2, 1.2 mM MgCl2, and 10 mM HEPES supplemented with 0.1% (w/v) fatty acid-free BSA (cat. no. A-603-10G, Sigma-Aldrich). Before secretion experiments, the buffer was pH calibrated to 7.4.
Cell sorting and RNA sequencing
Single cell digestion and cell sorting.
l-Cells from three different regions of the gastrointestinal tract were isolated as previously described (22). In brief, the top and bottom 10 cm of the small intestine and the colon plus rectum were harvested from Glu-Venus mice euthanized by cervical dislocation (UK Home Office license 70/7824) and washed with cold PBS, and the muscle layer was removed. Tissue was sliced and digested into single cells with 1 mg/mL collagenase, and single cells, after filtering with a 50 μm filter, were sorted on a JAZZFacs at the Cell Phenotyping Hub, Cambridge, UK. A total of 20,000 negative and 2000 to 10,000 positive cells were directly collected into lysing solution (RLT+ buffer with 1% β-mercaptoethanol) and RNA extracted with a micro plus RNeasy kit (Qiagen, Manchester, UK). RNA quality (>6) and concentration were checked on Bioanalyzer (Agilent).
Library construction and sequencing.
We used 2 ng of RNA from each sample for cDNA amplification with an Ovation RNAseq system V2 kit (Nugen, Redwood City, CA) and after fragmentation to ~200 bp (Diagenode sonicator), and adaptors for indexing were added (Ovation rapid DR multiplex1-96, Nugen). Samples were pooled and single-end 50 bp sequenced at the Genomic Core, CRUK Cambridge, UK with an Illumina Hiseq4000 system (San Diego, CA). Sequence reads were demultiplexed with the Cava pipeline (Illumina) and aligned to the mouse genome (GRCm38) in Top Hat version 2.1.0, and raw counts were obtained via Cufflinks version 2.2.1. Data were then normalized and differential expression assessed in DESeq2 (https://bioconductor.org/) (23).
Biochemical analyses
Plasma glucose was analyzed bedside via the glucose oxidase method (YSI 2300 STAT Plus; YSI Life Sciences, Yellow Springs, OH) whereas serum and plasma samples for other metabolites and hormones were frozen and stored at −20°C or at −80°C (glucagon, GIP, and GLP-1). Serum FFA was analyzed with a commercial kit (Wako Chemicals, Neuss, Germany). Serum GH was analyzed via chemiluminescence technology (IDS-iSYS Multi-Discipline Automated Analyzer, Immunodiagnostic Systems Nordic a/s Herlev, Denmark). Serum insulin was analyzed via time-resolved fluoroimmunoassay assay (AutoDELFIA Insulin kit, cat. no. B080-101, Perkin-Elmer, Turku, Finland). Samples for GIP and GLP-1 were drawn into EDTA- and aprotinin-containing chilled tubes (400 kallikrein inhibitor units per milliliter blood; Bayer, Leverkusen, Germany) and kept on ice. Plasma total GIP and GLP-1 were analyzed as previously described (24, 25). GLP-1 secretion from the perfused intestine and GLUTag cells was measured with the same RIA for total GLP-1 [measuring intact peptide + the primary metabolite GLP-1 (9–36 amide)] with antiserum code no. 89390, recognizing the amidated C-terminus of the molecule, as described previously (26). Because the gut was perfused at a constant rate, concentrations parallel output (i.e., secretion). The choice of targeting the amidated (x-36 amide) rather than the glycine extended (x-37) isoform was based on a recent study showing that GLP-1 is predominantly amidated in rats (27). The experimental detection limit was 1 pM, and the intra-assay coefficient of variation of 6%.
Statistical analysis
Results are expressed as mean ± SEM. The statistical analyses were performed in SigmaPlot 11.0 (©Systat Software, San Jose, CA). Effects of acipimox on plasma glucose, GIP, GLP-1, GH, insulin, C-peptide, and serum FFA were analyzed by comparing the areas under the concentration-time curve (AUC). GIR and concentrations at single time points were analyzed by Student two-tailed paired t test. Correlation analyses were performed via Pearson’s product moment test for normal distributed data and Spearman rank order for nonnormal distributed data. A P < 0.05 was considered significant.
For perfusion experiments, outputs at baseline and under stimulus administration (response) are shown. Response outputs were calculated as the sum of secretion over the stimulation period (15 minutes) divided by the time course. Baseline output was also calculated as the averaged secretion over 15 minutes’ duration, but to correct for potential drift in secretion over the time course of the experiment, values were taken from 8 minutes that lead immediately up to the stimulus administration and the next 7 minutes before administration of the positive control (e.g., after acipimox administration). Statistical significance was assessed in GraphPad Prism software (La Jolla, CA) by a Student two-tailed paired t test (perfusion experiments) or one-way ANOVA for repeated measurements with Tukey post hoc comparison (GLUTag studies).
Results
Study 1
Plasma GLP-1
Plasma GLP-1 concentrations were similar at t = 0 minutes [1.4 ± 0.2 pmol/L (acipimox) vs 3.3 ± 1.3 pmol/L (control), P = 0.23] (Fig. 1A) but increased after 60 minutes in response to acipimox treatment [9.6 ± 2.9 pmol/L (acipimox) vs 2.3 ± 0.5 pmol/L (control), P = 0.044]. Plasma GLP-1 increased in response to the OGTT but more so in the presence of acipimox pretreatment (AUC) [4119 ± 607 pmol/L × min (acipimox) vs 1973 ± 375 pmol/L × min (control), P = 0.004].
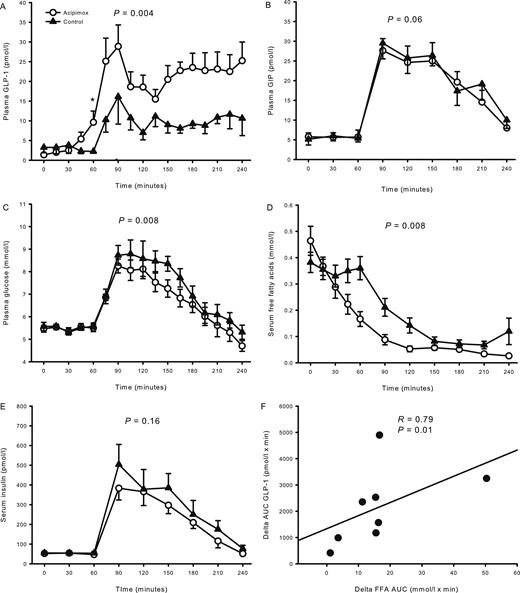
Hormones and metabolites from study 1 comprising overweight healthy men. (A) Plasma GLP-1 increased during acipimox treatment. (B) Acipimox did not affect plasma GIP levels. (C) Plasma glucose increased to a lesser extent after the OGTT during acipimox treatment. (D) Serum FFAs were suppressed more after the OGTT during acipimox treatment. (E) Acipimox did not affect serum insulin levels. (F) The change in AUCs (delta FFA, control minus cipimox; delta GLP-1, acipimox minus control) between acipimox treatment and the control experiment in FFA and GLP-1 were compared and revealed a significant correlation. Printed P values refer to comparison of AUCs. Asterisk indicates significant differences in a pairwise comparison. All data are presented as mean ± SEM. Acipimox, white circles; control, black triangles.
Plasma GIP
Plasma GIP concentrations were similar at t = 0 minutes [5.8 ± 1.0 pmol/L (acipimox) vs 5.1 ± 1.5 pmol/L (control), P = 0.65] (Fig. 1B). There was no significant effect of acipimox on the OGTT-stimulated GIP concentrations [3082 ± 357 pmol/L × min (acipimox) vs 3774 ± 516 pmol/L × min (control), P = 0.06].
Plasma glucose
Plasma glucose concentrations were similar at t = 0 minutes [5.5 ± 0.1 mmol/L (acipimox) vs 5.6 ± 0.2 mmol/L (control), P = 0.61] (Fig. 1C). Plasma glucose was not acutely affected by acipimox treatment [t = 60 minutes, 5.5 ± 0.2 mmol/L (acipimox) vs 5.9 ± 0.9 mmol/L (control), P = 0.51], but the response was blunted in the acipimox experiment during the OGTT [1222 ± 49 mmol/L × min (acipimox) vs 1320 ± 56 mmol/L × min (control), P = 0.008].
Serum FFAs
Serum FFA levels were similar at t = 0 minutes [0.46 ± 0.06 mmol/L (acipimox) vs 0.38 ± 0.04 mmol/L (control), P = 0.11] (Fig. 1D). FFA concentrations decreased from t = 0 minutes in response to acipimox administration, and the suppression of FFA in response to the OGTT was accentuated by acipimox [29.3 ± 3.9 mmol/L × min (acipimox) vs 45.5 ± 4.6 mmol/L × min (control), P = 0.008]. The changes in FFA and GLP-1 concentrations were compared by a correlation analysis of the change in AUC of GLP-1 and FFA, and revealed a significant inverse association as a larger decrease in FFA correlated significantly to a larger increase in GLP-1, R = 0.79, P = 0.01 (Fig. 1F).
Serum insulin
Serum insulin concentrations were similar at t = 0 minutes [52.4 ± 8.8 pmol/L (acipimox) vs 55.1 ± 8.5 pmol/L (control), P = 0.58] (Fig. 1E). Serum insulin increased to approximately the same extent in response to the OGTT [t = 90 minutes, serum insulin 383.3 ± 59.5 pmol/L (acipimox) vs 503.9 ± 101.8 pmol/L (control), P = 0.23], and the AUCs were similar [42,596 ± 4684 pmol/L × min (acipimox) vs 52,751 ± 9620 pmol/L × min (control), P = 0.16].
Study 2
Data on metabolites and insulin sensitivity were reported previously (20). In summary, plasma glucose levels were similar at baseline (t = 0 minutes) [4.5 ± 0.1 mmol/L (acipimox) vs 4.7 ± 0.1 mmol/L (control), P = 0.06] (Fig. 2A) but became significantly reduced during the ensuing basal period (t = 0 to 120 minutes) after acipimox as compared with placebo (P = 0.02). During the terminal 30 minutes of the clamp, plasma glucose levels were similar [5.0 ± 0.0 mmol/L (acipimox) vs 5.0 ± 0.1 mmol/L (control), P = 0.90]. Acipimox suppressed basal serum FFA levels [0.07 ± 0.02 mmol/L (acipimox) vs 0.41 ± 0.04 mmol/L (control), P < 0.001] (Fig. 2B), and the FFA levels were lower throughout the acipimox study days (P < 0.001). Peripheral insulin sensitivity, as expressed by the GIR, improved by acipimox [4.7 ± 0.8 mg/kg/min (acipimox) vs 3.1 ± 0.5 mg/kg/min (control), P = 0.005] (Fig. 2C). Serum insulin levels (Fig. 2D) increased and serum C-peptide (Fig. 2E) levels decreased during the clamp independently of treatment.
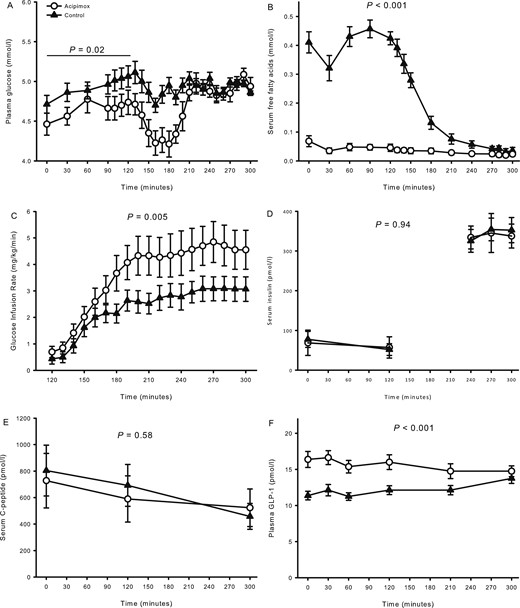
Metabolites, glucose infusion rate, and hormones from study 2 comprising hypopituitary men treated with overnight acipimox. (A) Plasma glucose was lower during acipimox treatment during basal conditions and later clamped at the same level. (B) Serum FFAs were decreased during acipimox treatment. (C) Glucose infusion rates were increased during acipimox treatment. (D, E) Acipimox did not affect serum insulin and C-peptide levels. (F) Plasma GLP-1 levels increased in response to acipimox treatment and were normalized at the very end of the clamp period. Printed P values refer to comparison of AUCs. All data are presented as mean ± SEM. Acipimox, white circles; control, black triangles.
Plasma GLP-1
Baseline plasma GLP-1 levels increased with acipimox exposure [16.4 ± 1.1 pmol/L (acipimox) vs 11.4 ± 0.6 pmol/L (control), P < 0.001] (Fig. 2F) and remained elevated during the basal and the clamp periods (P < 0.001, compared with the control situation). The change in basal GLP-1 and the change in insulin sensitivity were compared, and correlation analysis revealed that the increase in basal plasma GLP-1 concentration was positively associated with the increase in insulin sensitivity in response to acipimox treatment, R = 0.73, P = 0.04 (Fig. 3A). Baseline serum FFA and plasma GLP-1 levels are shown in Fig. 3B, and correlation analyses revealed a significant inverse correlation at baseline, R = −0.73, P = 0.001.
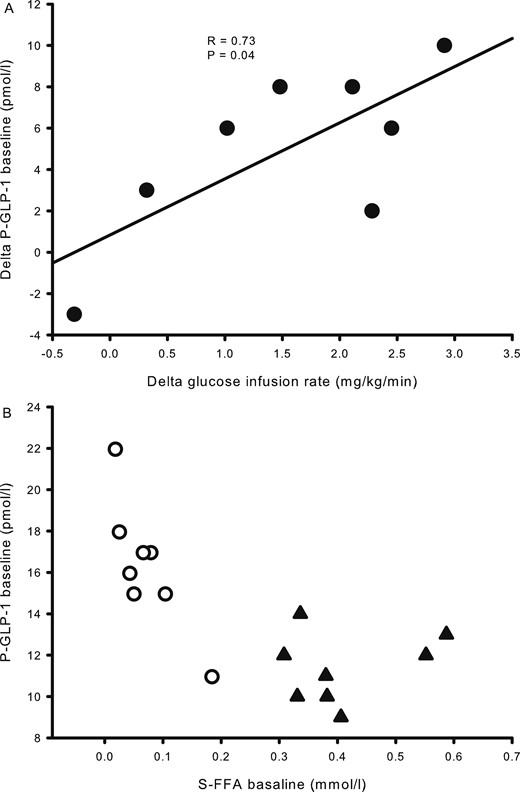
Correlation analyses from study 2. (A) The difference in glucose infusion rates and plasma GLP-1 between acipimox treatment and the control situation shows a positive association. (B) Basal concentrations of serum FFA correlated inversely with plasma GLP-1. Acipimox, white circles; control, black triangles.
Isolated perfused rat small intestine
To investigate whether the acipimox-stimulated GLP-1 response observed in humans in vivo could be a direct effect on the intestinal l-cell, we next investigated the effects of acipimox on GLP-1 secretion from the isolated perfused rat small intestine. In one line of experiments, acipimox (200 µM) was administered intra-arterially, which did not affect GLP-1 secretion. Averaged GLP-1 secretion was 109 ± 29 fmol/min within the baseline period and 108 ± 28 fmol/min during intra-arterial acipimox administration (P = 0.85, n = 5; Fig. 4A and 4B). In another line of experiments, acipimox was administered intraluminally (200 µM), which also failed to increase GLP-1 secretion: averaged baseline secretion = 154 ± 36 fmol/min vs averaged secretion during acipimox stimulation = 161 ± 37 fmol/min (P = 0.14, n = 5; Fig. 4C and 4D). Bombesin was included at the end of all experiments as positive control and robustly elevated GLP-1 secretion in all experiments.
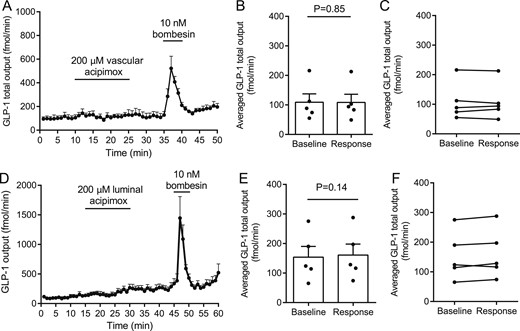
Effects of intra-arterial and luminal acipimox (200 µM) on GLP-1 secretion from isolated perfused rat small intestine. Data are shown as means ± SEM. (A) GLP-1 (total) output at baseline and in response to intravascular acipimox or bombesin (positive control). (B, C) Averaged GLP-1 output during baseline and intra-arterial acipimox administration (response). (D) GLP-1 (total) output at baseline and in response to luminal acipimox. (E, F) Averaged GLP-1 output during baseline and intraluminal acipimox administration (response). Intra-arterial bombesin was included in all experiments as positive control. Points indicate individual observations. nA-D= 5.
Additional experiments with intra-arterial niacin and 3-hydroxybutyrate administration were subsequently performed because these compounds also are ligands for the HCA2 receptor; these compounds also did not affect GLP-1 secretion (Fig. 5, n = 6).
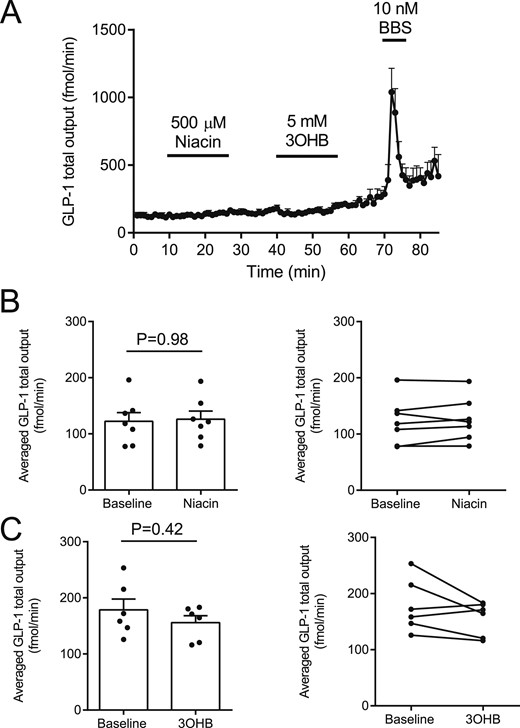
(A–C) Effects of intra-arterial niacin and 3-hydroxybuturate (3OHB) on GLP-1 secretion from isolated perfused rat small intestine. Intra-arterial bombesin (BBS) was included in all experiments as positive control. nA-C = 6.
GLUTag cell studies
To ensure that the lack of a direct effect of acipimox on the l-cell was not model-dependent, we tested whether 3-hydroxybuturate, which is also a ligand of the PUMA-G receptor, stimulated GLP-1 secretion from the GLUTag cell line. Concentrations from 0.1 to 100 mM were tested, but in all cases GLP-1 secretion was not different from baseline secretion (baseline secretion, 5.5 ± 0.6 pM; 0.1 mM, 4.5 ± 0.9 pM; 1 mM, 5.8 ± 0.9 pM; 10 mM, 5.8 ± 0.5 pM; 100 mM, 9.0 ± 1.1 pM; P > 0.99 for all groups compared with baseline) (Fig. 6). In the same line of experiments, 10 mM glucose + 10 µM FSK/IBMX (positive control) robustly increased GLP-1 secretion to 62 ± 11 pM, n = 4, P < 0.001 compared with baseline.
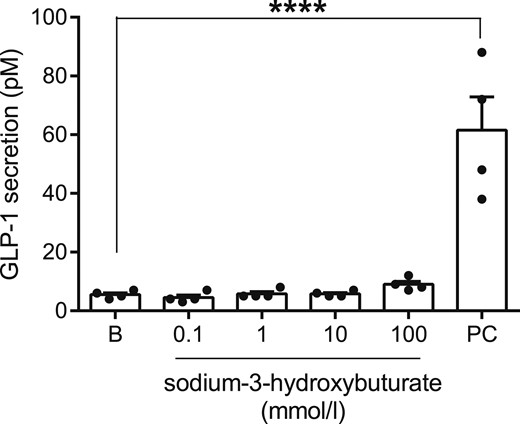
GLP-1 secretion from GLUTag cells at baseline (B) and in response to sodium-3-hydroxybuturate in indicated concentrations or the positive control (PC, 10 mM glucose + 10 µM FSK/IBMX). nD = 4. ****P < 0.001.
RNA sequencing
Because of the lack of direct effects of acipimox, niacin, and 3-hydroxybuturate on GLP-1 secretion, we next investigated whether the PUMA-G receptor (NiacR1) was expressed by the l-cell. mRNA levels of NiacR1 and FFAR1-3 for comparison were measured in fluorescence-activated cell sorter–sorted l-cells and non–l-cells (presumably dominated by enterocytes) from the mouse. Cells were sorted from biopsies taken from the upper and lower part of the small intestine and the colon, respectively. Whereas FFAR1 through FFAR3, which are generally considered part of the l-cell sensing machinery, were expressed at fairly high levels, and to an enriched extent in l-cells, NiacR1 was expressed at low levels down the intestine and not enriched in l-cells (Fig. 7).
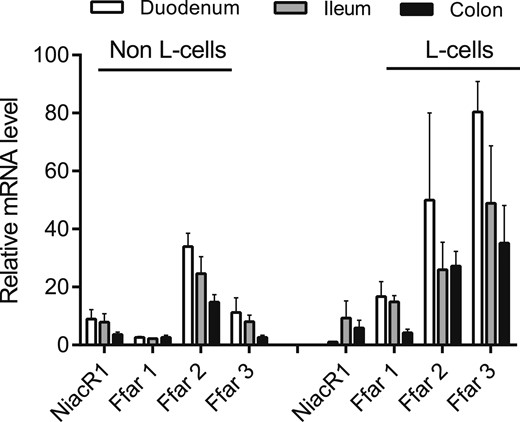
Relative expression levels of NiacR1 (also known as HCA2 receptor) in sorted primary l-cells and non-l-cells from mouse mucosa. Expression in biopsies taken from duodenum, ileum, and colon is shown. Expression levels of the fatty acid–sensitive receptors FFAR1 through FFAR3 are shown for comparison. Data are presented as mean ± SEM, n (duodenum) = 2, n (ileum and colon) = 3.
Discussion
This study reveals that acipimox administration in both obese subjects and hypopituitary patients amplifies circulating GLP-1 levels, but subsequent experiments in a rat model and in vitro suggested that this is not a direct receptor-mediated effect of acipimox on the l-cell.
GLP-1 lowers blood glucose via several mechanisms that include potentiation of glucose-stimulated insulin secretion, inhibition of gastric emptying, inhibition of food intake, and attenuation of glucagon secretion (28, 29). Because of these actions, several types of GLP-1–based drugs are used for the treatment of T2D and, more recently, for treatment of obesity (30). In addition, considerable research is devoted to uncovering the molecular mechanisms controlling GLP-1 secretion to develop drugs that selectively stimulate GLP-1 secretion (9, 31).
The primary aim of the current study was to investigate whether the antidiabetic effect of acipimox could be attributable in part to a direct stimulatory effect on GLP-1 secretion.
We demonstrated that acute and more prolonged acipimox intervention indeed increased circulating GLP-1 concentrations in human subjects, and we went on to investigate whether this was caused by direct interaction with the intestinal l-cells. To this end, we used the isolated perfused rat small intestine model (1), which allows strict experimental control while maintaining critical physiological factors such as intestinal polarization and removal of secreted and absorbed products (by convective drag).
Acipimox binds to the G-protein–coupled receptor named HCA2 encoded by the hydroxycarboxylic acid receptor 2 gene (HCAR2) in adipose tissue and thereby inhibits the hormone sensitive lipase (14, 32) leading to acute suppression of circulating FFA levels and improved peripheral insulin sensitivity (17). As mentioned, the FFA-lowering effect of acipimox in patients with T2D is transient because of a counterregulatory lipolytic response mediated by GH and ACTH (18), which can be abrogated by studying hypopituitary patients with GH and ACTH deficiency (19).
It has previously been demonstrated that acipimox acutely increases GLP-1 concentration in obese women (33, 34), but it remained to be determined whether this effect was independent of GH and cortisol (18). Moreover, the previous reports on the stimulatory effect of acipimox on GLP-1 concentration measured intact GLP-1 7-36 amide (33, 34), which has a very short half-life because of dipeptidyl peptidase-4–mediated degradation to the inactive GLP-1 9-36 amide (35). Thus, plasma levels of intact GLP-1 rarely reflect the secretion rate of GLP-1. In the current study, we measured total GLP-1, which more accurately reflects GLP-1 secretion. In hypopituitary male patients, we observed that GLP-1 concentrations increase by >40% after an overnight fast during acipimox treatment and that the effect of acipimox on insulin sensitivity correlates with the change in GLP-1 levels. To determine whether acipimox stimulates GLP-1 secretion directly, we used the isolated and perfused rat small intestine model and examined the direct effects of intra-arterial as well as intraluminal acipimox on GLP-1 output. In either case, acipimox failed to affect GLP-1 secretion, and two other ligands of the HCA2 receptor, 3-OHB and niacin, also had no effect. Moreover, we performed studies on the GLP-1–secreting GLUTag cells stimulated with 3-OHB and quantified the expression of the PUMA-G receptor in sorted primary mouse l-cells. Consistent with the lack of effects in the isolated perfused rat small intestine model, 3-OHB did not affect GLP-1 secretion, and the expression of the PUMA-G receptor was low. Our studies therefore suggest that the stimulatory effects of acipimox are caused by indirect mechanisms not involving binding to the l-cell or interaction with other enteroendocrine cell types in the gut.
Species-specific differences between humans and rodents should also be taken into account, however. Fasting induces lipolysis, leading to an increase in circulating FFA levels in humans (36). GH secretion plays a significant role for fasting-induced lipolysis in humans (37), which is in contrast to mice (38). Rats do not naturally enter into prolonged fasting periods, and they exhibit a reversed dark-light cycle compared with humans and a different neuroendocrine pattern (39), both of which make extrapolations to human physiology difficult.
From a teleological and physiological point of view, it would make sense that high circulating FFA levels, which occur mainly during fasting, suppress GLP-1 secretion and vice versa in human subjects in vivo. In support of this effect, an inverse correlation between FFA and GLP-1 has been demonstrated (34). Correlation analyses revealed that the acute decrease in FFA in our study in obese subjects showed a very close inverse correlation with the increase in GLP-1 after acipimox treatment, and FFA also correlated inversely with GLP-1 levels in the hypopituitary patients. In rats and mice, both vascular and luminal perfusion of the gut with long-chain fatty acids and short-chain fatty acids increases GLP-1 secretion by mechanisms that may involve FFAR1, FFAR2, and FFAR3 activation (4–8), which indirectly suggest a stimulatory effect of circulating FFA on GLP-1 secretion. Whether the results from our human study reflect a species-specific difference remains to be determined. An alternative interpretation of our data could be that improvement in intestinal insulin sensitivity because of low FFA improves the l-cell response to glucose and thereby amplifies GLP-1 secretion, but this interpretation also remains to be investigated.
Abbreviations:
- AUC
area under the concentration-time curve
- FFA
free fatty acid
- FFAR
free fatty acid–sensitive G-protein coupled receptors
- GIR
glucose infusion rate
- GLP-1
glucagon-like peptide-1
- OGTT
oral glucose tolerance test
- PUMA-G
protein upregulated in macrophages by interferon-γ
- T2D
type 2 diabetes
Acknowledgments
E. Hornemann and L. Buus are acknowledged for excellent technical assistance. The data in study 2 were presented as an oral presentation at the Endocrine Society Annual Meeting 2015.
Financial Support: The study was supported by a postdoctoral research fellow grant (11-105283) from the Danish Council for Independent Research (Medical Sciences) to E.T.V. and grants from the Riisfort Fonden (to E.T.V.) and the A.P. Moller Foundation. The work in J.J.H.’s laboratory was supported by an unrestricted grant to J.J.H. from the Novo Nordisk Center for Basic Metabolic Research (Novo Nordisk Foundation, Denmark), a grant to J.J.H. from the European Research Council (grant no.695069), a postdoc grant to R.E.K. from the Lundbeck Foundation (R264-2017-3492) and an unrestricted grant from the Health Research Fund of Central Denmark Region (E.T.V.).
Clinical Trial Information: ClinicalTrials.gov nos. NCT02796950 (registered 27 May 2016) and NCT01209416 (registered September 2010).
Author Contributions: E.T.V. is the guarantor of this work and as such had full access to all the data in the study and takes responsibility for the integrity of the data and the accuracy of the data analysis. E.T.V. wrote the protocol, screened patients, performed the clinical study, collected data, analyzed data, interpreted results, wrote the first manuscript draft, edited and revised the manuscript, created the figures and table, performed literature research, and approved the final manuscript. N.J. analyzed data, interpreted results, edited and revised the manuscript, performed literature research, and approved the final manuscript. J.J.H. generated and interpreted results, edited and revised the manuscript, and approved the final manuscript. N.M. interpreted results, edited and revised the manuscript, and approved the final manuscript. J.O.L.J. conceptualized and designed the study, wrote the protocol, analyzed data, interpreted results, edited and revised the manuscript, performed literature research, and approved the final manuscript. A.J.H. wrote the protocol, screened patients, performed clinical study 1, collected data, analyzed data, interpreted results, and approved the final manuscript. R.E.K. generated and interpreted results, edited and revised the manuscript, and approved the final manuscript. P.L. generated and interpreted some results and approved the final manuscript. F.M.G. designed transcriptomic experiments and edited and approved the final manuscript. F.R. designed transcriptomic experiments and edited and approved the final manuscript.
Disclosure Summary: The authors have nothing to disclose.
References
Author notes
E.T.V., A.J.H., and R.E.K. contributed equally to this research.
