


Abstract
Not only type 2 diabetes (T2D), but also type 1 diabetes (T1D), can be associated with insulin resistance, as assessed using insulin-stimulated whole-body glucose disposal (M-value). We hypothesized that different factors would affect the M-value at the onset of T1D and T2D.
We examined 132 patients with T1D or T2D matched for sex, age, and body mass index with a known diabetes duration of <12 months. Multivariable linear regression analyses were applied to test the associations between glycemic control, blood lipid levels, adiponectin, and proinflammatory immune mediators and the M-value, obtained from the hyperinsulinemic-euglycemic clamp.
Despite comparable age, body mass index, and near-normoglycemic control, the mean M-value was lower in those with T2D than in those with T1D. Patients with T1D had a lower waist/hip ratio and serum triglycerides but higher serum adiponectin than patients with T2D. However, the circulating proinflammatory markers were not different. Even with adjustments for glucose-lowering treatments, the fasting blood glucose correlated negatively with the M-value in both groups. However, gamma-glutamyl transferase—independently of any treatments—correlated negatively only in T2D. In contrast, serum adiponectin correlated positively with the M-values.
Fasting glycemia correlated with insulin-stimulated glucose disposal in both diabetes types. However, altered liver and adipose tissue function were associated with insulin-stimulated glucose disposal only in T2D, underpinning the specific differences between these diabetes types.
Insulin-stimulated whole-body glucose disposal (ISGD), as assessed using the hyperinsulinemic-euglycemic clamp, mainly reflects skeletal insulin sensitivity. Impairment of ISGD, also termed insulin resistance, represents a physiological phenomenon limiting glucose uptake during an excess of endogenous (i.e., fasting) or exogenous (e.g., diet) lipids (1–4). Nevertheless, ISGD is reduced in patients with overt type 2 diabetes (T2D) (5, 6) and cannot be reversed even by a low-calorie diet (7). In addition, it is even present in normoglycemic first-degree offspring of parents with T2D (8).
Type 1 diabetes (T1D) primarily results from immune-mediated destruction of β-cells with subsequent insulin deficiency (9). Altered ISGD is not considered to be a causal factor of T1D (10) but might contribute to the progression of the disease (6, 11, 12). Adolescent, lean patients with T1D with a longer diabetes duration and poor glycemic control will also present with lower insulin sensitivity than healthy adolescents (13) This suggests that chronic hyperglycemia and glucose toxicity are the driving forces behind lower ISGD (14, 15). However, its presence at the onset of T1D and the possible underlying mechanisms remain unknown.
Both T1D and T2D might share certain mechanisms typically associated with reduced ISGD such as dyslipidemia, ectopic lipid accumulation, and subclinical inflammation (16–20). Nevertheless, some studies have suggested differences such as normal levels of lipids and the proinflammatory immune mediators, high-sensitivity C-reactive protein (hsCRP) or IL-6, in adolescent, lean, insulin-resistant patients with T1D (13, 20). These studies had certain limitations ranging from small sample sizes to incomplete matching of groups for age, body mass index (BMI), glycemic control, and disease duration to the absence of deep metabolic phenotyping.
Thus, we performed a detailed examination of the correlates of ISGD in patients with T1D and T2D. To minimize the effects of a long disease duration, insufficient glycemic control, age, and BMI, we studied patients with T1D and T2D matched for age, sex, and BMI, with good glycemic control and a known diabetes duration of <12 months.
Materials and Methods
Participants
From 2009 to 2015, 224 patients with T1D and 369 patients with T2D, aged 18 to 69 years, were recruited at the German Diabetes Center for the ongoing prospective German Diabetes Study (GDS). The aim of the prospective observational GDS is to characterize, in detail, the clinical, metabolic, and immunologic phenotypes and to monitor the disease progression (21–23). Using computer-based 1:1 matching for sex, age (±5 years), and BMI (±1 kg/m2), we identified 66 (46 male and 20 female) pairs of patients with T1D and T2D of comparable age and BMI. The duration of diabetes since the diagnosis was <12 months. The exclusion criteria comprised type 3 and type 4 diabetes mellitus, according to the current classification of the American Diabetes Association, pregnancy, immunosuppressive therapy, acute infection, fever, known cardiovascular, kidney (serum creatinine ≥140.8 µmol/L), or liver disease [aspartate aminotransferase (AST), alanine aminotransferase (ALT), and/or gamma-glutamyl transferase (GGT)], each greater than the twofold upper limit of the respective reference values), cancer, and/or psychiatric or addictive diseases (23).
According to the current American Diabetes Association guidelines (10), diabetes was diagnosed by a blood glucose concentration ≥7 mmol/L during fasting and/or ≥11.1 mmol/L at 2 hours during a 75-g oral glucose tolerance test or ≥11.1 mmol/L at random measurements, obtained by the patient’s general practitioner, specialized outpatient units, or the German Diabetes Center. T1D was diagnosed by the presence of at least one of the following criteria: acute onset of diabetes with ketoacidosis present, an immediate and continuous need for insulin therapy, low or undetectable levels of plasma C-peptide, and/or the detection of at least one islet cell-directed autoantibody (22). The present study was registered at ClinicalTrials.gov (identifier: NCT01055093), approved by the ethics board of Heinrich Heine University Düsseldorf, Germany, and performed according to the most recent version of the Declaration of Helsinki. All patients gave their written informed consent before inclusion in the study.
Anthropometric and laboratory measurements
Anthropometric data (BMI, waist circumference, waist/hip ratio [WHR]) and metabolic test results were assessed in the morning after the participants had fasted for 12 hours overnight. Patients receiving insulin treatment were instructed to administer the last insulin dose in the evening before the day of investigation. All other drugs known to lower blood glucose levels were withdrawn for at least 3 days before the tests.
Blood glucose concentrations were measured using a validated sensitive glucose oxidase method (EKF Biosen, C-Line glucose analyzer; EKF Diagnostic GmbH, Barleben, Germany) and hemoglobin A1c (HbA1c) using a Variant-II analyzer (Bio-Rad, Munich, Germany). Liver enzymes, triacylglycerols (TAGs), and cholesterol were measured using either a Hitachi 912 analyzer (Roche Diagnostics, Mannheim, Germany) or a Cobas c311 analyzer (Roche Diagnostics). hsCRP was measured using a Cobas c311 analyzer (Roche Diagnostics) (24).
The serum levels of total and high-molecular-weight (HMW) adiponectin were measured in a subgroup of 37 matched pairs using the adiponectin (multimeric) ELISA kit (ALPCO Diagnostics, Salem, NH) (25). Serum concentrations of IL-6 were quantified using the Quantikine HS kit (R&D Systems, Wiesbaden, Germany) (24).
Hyperinsulinemic-euglycemic clamp test
ISGD was assessed from the M-value using a modified Botnia clamp, which comprises an intravenous glucose tolerance test, followed by the hyperinsulinemic-euglycemic clamp test as described (21, 23) and validated (20) previously. In brief, a priming dose of intravenous insulin (10 mU/kg body weight/min; Insuman Rapid®; Sanofi, Frankfurt am Main, Germany) for the first 10 minutes was followed by a continuous intravenous insulin infusion (1.5 mU/kg/min). The rates of the 20% glucose infusion (Fresenius Kabi, Bad Homburg, Germany) were adjusted by the actual blood glucose levels to achieve stable glycemia of 5 mmol/L. The M-values were calculated for the last 30 minutes of the clamp test (21, 23).
Statistical analysis
Anthropometric and laboratory characteristics are reported as the mean ± SD or as the median (25th and 75th percentiles) for the variables if the distributions were skewed. Differences between the T2D and T1D groups are given as the mean differences or in percentages. The corresponding 95% CIs and P values were based on two-sample paired t tests. Within each diabetes group, the association between insulin resistance and potential correlates of ISGD were analyzed using multiple linear regression models that included sex, age, and BMI as potentially confounding factors. Furthermore, adjustments were made for the daily insulin dose and glucose-lowering medication (diet, oral, insulin) to control for possible effects from the therapeutic strategies (26). Additional adjustments were performed for lipid-lowering agents to analyze the associations between insulin sensitivity and blood lipid levels [TAGs, high-density lipoprotein (HDL) cholesterol, low-density lipoprotein (LDL) cholesterol]. For these analyses, the M-value and other skewed distributed variables were log-transformed (natural logarithm). The following parameters were used as independent variables: age, sex, BMI, WHR, diabetes duration since the diagnosis, fasting glucose, HbA1c, TAG, HDL, LDL, AST, ALT, GGT, hsCRP, IL-6, total adiponectin, HMW adiponectin, and HMW/total adiponectin ratio. The results are reported as the percentage of change in the M-value. To assess the differences in the regression coefficients between T1D and T2D, the data from both diabetes groups were combined, and covariance pattern models were applied that included age, sex, and BMI, the respective risk factor, and all their interaction terms with the diabetes type. These analyses account for the matched-pair design by estimating the covariance matrix of the residuals within the matched pairs. Two-sided P values < 0.05 were considered to indicate statistically significant differences. All statistical analyses were performed using SAS, version 9.4, statistical software (SAS Institute, Cary, NC).
Multivariable modeling
In an explorative, hypothesis-generating manner, a multivariable prediction model was derived for T1D and T2D separately. The variables age, sex, and waist circumference were forced into the model, and the variables that were associated with the M-value at the 5% level were also entered into the model. Adiponectin was measured in a subgroup of participants and, therefore, was not included in the model. In these models, which all maximized the R2 for a given number of variables, the model that involved the maximum number of predictors, all of which were statistically significant at the multivariable 5% level, was used. To examine the importance of each variable in the final model, squared structure coefficients (SSCs) were calculated. The greater the SSC, the larger the contribution of the variable in the entire model (27, 28).
Results
Participant characteristics
By selection, the T1D and T2D groups had a similar sex distribution, age, BMI, and glycemic control determined from both fasting glucose and HbA1c (Table 1). Most of the individuals were normal weight or overweight (67% of patients with T1D and patients with 68% of T2D). Approximately 72% (n = 47) of those with T1D and 77% (n = 51) of those with T2D had HbA1c values <53 mmol/mol (i.e., 7.0%). Those with T1D had slightly lower WHRs (P = 0.03), TAGs (P < 0.002), and GGT (P = 0.02) and higher HDL levels (P < 0.001) than the patients with T2D. The concentrations of HMW adiponectin, hsCRP, and IL-6 were not different between the two groups (Table 1).
Anthropometric and Laboratory Characteristics
| Variable | T1D | T2D | Difference (95% CI) | P Value | Padj Value |
|---|---|---|---|---|---|
| Patients, n | 66 | 66 | NA | NA | NA |
| Sex | NA | NA | NA | ||
| Male | 46 | 46 | |||
| Female | 20 | 20 | |||
| Age, y | 45 ± 9 | 46 ± 10 | 0.43 (0.0 to 0.86) | 0.051 | NA |
| Weight, kg | 82 ± 16 | 82 ± 16 | −0.91 (−3.29 to 1.46) | 0.444 | 0.416 |
| BMI, kg/m2 | 27 ± 4 | 27 ± 4 | 0.01 (−0.12 to 0.13) | 0.895 | NA |
| Waist circumference, cm | 92 ± 13 | 94 ± 12 | 1.74 (−0.20 to 3.69) | 0.078 | 0.086 |
| WHR | 0.92 ± 0.08 | 0.94 ± 0.07 | 0.02 (0.00 to 0.04) | 0.025a | 0.027a |
| Diabetes duration, d | 182 ± 93 | 194 ± 102 | 11.3 (−23.8 to 46.4) | 0.522 | 0.545 |
| Glucose-lowering treatment, n | NA | NA | NA | ||
| None | 4 | 21 | |||
| OAD | 2 | 39 | |||
| Insulin | 60 | 6 | |||
| Fasting glucose, mmol/L | 7.3 ± 2.5 | 7.0 ± 1.4 | −0.35 (−1.1 to 0.4) | 0.331 | 0.399 |
| HbA1c, mmol/mol | 48.9 ± 15.1 | 46.5 ± 9.0 | −2.4 (−6.9 to 2.2) | 0.297 | 0.277 |
| HbA1c, % | 6.6 ± 1.4 | 6.4 ± 0.8 | −0.22 (−0.6 to 0.2) | 0.297 | 0.277 |
| TAGs, mmol/L | 1.0 (0.7 to 1.5) | 1.3 (1.0 to 2.0) | 36 (14 to 64)b | < 0.002a | < 0.002a |
| HDL, mmol/L | 1.5 ± 0.5 | 1.3 ± 0.4 | −0.21 (−0.32 to −0.1) | < 0.001a | < 0.001a |
| LDL, mmol/L | 3.2 ± 0.9 | 3.5 ± 1.0 | 0.23 (−0.07 to 0.52) | 0.132 | 0.147 |
| AST, U/L | 21.0 (17.6 to 24.7) | 21.1 (17.0 to 29.0) | 9 (−2 to 21)b | 0.125 | 0.130 |
| ALT, U/L | 22.0 (18.0 to 34.0) | 25.5 (18.0 to 40.0) | 13 (−3 to 32)b | 0.120 | 0.137 |
| GGT, U/L | 20.5 (14.0 to 30.4) | 27.9 (17.0 to 40.0) | 27 (4 to 56)b | 0.020a | 0.020a |
| hsCRP, mg/dL | 0.13 (0.06 to 0.20) | 0.17 (0.09 to 0.37) | 34 (−4 to 85)b | 0.081 | 0.080 |
| IL-6, pg/mL | 1.3 (0.7 to 2.1) | 1.4 (0.9 to 2.0) | 19 (−19 to 73)b | 0.371 | 0.660 |
| Total adiponectin, ng/mL | 5178 (3560 to 7929) | 4280 (2766 to 5652) | −15 (−28 to 2)b | 0.074 | 0.007a |
| HMW adiponectin, ng/mL | 2131 (1292 to 3527) | 1815 (935 to 2697) | −4 (−35 to 14)b | 0.279 | 0.074 |
| HMW/total adiponectin ratio | 0.41 (0.35 to 0.50) | 0.41 (0.32 to 0.50) | 1 (−13 to 16)b | 0.912 | 0.964 |
Data presented as mean ± SD or median (25th to 75th percentiles); differences between T2D and T1D presented as mean difference or relative change (%).
Abbreviations: OAD, oral antihyperglycemic drug; Padj, P value for difference adjusted for matching variables of age, sex, and BMI derived from covariance pattern models.
Statistically significant.
P values and 95% CIs based on two-sided paired two-sample t tests.
Insulin-stimulated glucose disposal
The M-values of the patients with newly diagnosed T1D were greater than those of the patients with T2D (median, 7.8 mg/kg/min; 25th to 75th percentile, 6.0 to 9.8; vs median, 6.6 mg/kg/min; 25th to 75th percentile, 5.0 to 8.5 [P = 0.02 (Fig. 1A)]. Sex and age were not associated with the M-values in either group (Table 2). Likewise, the known diabetes duration in both groups did not correlate with the M-value.
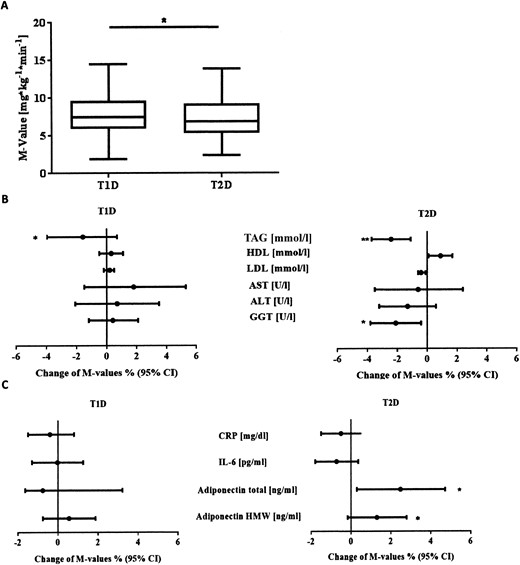
(A) M-values of sex-, age-, and BMI-matched patients with T1D and T2D. Data presented as box plots. The bottom and top of the box display the first and third quartiles; the band inside the box is the second quartile. Lines extending vertically from the box indicate the minimum and maximum of the M-values. (B) Multiple linear regression analysis of M-values (mg/kg/min) in T1D and T2D. Dots and black lines represent the relative change of M-values (%), with the corresponding 95% CIs. Association with triglycerides, HDL, LDL, AST, ALT, and GGT. Models were adjusted for age, sex, and BMI and lipid-lowering agents. (C) Association with hsCRP, IL-6, total adiponectin, and HMW adiponectin. Models were adjusted for age, sex, and BMI. *P < 0.05; **P < 0.01.
Association Between Risk Factors and M-Value
| Variable | T1D | T2D | P Valuea | ||
|---|---|---|---|---|---|
| Change in M-Value, % (95% CI) | P Value | Change in M-Value, % (95% CI) | P Value | ||
| Ageb | −0.4 (−1.3 to 0.5) | 0.378 | 0.3 (−0.6 to 1.2) | 0.495 | 0.269 |
| Female sexc | −5.7 (−21.4 to 13.2) | 0.533 | −7.2 (−22.4 to 10.9) | 0.413 | 0.898 |
| Weight | −0.3 (−1.8 to 1.1) | 0.646 | 0.3 (−0.9 to 1.6) | 0.589 | 0.462 |
| BMIb | −5.6 (−7.6 to −3.6) | < 0.001d | −4.6 (−6.6 to −2.6) | < 0.001d | 0.470 |
| Waist circumference | −1.1 (−2.7 to 0.4) | 0.159 | −0.9 (−2.4 to 0.7) | 0.280 | 0.870 |
| WHRb | −67.4 (−93.1 to 55.3) | 0.164 | −79.0 (−96.6 to 32.3) | 0.102 | 0.674 |
| Diabetes durationb | −0.1 (−0.1 to 0.0) | 0.304 | 0.0 (0.0 to 0.1) | 0.269 | 0.131 |
| Fasting glucoseb | −4.8 (−7.8 to −1.6) | 0.005d | −7.0 (−12.0 to −0.17) | 0.013d | 0.507 |
| HbA1c, mmol/molb | −0.57 (−1.11 to −0.02) | 0.047d | −0.75 (−1.66 to 0.16) | 0.113 | 0.746 |
| HbA1c, %b | −6.0 (−11.5 to −0.2) | 0.047d | −7.9 (−16.5 to 1.8) | 0.113 | 0.746 |
| Triglyceridese,f | −2.2 (−3.8 to −0.5) | 0.012d | −1.7 (−2.9 to −0.4) | 0.011d | 0.633 |
| HDLb,f | 16.7 (−7.4 to 47.2) | 0.196 | 31.0 (−1.8 to 74.7) | 0.071 | 0.475 |
| LDLb,f | 4.7 (−5.4 to 15.9) | 0.377 | −3.9 (−12.0 to 5.0) | 0.382 | 0.216 |
| ASTe | 1.8 (−0.9 to 4.6) | 0.196 | −0.3 (−2.4 to 1.8) | 0.765 | 0.224 |
| ALTe | 0.4 (−1.6 to 2.4) | 0.703 | −1.0 (−2.4 to 0.4) | 0.161 | 0.275 |
| GGTe | 0.01 (−1.5 to 1.5) | 0.989 | −1.5 (−2.8 to −0.1) | 0.047d | 0.176 |
| CRPe | −0.7 (−1.5 to 0.1) | 0.078 | −0.7 (−1.6 to 0.1) | 0.105 | 0.982 |
| IL-6e | −0.1 (−1.3 to 1.1) | 0.881 | −0.5 (−1.6 to 0.6) | 0.368 | 0.673 |
| Total adiponectine | 0.5 (−2.1 to 3.2) | 0.881 | 2.9 (0.6 to 5.1) | 0.015d | 0.171 |
| HMW adiponectine | 0.6 (−1.0 to 2.3) | 0.472 | 1.8 (0.1 to 3.4) | 0.039d | 0.240 |
| HMW/total adiponectin ratioe | 1.7 (−1.6 to 5.1) | 0.318 | 1.7 (−2.5 to 6.0) | 0.447 | 0.771 |
Multiple linear regression models adjusted for age, sex, and BMI.
P value for difference of relative change in M-value between T1D and T2D.
Relative change in M-value (%) for a one-unit increase of an independent variable. cRelative change in M-value (%) compared with men.
Statistically significant.
Relative change in M-value (%) for a 10%-change in the independent variable.
Also adjusted for lipid-lowering agents.
Association of glycemic control with ISGD
The fasting blood glucose correlated inversely with the M-values in both T1D (P = 0.014) and T2D (P = 0.011). A higher fasting blood glucose level of 1 mmol/L was related to a 4.2% lower M-value in those with T1D and a 7.1% lower M-value in patients with T2D, without statistically significant differences between the two groups (P = 0.507). To account for treatment effects, the analyses were adjusted for glucose-lowering medication and insulin dose. After this adjustment, the association was only statistically significant for those with T2D (P = 0.31 for T1D; P = 0.01 for T2D).
Association of abdominal obesity with ISGD
After adjustment for age and sex, the BMI correlated negatively with the M-values in T1D and T2D [P < 0.001 for both (Fig. 2A)]. A one-unit increase in BMI was related to a reduction in the M-values by 5.6% in those with T1D and 4.6% in patients with T2D. In contrast, waist circumference and WHR did not correlate with the M-values in either group after adjustment for age, sex, and BMI [P = 0.16 and P = 0.28; and P = 0.16 and P = 0.10, respectively (Table 2)]. After adjustment for age, sex, and waist circumference, the BMI did not correlate with the M-value in either T1D or T2D (P = 0.29 and P = 0.25, respectively). Similarly, the WHR did not correlate with the M-value in either T1D or T2D [P = 0.57 and P = 0.27, respectively (Table 3)]. However, the waist circumference did correlate with the M-value in both groups [P < 0.001 for both (Table 3)].
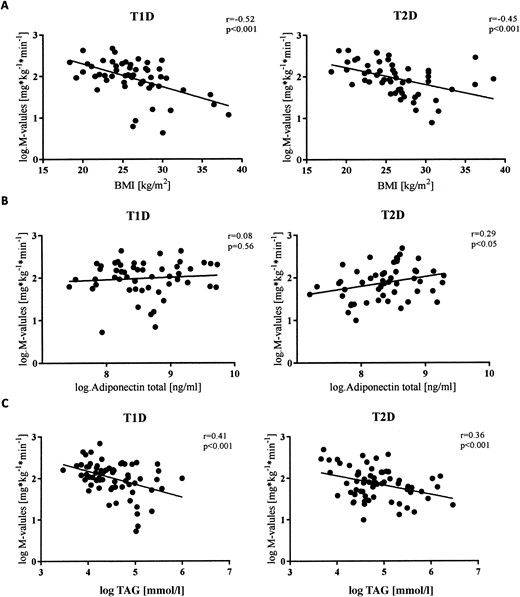
Univariate regression analysis of log-transformed (natural logarithm) M-values in T1D and T2D. Data presented as scatter plots with regression line. (A) Association with BMI. (B) Association with adiponectin. (C) Association with triacylglyceride.
Association Between Risk Factors and M-Value
| Variable | T1D | T2D | P Valuea | ||
|---|---|---|---|---|---|
| Change in M-Value, % (95% CI) | P Value | Change in M-Value, % (95% CI) | P Value | ||
| Ageb | −0.1 (−0.9 to 0.8) | 0.903 | 0.5 (−0.4 to 1.4) | 0.249 | 0.347 |
| Female sexc | −15.9 (−30.7 to 2.0) | 0.083 | −18.3 (−32.9 to 0.5) | 0.048d | 0.817 |
| Weight | −0.1 (−1.6 to 1.7) | 0.960 | 0.5 (−0.3 to 1.4) | 0.232 | 0.505 |
| BMIb | −2.6 (−7.2 to 2.2) | 0.290 | −2.5 (−6.7 to 1.8) | 0.250 | 0.953 |
| Waist circumference | −1.9 (−2.5 to −1.2) | < 0.001d | −1.7 (−2.4 to 0.9) | < 0.001d | 0.585 |
| WHRb | −41.7 (−90.8 to 296.1) | 0.569 | −71.1 (−96.7 to 151.2) | 0.265 | 0.534 |
| Diabetes durationb | −0.1 (−0.2 to 0.0) | 0.198 | 0.0 (−0.1 to 0.1) | 0.464 | 0.191 |
| Fasting glucoseb | −4.2 (−7.4 to −1.0) | 0.014d | −7.1 (−12.1 to −1.9) | 0.011d | 0.329 |
| HbA1c, mmol/molb | −0.4 (−1.0 to 0.1) | 0.142 | −0.7 (−1.6 to 0.2) | 0.132 | 0.630 |
| HbA1c, %b | −4.6 (−10.3 to 1.5) | 0.142 | −7.5 (−16.3 to 2.2) | 0.132 | 0.630 |
| Triacylglycerolse,f | −2.5 (−4.1 to −0.9) | 0.002d | −1.5 (−2.8 to −0.3) | 0.021d | 0.377 |
| HDLb,f | 15.3 (−8.6 to 45.3) | 0.235 | 30.6 (−2.5 to 74.8) | 0.078 | 0.443 |
| LDLb | 4.0 (−5.9 to 14.9) | 0.443 | −3.1 (−11.3 to 5.9) | 0.494 | 0.336 |
| ASTe | 1.2 (−1.5 to 3.9) | 0.407 | −0.0 (−2.1 to 2.2) | 0.998 | 0.624 |
| ALTe | −0.2 (−2.1 to 1.8) | 0.844 | −0.7 (−2.1 to 0.8) | 0.349 | 0.871 |
| GGTe | 0.1 (−1.5 to 1.4) | 0.934 | −1.5 (−2.9 to −0.1) | 0.039d | 0.189 |
| CRPe | −0.6 (−1.4 to 0.3) | 0.183 | −0.7 (−1.6 to 0.1) | 0.104 | 0.825 |
| IL-6e | −0.2 (−1.1 to 1.4) | 0.780 | −0.4 (−1.5 to 0.7) | 0.471 | 0.538 |
| Total adiponectine | 0.9 (−1.7 to 3.6) | 0.509 | 2.7 (0.5 to 5.0) | 0.021d | 0.297 |
| HMW adiponectine | 0.8 (−08 to 2.4) | 0.335 | 1.6 (−0.1 to 3.3) | 0.067 | 0.408 |
| HMW/total adiponectin ratioe | 1.9 (−1.3 to 5.3) | 0.254 | 0.8 (−3.4 to 5.3) | 0.700 | 0.947 |
Multiple linear regression models (adjusted for age, sex, and waist circumference).
P value for difference of relative change of M-value between T1D and T2D.
Relative change of M-value (%) for a one-unit increase of an independent variable.
Relative change of M-value (%) compared with men.
Statistically significant.
Relative change of M-value (%) for a 10%-change of an independent variable.
Also adjusted for lipid-lowering agents.
Association of serum lipids and liver enzymes with ISGD
LDL, AST, and ALT were comparable in the two groups. In contrast, patients with T1D had lower TAGs and GGT and higher HDL [P < 0.002, P < 0.001, and P = 0.02, respectively (Table 1)].
In both T1D and T2D groups, TAGs correlated negatively with the M-value (P < 0.02 for both groups) and also did so after adjustment for oral glucose- and lipid-lowering medication and insulin dose [P < 0.05 for both groups (Fig. 1B)]. A 10% increase in TAGs was related to a reduction of the M-value by 1.9% and 1.5% in those with T1D and T2D, respectively. Moreover, GGT correlated inversely with the M-values only in those with T2D [P = 0.039 (Fig. 1B)] and also did so after adjustment for oral glucose-lowering medication and insulin dose (P = 0.03). A 10% increase in GGT was related to a reduction of the M-value by 1.5% only in those with T2D. HDL, LDL, AST, and ALT did not correlate with the M-value in either group (Table 2).
Association of adiponectin and proinflammatory immune mediators with ISGD
Total adiponectin correlated positively with the M-value only in T2D [P = 0.02 (Figs. 1C and 2B)] and also did so after adjustment for oral glucose-lowering medications and insulin dose (P = 0.02). An increase in total adiponectin by 10% correlated with an increase of the M-value by 2.6%. In patients with T2D, an increase in HMW adiponectin by 10% related positively to an increase in the M-value by 1.8% (P = 0.04). After adjustment for oral glucose-lowering medications and insulin dose, this increase was slightly reduced to 1.7% (P = 0.052). No correlation was found between the HMW/total adiponectin ratios [P = 0.37 and P = 0.51 (Table 2)], C-reactive protein (CRP), and IL-6 and M-values in either group (Fig. 1C).
Predictive markers
For T1D and T2D, the variables fasting blood glucose, TAGs, and GGT (only for T2D) were entered into the model in addition to the variables age, sex, and waist circumference. Multivariable modeling led to quite similar models for T1D and T2D. The final model selected TAGs for T1D and fasting blood glucose for T2D, reaching a power of prediction of 41% and 33%, respectively. The main contribution to the final models (SSC) was the waist circumference (SSC, 72% for T1D; 57% for T2D), followed by TAGs in T1D (SSC, 41%) and fasting glucose in T2D (SSC, 20%).
If one relaxed the model selection criteria and also included variables that were statistically significant at the multivariable 10% level, TAGs and fasting blood glucose were selected for both T1D and T2D (P = 0.082 for fasting glucose in T1D and P = 0.081 for TAG in T2D). Under this model, the SSC for waist, fasting blood glucose, and TAG were similar (67%, 20%, and 38% for T1D and 50%, 18%, and 36% for T2D), and the power of prediction was slightly greater (49% for T1D and 36% for T2D).
Discussion
The results of the present study have shown that the fasting glycemia, BMI, and waist circumference correlate inversely with ISGD in recent-onset sex-, age-, and BMI-matched patients with T1D and T2D. However, hypoadiponectinemia and higher GGT were associated with ISGD exclusively in patients with newly diagnosed T2D. These findings indicate that, in addition to common mechanisms, different correlates of ISGD exist in patients with recent-onset T1D and T2D (5, 29–31).
Obesity is one of the strongest predictors leading to reduced ISGD (32) and increases, not only the risk of T2D, but also the risk of T1D (33). In the present study, we have demonstrated a comparable association between the BMI and insulin resistance in those with T1D and T2D, indicating that even moderate overweight contributes to impaired ISGD in both diabetes types. Even after adjustment of age, sex, and waist circumference, an association between waist circumferences and ISGD was detectable, suggesting that visceral obesity has effects on ISGD, in line with the increasing evidence of differences in the functional characteristics of visceral and subcutaneous fat depots (34, 35). Nevertheless, even among these carefully matched groups, the patients with T2D exhibited lower ISGD than the ISGD in patients with T1D (36).
Despite the 36% higher serum TAG concentrations in those with T2D, the serum TAG level correlated to similar degree with reduced ISGD in both groups. Dyslipidemia contributes to skeletal muscle insulin resistance in persons at risk and in those with overt T2D by cellular lipid intermediates, which inhibit insulin signaling via the diacylglycerol-novel protein kinase pathway (37). The results from the present study underline the important role of lipid availability, in addition to abnormal muscle mitochondrial function, in the development of insulin resistance even in those with recent-onset nonobese T1D, just as reported for patients with long-standing diabetes and poor glycemic control (38, 39).
Despite the comparable correlation of waist circumference, BMI, and serum TAG level with ISGD in both diabetes groups, only those with T2D exhibited specific relationships with two parameters, GGT and adiponectin. First, the positive correlation of GGT with impaired ISGD suggests increased ectopic lipid accumulation in the liver (37, 40). However, the serum levels of another transaminase that has been frequently linked to hepatic steatosis, ALT (41), was neither different between the groups nor correlated with ISGD. Thus, other explanations for the increase in GGT—aside from higher alcohol consumption, which can be excluded in our cohort (data not shown) (42)—should be considered. Alterations in hepatic mitochondrial function relate to glycemic control and could precede overt diabetes-related liver diseases in those with T1D (19). Second, serum adiponectin was lower and related negatively to ISGD only in those with T2D. Adiponectin is downregulated in the obese state and hypoadiponectinemia relates to insulin resistance (43, 44). The patients with T2D also had a greater WHR and showed a trend toward a higher waist circumference, despite a body fat mass similar to that of the patients with T1D. This underlines the importance of reduced adiponectin secretion in the development of impaired ISGD during the transition from isolated visceral to whole-body obesity. The role of such a mechanism in those with T1D is as yet unknown, because even increased plasma adiponectin levels have been reported for patients with T1D and diminished ISGD (17).
Despite the short known duration of diabetes and near-normoglycemic control, the fasting blood glucose correlated with ISGD in both diabetes types, even after adjustment for glucose-lowering medications. The role of the mechanisms of glucose toxicity, such as the hexosamine pathway and oxidative metabolism, for chronic insulin resistance has been widely demonstrated in a variety of tissues (5, 29). Short-term hyperglycemia has been less well studied but might also affect ISGD via impaired recruitment of glucose transporters in peripheral tissues, which is reversible and depends on the extent and duration of the hyperglycemia (30, 31). Thus, our data extend previous findings showing that even a short duration of moderate fasting hyperglycemia contributes to ISGD, regardless of the diabetes type.
The serum concentrations of IL-6 and hsCRP were comparable between the two groups and similar to the levels reported for nondiabetic healthy humans with a similar age and BMI (45). Additionally, the tested proinflammatory markers measured in a subgroup of the study population did not relate to ISGD in either group, suggesting that proinflammatory mechanisms might not exert a prominent role for ISGD in our specific groups. This could have resulted from the good glycemic control but was more likely from the absence of progressive adipose tissue dysfunction in these normal-to-overweight patients, thereby leading to the lower release of IL-6, which affects ISGD in models of obesity (46).
The strengths of the present study included (i) its design, which focused on a direct comparison between age-, sex-, and BMI-matched patients with T1D and T2D; (ii) the inclusion of patients with a known disease duration of not >1 year; and (iii) the use of the reference standard method to assess whole-body insulin sensitivity. However, the process of matching created a selection of subphenotypes, which, in the case of the T2D group, resulted in a rather atypical cohort of near-normal weight patients in whom obesity-specific factors and mechanisms, including inflammation, might have been less relevant (47, 48). Thus, our results should not be generalized to the populations of patients with T1D and even more to those with T2D. Nevertheless, that both groups were already exhibiting an at least moderate degree of impaired ISGD has allowed us to delineate common and diabetes-specific factors contributing to the development of the insulin resistance in patients with newly diagnosed with T1D or T2D. One limitation of the present study was that no biopsy specimens of skeletal muscle or adipose tissue were available, precluding the direct assessment of the intracellular pathways of insulin signaling.
In conclusion, a direct comparison of sex-, age-, and BMI-matched patients with T1D and T2D made it possible to delineate diabetes type-specific correlates of ISGD. In both diabetes types, fasting glycemia and body fat mass were associated with impaired ISGD, but hypoadiponectinemia and GGT were associated with insulin resistance only in those with T2D.
Abbreviations:
- ALT
alanine aminotransferase
- AST
aspartate aminotransferase
- BMI
body mass index
- GDS
German Diabetes Study
- GGT
gamma-glutamyl transferase
- HbA1c
hemoglobin A1c
- HDL
high-density lipoprotein
- HMW
high-molecular-weight
- hsCRP
high-sensitivity C-reactive protein
- ISGD
insulin-stimulated whole-body glucose disposal
- LDL
low-density lipoprotein
- T1D
type 1 diabetes
- T2D
type 2 diabetes
- TAG
triacylglycerol
- WHR
waist/hip ratio
Acknowledgments
We appreciate the voluntary contribution of all the study participants. We also thank the staff of the Clinical Research Center of the German Diabetes Center for excellent technical assistance and care of the patients. Finally, we thank the Inflammation Research Group for their excellent technical support. The German Diabetes Study Group includes A. E. Buyken, J. Eckel, G. Geerling, H. Al-Hasani, C. Herder, A. Icks, J. Kotzka, O. Kuss, E. Lammert, D. Markgraf, K. Müssig, W. Rathmann, J. Szendrödi, D. Ziegler, and M. W. Roden (speaker).
Financial Support: The GDS was initiated and financed by the German Diabetes Center, which is funded by the German Federal Ministry of Health (Berlin, Germany) and the Ministry of Culture and Science of the State of North Rhine-Westphalia (Düsseldorf, Germany). Further support was provided by the German Federal Ministry of Education and Research to the German Center for Diabetes Research and the Schmutzler-Stiftung.
Clinical Trial Information: ClinicalTrials.gov no. NCT01055093 (registered 25 January 2010).
Author Contributions: M.-C.S. wrote the manuscript and researched the data. M.-C.S., A.M.-H., B.N., and J.S. performed the clinical characterization of the volunteers. M.-C.S., A.M.-H., C.H., B.N., B.K., and J.S. researched data. K.S. performed the statistical analysis. J.S., K.M., C.H., and B.N. contributed to the discussion and reviewed and edited the manuscript. M.W.R. designed the study, contributed to the discussion, and reviewed and edited the manuscript. All the authors critically reviewed the manuscript. M.W.R. is the guarantor of this work and, as such, had full access to all the data in the study and takes responsibility for the integrity of the data and the accuracy of the data analysis.
Disclosure Summary: The authors have nothing to disclose.
References
Simon M-C, Möller-Horigome A, Strassburger K, Nowotny B, Knebel B, Müssig K, Herder C, Szendroedi J, Roden MW; the German Diabetes Study Group. Data from: Correlates of insulin-stimulated glucose disposal in recent onset type 1 and type 2 diabetes. figshare 2018. Deposited 21 December 2018. https://figshare.com/s/2b588fe22f8230ad26fd.
