


Abstract
Fibroblast growth factor (FGF)2 is an important stimulatory modulator of satellite cells in skeletal muscle. Satellite cells play a cardinal role in muscle growth and repair.
We evaluated whether skeletal muscle expression of FGF2 and muscle growth and differentiation factors are reduced in patients with hypogonadotropic hypogonadism (HH) and whether testosterone replacement therapy results in their restoration.
This is a secondary analysis of a previously completed trial of testosterone replacement in men with type 2 diabetes and HH.
Clinical Research Center at a university.
Twenty-two men with HH and 20 eugonadal men were compared at baseline.
Twelve men with HH were treated with intramuscular injections of 250 mg testosterone every 2 weeks for 22 weeks, and 10 men received placebo injections. Quadriceps muscle biopsies and blood samples were obtained before and after testosterone therapy.
The expression of FGF2 and FGF receptor (FGFR)2 in skeletal muscle of men with HH was significantly lower than that in eugonadal men by 57% and 39%, respectively (P < 0.05). After 22 weeks of testosterone, the expression of FGF2 increased, whereas that of myogenic regulatory factor (MRF)4 and myostatin decreased significantly. There was no change in expression of FGFR2, myogenin, or myogenic differentiation protein in the skeletal muscle. Plasma FGF2 and IGF-1 concentrations increased after testosterone therapy.
These data show that testosterone is a major modulator of FGF2, MRF4, and myostatin expression in skeletal muscle. These effects may contribute to the increase in muscle mass after testosterone therapy.
Type 2 diabetes and obesity have a suppressive effect on the male reproductive axis (1). We have shown that one-third of men with type 2 diabetes have subnormal free testosterone concentrations (2). Because gonadotropin concentrations in these men are not elevated, they have hypogonadotropic hypogonadism (HH). These men have more fat mass and relatively lower lean mass and are more insulin resistant than eugonadal men with type 2 diabetes (3). Our recent studies show that testosterone therapy in men with type 2 diabetes and HH increases lean body mass, decreases subcutaneous fat mass, and improves insulin sensitivity (3). We have now investigated the mechanisms that may account for the increase in lean mass after testosterone therapy in men with type 2 diabetes and HH.
Skeletal muscle hypertrophy is accompanied by proportional increases in myofiber volume and myonuclei (4, 5). Because nuclei in myofibers are terminally differentiated, muscle hypertrophy also largely involves activation of satellite cells (6). Human studies show that exercise- or testosterone-induced muscle hypertrophy is accompanied by an increase in activated satellite cells (7, 8). Several mediators are involved in the activation, differentiation, and renewal of satellite cells. Fibroblast growth factor (FGF)2 has recently been shown to play a cardinal role in mice in the proliferation and development of satellite cells or muscle stem cells, which mature into skeletal muscle cells (9, 10). The ligation of FGF2 to its receptor (FGFR) and further signal transduction is facilitated by fibronectin and β1 integrin (11–13). The effect of testosterone replacement on FGF2 in hypogonadal men is not known.
Skeletal muscle development after satellite cell activation is dependent on four myogenic regulatory factors: myogenic factor (Myf)5, myogenic differentiation protein (MyoD), myogenin, and myogenic regulatory factor (MRF)4 (9). Myf5 is the first of these factors to be expressed in activated satellite cells. Myf5-positive satellite cells undergo differentiation after expressing MyoD, whereas MYF5-negative cells undergo self-renewal. Exposure of satellite cells to FGF2 increases the expression and protein level of MyoD. MyoD is the key transcription factor for myogenic differentiation, whereas myogenin is the mediator of myotube formation and myoblast fusion. MRF4, the most prominent regulatory factor expressed in mature muscle, is a suppressor of muscle hypertrophy (14, 15).
In addition to the above-mentioned mediators, IGF-1 and myostatin are key factors involved in muscle growth. Myostatin, a member of the TGF-β superfamily, diminishes muscle growth and promotes muscle wasting by impairing protein synthesis and enhancing ubiquitin-proteasome pathway–mediated protein degradation of critical muscle-specific proteins (16). Autocrine and paracrine roles of IGF-1 in muscle cell proliferation, differentiation, and hypertrophy have also been described (9). After binding to its receptor (IGF-1R), IGF-1 promotes muscle differentiation and hypertrophy via the PI3 kinase/AkT pathway, resulting in activation and decreased proteolysis of MyoD (9).
Based on these previous reports, we hypothesized that HH is associated with (i) a reduction in plasma concentrations of FGF2 and in the expression of FGF2 and FGFR in skeletal muscle; (ii) a reduction in the expression of MyoD, myogenin, and Myf5 in skeletal muscle; and (iii) an increase in expression of MRF4 in skeletal muscle. We further hypothesized that testosterone replacement results in (i) an increase in plasma FGF2 and IGF1 concentrations and in the expression of FGF2 and FGFR2 in skeletal muscle; (ii) an increase in MyoD, myogenin, Myf5, and IGF-1R expression in muscle; and (iii) a decrease in myostatin and MRF4 expression in muscle.
Subjects and Methods
We recruited men with type 2 diabetes who were between the ages of 30 to 65 years, who had HbA1c ≤8%, and who had been on a stable diabetes regimen for 3 months for a randomized, placebo-controlled trial of testosterone replacement. HH was defined as subnormal free testosterone concentration (<5 ng/dL) on two occasions along with low or normal LH concentrations. Details of the study design as well as the results on insulin sensitivity, inflammation, and body composition from that trial have been published (3). The results presented herein are derived from secondary analyses of the trial. Briefly, 50 eugonadal men and 44 men with HH participated in the primary trial. They underwent dual-energy X-ray absorptiometry (DEXA) scans for lean mass and fat mass measurements and muscle biopsies. Hypogonadal men were randomized to receive intramuscular injections of testosterone (therapy initiated with 250 mg) or placebo (1 mL saline) every 2 weeks for 22 weeks. Muscle biopsies and DEXA scan were performed 1 week after the last injection (week 23). Blood samples were collected at baseline and at 15 and 23 weeks. The dose of testosterone was adjusted to keep serum free testosterone concentrations in the mid-normal range. The protocol was approved by the Human Research Board of the State University of New York at Buffalo. Informed consent was signed by all subjects.
Percutaneous skeletal muscle biopsy
Muscle biopsies of vastus lateralis muscle were performed under local anesthesia. A 5-mm incision was made 10 to 15 cm above the patella, and a biopsy needle connected to suction was inserted into the muscle. Approximately 200 mg of muscle tissue was obtained, washed with PBS, and stored in liquid nitrogen (−80°C) until processing for specific assays. Twenty eugonadal men and 22 men with HH participating in the original study agreed to provide muscle biopsies at baseline. Twelve men with HH were randomized to testosterone treatment; the other 10 men received placebo. At the end of the study, 10 and 4 men in the testosterone and placebo arms, respectively, agreed to provide a second biopsy at the completion of the study.
DEXA scan
Total and regional (appendicular and trunk) lean body mass and fat mass was measured by DEXA at baseline and at week 23. The within-center variability over time in measurement of lean mass is 0.9% and of fat mass is 1.2% (17, 18).
Laboratory assays
Total testosterone concentrations were measured by liquid chromatography tandem mass spectrometry (Quest Diagnostics, Secaucus, NJ) (19). Tracer equilibrium dialysis was used to separate the free testosterone (Nichols Institute, Chantilly, VA) (19). FGF2, IGF-1, myostatin, and fibronectin plasma levels were measured by ELISA (R&D Systems, Minneapolis, MN) in blood samples at baseline, at week 15, and at the end of study (n = 12 vs n = 10).
Mononuclear cells isolation
Blood samples were collected in Na-EDTA and carefully layered on Lympholyte medium (Cedarlane Laboratories, Hornby, ON, Canada). Samples were centrifuged, and two bands were separated out at the top of the red blood cell pellet. The mononuclear cell band was harvested and washed twice with Hank balanced salt solution. This method provides yields >95% mononuclear cell preparation.
Quantification of mRNA expression by RT-PCR
Expression of FGF2, FGFR1 and 2, myogenin, MyoD, MRF4, Myf5, myostatin, fibronectin, β1 integrin, and IGF-1R were measured in skeletal muscle by RT-PCR. Total RNA was isolated from skeletal muscle using the commercially available RNAqueous®-4PCR Kit (Ambion, Austin, TX). Real-time RT-PCR was performed using CFX-Connect (Bio-Rad, Hercules, CA), Sybergreen master mix (Qiagen, Germantown, MD), and gene-specific primers (Life Technologies, Frederick, MD). All values were normalized to the expression of a group of housekeeping genes, including actin, ubiquitin C, and cyclophilin A. The normalization factor used is calculated by GeneNorm software and is based on the values of all housekeeping genes used.
Statistical analysis
Because this is a secondary analysis of a previously completed trial, power calculations were not performed a priori for the end-points detailed in this manuscript. Group comparisons were performed by two-sided t tests, Mann-Whitney rank sum tests, and χ2 tests as appropriate. Percent change from baseline was calculated, and statistical analysis for change from baseline was carried out using paired t test or one-way repeated measures ANOVA followed by the Holm-Sidak post hoc test (for plasma data). Statistical analysis for change compared with placebo was performed using t test (muscle data) or two-way ANOVA followed by the Holm-Sidak post hoc test (plasma data). All tests were performed using SPSS software (SPSS Inc., Chicago, IL). Results are presented as means ± SE. Data on demographics, lean mass, fat mass, testosterone, and hemoglobin concentrations are presented as means ± SD for normally distributed data and as median (25th, 75th percentile) for non-normal data. A P value <0.05 was considered significant.
Results
As previously reported (3), men with and without HH had similar age (55 ± 8 vs 52 ± 9 years; P = 0.08), but the body mass index in men with HH was greater than that in eugonadal men (40 ± 8 vs 34 ± 6 kg/m2; P < 0.001). Men with HH had higher subcutaneous fat mass (46 ± 14 vs 34 ± 12 kg; P < 0.001) and lean mass (71 ± 11 vs 64 ± 9; P = 0.002) than eugonadal men. Lean mass, when expressed as a percentage of total body weight, was lower in men with HH compared with eugonadal men (58 ± 5% vs 62 ± 7%; P = 0.003). Men with HH had lower hematocrit (41 ± 4 vs 44 ± 3 g/dL; P = 0.001), but hemoglobin A1c was similar in the two groups [7.0 ± 1.1% (53 ± 12 mmol/mol) vs 7.1 ± 1.1% (54 ± 12 mmol/mol); P = 0.66]. After 23 weeks of testosterone treatment, free testosterone concentration increased from 0.16 ± 0.05 to 0.48 ± 0.14 nmol/L (P < 0.001) but did not change in the placebo group (0.15 ± 0.04 nmol/L at baseline, 0.18 ± 0.06 nmol/L at week 23; P = 0.07). Total body subcutaneous fat mass decreased (mean difference, −3.3 kg; 95% CI, −5.8 to −0.8; P = 0.01) and lean mass increased (mean, 3.4 kg; 95% CI, 1.2 to 5.6; P = 0.003) after testosterone therapy. There was an increase in hemoglobin (mean difference, 2.7%; 95% CI, 0.2 to 5.1; P = 0.03) but no change in hemoglobin A1c (mean, 0.2%; 95% CI, −0.6 to 0.9; P = 0.4).
FGF2 and FGF receptor
Plasma concentrations of FGF2 were not different between the eugonadal and hypogonadal groups at baseline (12.2 ± 1.9 vs 11.3 ± 1.7 pg/mL; P = 0.57). However, they increased significantly after testosterone treatment in the hypogonadal group at 15 and 23 weeks (from 12.6 ± 1.9 to 16.1 ± 2.0 and 16.8 ± 2.1 pg/mL; P = 0.031 and 0.022, respectively, compared with baseline) (Fig. 1A). The change in FGF2 levels after testosterone treatment was also significantly different from that after placebo (P = 0.024 and 0.013 at 15 and 23 weeks, respectively) (Fig. 1A).
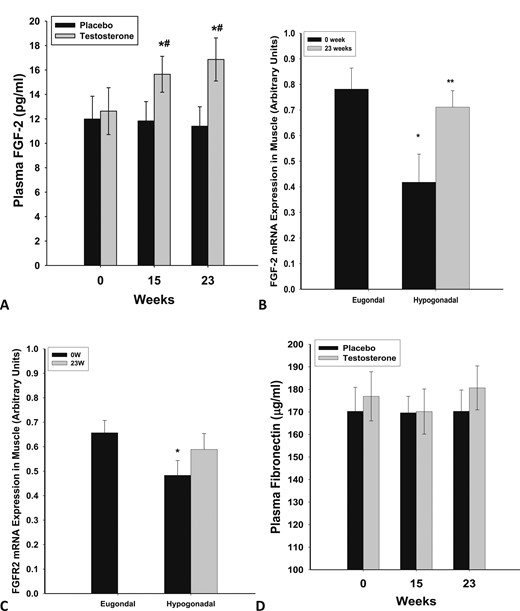
Plasma concentrations of (A) FGF2 and (D) fibronectin in men with HH after 23 wk of testosterone (n = 12) or placebo (n = 10) treatment. *P < 0.05 as compared with 0 wk in the testosterone group; #P < 0.05 as compared with placebo. Basal mRNA expression of (B) FGF-2 and (C) FGFR2 in skeletal muscle of eugonadal men and men with HH and change in expression after 23 wk of testosterone treatment in the men with HH. *P < 0.05 as compared with eugonadal men; **P < 0.05 as compared with 0 wk in the HH group.
The expression of FGF2 and FGFR2 in skeletal muscle of men with HH was significantly lower than that in eugonadal men (Fig. 1B, 1C) by 57% (P = 0.01) and 39% (P = 0.023), respectively. After 22 weeks of physiological replacement of testosterone, expression of FGF2, but not FGFR2, increased significantly by 134 ± 45% above the baseline (from 0.42 ± 0.12 to 0.72 ± 0.10 arbitrary units; P = 0.01) (Fig. 1C) and was comparable to the expression rate in eugonadal men. This change in FGF2 expression in muscle was significant (P = 0.028, Mann-Whitney rank sum test, 74% to 159%) compared with the placebo group (n = 4), in which FGF2 or FGFR2 expression did not change significantly.
Fibronectin concentrations in plasma were similar when comparing the eugonadal and HH groups at baseline (169 ± 22 vs 177 ± 19 µg/mL; P = 0.72). They were not significantly altered after testosterone replacement (Fig. 1D). The expression of fibronectin and β1 integrin in skeletal muscle was not different between the HH and eugonadal groups and did not change after testosterone treatment (data not shown). We also evaluated the expression of an inhibitor of FGF2 signaling, Sprouty 1 (a tyrosine kinase inhibitor). The expression of Sprouty1 did not change after testosterone therapy (data not shown).
IGF-1 and myostatin
Plasma concentration of IGF-1 was not different between the eugonadal and hypogonadal groups at baseline (65 ± 5 vs 61 ± 7 ng/mL; P = 0.65). However, it increased significantly after testosterone treatment in the hypogonadal group at 23 weeks (from 62 ± 6 to 81 ± 11 ng/mL; P = 0.03) (Fig. 2A). The change in IGF-1 levels after testosterone treatment was also significantly different from that after placebo (P = 0.035 and 0.022 at 15 and 23 weeks, respectively) (Fig. 1C). There was a correlation between the change in circulating levels of IGF-1 and FGF2 after testosterone treatment (r = 0.623, P = 0.015), whereas there was no relationship between these factors as reflected in their baseline concentrations or their expression in the muscle.
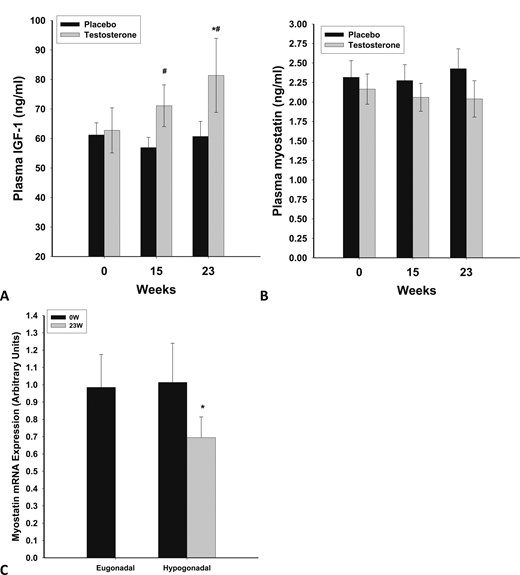
Plasma concentrations of (A) IGF-1 and (B) myostatin in men with HH after testosterone (n = 12) or placebo (n = 10) treatment for 23 wk. (C) Basal mRNA expression of myostatin in skeletal muscle of eugonadal men and men with HH and change in expression following testosterone treatment for 23 wk in hypogonadal men. *P < 0.05 as compared with 0 wk; #P < 0.05 as compared with placebo.
The expression of IGF-1R in skeletal muscle was not different between the HH and eugonadal groups and did not change after testosterone treatment (data not shown).
Serum myostatin was lower in men with HH than in eugonadal men (2.23 ± 0.23 vs 4.0 ± 0.5 ng/mL; P = 0.007). There was no change in myostatin levels after testosterone therapy (Fig. 2B). However, there was a 29 ± 12% (P = 0.024) decrease in expression of myostatin in muscle after testosterone therapy (Fig. 2C). This change in myostatin expression in muscle was not significant (P = 0.137) when compared with the placebo group (n = 4), in which myostatin expression did not change significantly (data not shown).
Muscle growth and differentiation genes
There was no significant difference in the expression of myogenin, MyoD, MRF4, and Myf-5 among eugonadal and hypogonadal men (Fig. 3A–3C, Myf-5 data not shown). Testosterone treatment suppressed the expression of MRF4 significantly (by 28 ± 12%; P = 0.021) but did not alter the expression of myogenin, Myf5, or MyoD. The change in MRF4 expression in muscle was not significant (P = 0.110) compared with the placebo group (n = 4), in which myostatin expression did not change significantly (data not shown).
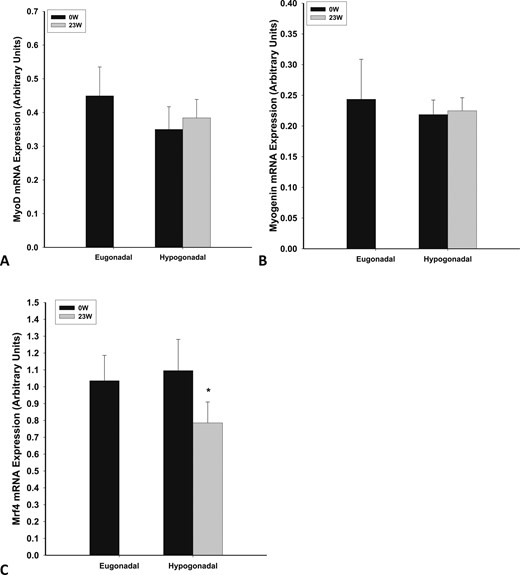
Basal mRNA expression of (A) myoD, (B) myogenin, and (C) MRF4 in skeletal muscle of eugonadal men and men with HH and change in expression after 23 wk of testosterone treatment in men with HH. *P < 0.05 as compared with 0 wk in HH group.
Discussion
Our data show clearly that the expression of FGF2 in skeletal muscle was significantly diminished in the hypogonadal state and that testosterone replacement increased the expression of FGF2, restoring it to normal. Thus, testosterone may participate in muscle growth through stimulation of FGF2 expression. Plasma concentrations of FGF2 also increased significantly after the administration of testosterone. This occurred in spite of the fact that there was no baseline difference in plasma FGF2 concentrations when comparing the eugonadal and hypogonadal groups. Because FGF2 is widely expressed in the human body in basement membranes, subendothelial matrix, fibroblasts, and adipocytes, it is possible that the increase in plasma concentrations of FGF2 is reflective of the actions of testosterone therapy on tissues in addition to muscle.
There are four FGF receptors in satellite cells and skeletal muscle (10). Similar to FGF2 expression, the expression of FGFR2 in skeletal muscle was significantly diminished in the hypogonadal state. However, testosterone therapy did not alter the expression of FGFR2. We did not find a difference in FGFR1 expression in hypogonadal men. To our knowledge, only one study has assessed FGF2 in human skeletal muscle. Hanssen et al. (7) showed that strength training–induced muscle hypertrophy is accompanied by an increased expression of FGF2 in skeletal muscle.
Recent data on aging-related changes in skeletal muscle in mice show that the levels of fibronectin and β1 integrin expression are diminished, which may lead to diminished repair and growth in the muscle (11, 12). This is relevant to the pathogenesis of aging-related muscle loss in which there is no deficiency of FGF2. There was, however, no change in the expression of fibronectin or β1 integrin in hypogonadal patients when compared with eugonadal patients. Testosterone did not alter fibronectin or β1 integrin expression. The absence of changes in fibronectin and β1 integrin expression distinguishes aging-related changes as seen in mice when compared with those in hypogonadal patients. However, aging in humans is associated with a reduction in plasma free testosterone concentrations; hence, our data may be relevant to elderly patients with low testosterone concentrations.
Prior studies of testosterone replacement in healthy men rendered transiently hypogonadal by GnRH agonist and then replaced with intramuscular testosterone for 6 months have shown an increase in satellite cell number (8). The cross-sectional area of myofibers (measured by histomorphometry) increased by ∼15%. There was also an increase in the number of myonuclei per myofiber, suggesting that testosterone-induced muscle hypertrophy is accompanied by the addition of new nuclei from satellite cells. In our study, we did not fix muscle biopsy specimens for immunostaining or separate the satellite cells. Hence, we cannot directly observe the number or characteristics of satellite cells in our study. However, our results suggest that FGF2 might be a potential mediator of testosterone’s effect on satellite cell activation. This requires further investigation.
Beyond satellite cell activation, muscle growth is dependent on muscle regulatory factors. We did not find a change in the expression of myoD or myogenin after testosterone therapy. There was a clear suppressive effect of testosterone on MRF4 expression, but this suppression was not significant when compared with placebo-treated patients (most likely due to the small sample size in the placebo arm). MRF4 has a role in maturation of myotubes in embryonic muscle development (15). Although MRF4 is the most widely expressed myogenic regulatory factor in adult skeletal muscle, its role in postnatal muscle has not been well understood. A recent study has shown that knockdown of MRF4 in adult rat skeletal muscle by RNA interference induced marked muscle hypertrophy (14). Thus, in addition to its potential action on satellite cells, testosterone likely contributes to muscle hypertrophy via suppression of MRF4. Prior studies have shown that testosterone administration in elderly men with low normal testosterone concentrations decreases muscle breakdown, as measured by net phenylalanine balance (20).
We also found an increase in IGF-1 concentrations after treatment with testosterone. The stimulatory effect of testosterone on the growth hormone axis is well known (21, 22). It is possible that the increase in circulating IGF-1 also contributes to the increase in muscle growth factors observed with testosterone therapy. The effect of testosterone therapy on IGF-1 expression in muscle has been inconsistent, with studies showing either no change or an increase (20, 23). We did not find an increase in IGF-1R in our study after testosterone therapy. There was a correlation between the change in circulating levels of IGF-1 and FGF2 after testosterone treatment, but there was no relationship between these factors’ baseline levels or their expression in the muscle.
Myostatin, also known as growth and differentiation factor 8, is a member of the TGF-β family. Discovered two decades ago, it is mainly expressed in skeletal muscle and is a negative regulator of muscle growth (16). It decreases satellite cell activation and diminishes myoblast maturation. We found that testosterone therapy decreased the expression of myostatin in muscle. This is consistent with, and likely contributes to, testosterone’s effects on muscle growth. In contrast, serum myostatin concentrations did not change after testosterone therapy. Men with HH had less myostatin in plasma than eugonadal men but had similar myostatin expression in muscle. The reason behind the discrepancy between serum myostatin and its expression in the muscle is not clear. Prior studies have generally not found a relationship of serum myostatin concentrations with either testosterone concentrations or lean mass (24, 25). To our knowledge, only one other study has assessed the effect of testosterone administration on serum myostatin in men. Lakshman et al. (25) studied the effect of testosterone administration for 20 weeks on serum myostatin concentrations in healthy young and elderly men who were hypogonadal because they also received long-acting GnRH agonists. There was a transient increase in myostatin concentrations after 8 weeks of testosterone therapy, but myostatin concentration returned to baseline at 20 weeks. Our data show that changes in myostatin expression in muscle are not reflected in serum myostatin concentrations. Serum myostatin concentrations may also represent myostatin production from other cells, such as lymphocytes or adipocytes.
Our study has a number of limitations. (i) Only four men in the placebo group agreed to provide muscle biopsies. Therefore, in contrast to placebo-controlled comparisons for plasma-based variables, we compared the gene expression in muscle after testosterone therapy with baseline (pretreatment) data. (ii) We did not measure physical activity in our study subjects. However, all subjects were asked at study visits to report any change in diet or physical activity. None of the subjects reported a change in physical exercise. (iii) We performed muscle biopsies 23 weeks after testosterone therapy. It is possible that the effects of testosterone soon after initiation of therapy on satellite cell activation and muscle differentiation markers were missed.
In summary, our data show that testosterone replacement results in an increase in plasma FGF2 concentration and FGF2 expression in skeletal muscle. These increases were significantly diminished in patients with HH. There was a parallel increase in plasma IGF1 concentrations. In addition, Mrf4 and myostatin expression were suppressed in the muscle. Our observations on the effects of testosterone replacement in men with HH and type 2 diabetes, as reflected in FGF2 and FGFR2 and related factors, may contribute to the understanding of testosterone’s effect on muscle.
Abbreviations:
- DEXA
dual-energy X-ray absorptiometry
- FGF
fibroblast growth factor
- FGFR
fibroblast growth factor receptor
- HH
hypogonadotropic hypogonadism
- MRF
myogenic regulatory factor
- Myf
myogenic factor
- MyoD
myogenic differentiation protein
Acknowledgments
The authors thank Zahid Sayeed for assistance in formatting and submission of this manuscript.
Financial Support: This work was supported by National Institute of Diabetes and Digestive and Kidney Diseases Grant R01DK075877 (to P.D.).
Clinical Trial Information: ClinicalTrials.gov no. NCT01127659 (registered 21 May 2010).
Author Contributions: P.D. put forth the hypothesis, planned and interpreted the study, and wrote the manuscript. H.G., S.A., and K.G. analyzed the samples. H.G. and S.D. wrote the manuscript. S.D., M.B., N.D.K., A.C., and A.M. executed the study and reviewed the manuscript. P.D., S.D., and H.G. are the guarantors of this work and, as such, have full access to all the data in the study and take responsibility for the integrity of the data and the accuracy of the data analysis.
Disclosure Summary: A.C. is a member of the Eli Lilly, Sanofi-Avenits speaker panel. P.D. received support from the National Institutes of Health, JDRF, ADA, Novo Nordisk, Bristol Meyer Squibb, AbbVie Pharmaceuticals, Astra Zeneca, and Boehringer Ingelheim Pharmaceuticals. P.D. has received honorarium from Eli Lilly, Novartis, GlaxoSmithKline, Merck, Novo Nordisk, Takeda, Sanofi-Aventis.
