


Abstract
To the best of our knowledge, no previous studies have examined the role of youth calcium intake in the development of impaired glucose metabolism, especially those with long-term high calcium intake.
To examine whether youth and long-term (between youth and adulthood) dietary calcium intake is associated with adult impaired glucose metabolism and type 2 diabetes (T2D).
The Cardiovascular Risk in Young Finns Study is a 31-year prospective cohort study (n = 1134; age, 3 to 18 years at baseline).
Dietary calcium intake was assessed at baseline (1980) and adult follow-up visits (2001, 2007, and 2011). Long-term (mean between youth and adulthood) dietary calcium intake was calculated.
Adult impaired fasting glucose (IFG) and T2D.
We found no evidence for nonlinear associations between calcium intake and IFG or T2D among females and males (all P for nonlinearity > 0.05). Higher youth and long-term dietary calcium intake was not associated with the risk of IFG or T2D among females or males after adjustment for confounders, including youth and adult body mass index.
Youth or long-term dietary calcium intake is not associated with adult risk of developing impaired glucose metabolism or T2D.
Primarily resulting from the increase in obesity during recent decades, the incidence of type 2 diabetes (T2D) has dramatically increased among children and adolescents (henceforth, termed youth) (1). Thus, it is important that the prevention of T2D begins at an early stage. However, only a few modifiable risk factors in youth have been examined for their associations with the development of adult T2D (2).
Recent data have raised concerns that calcium intake greater than the recommended levels is associated with an increased risk of cardiovascular disease (3) and mortality (4). For T2D, studies among adults have demonstrated conflicting results on the association of calcium intake with T2D (5–7). Moreover, no studies have examined the relationship between calcium intake in youth and the risk of developing impaired fasting glucose (IFG) or T2D in adulthood. This is important because calcium requirements vary by age, with previous studies of adults generally focused on populations with low or moderate average calcium intake (5–8). In particular, people in Northern European countries (e.g., Finland and Iceland) have had globally high calcium intake (9). Therefore, we aimed to describe the association between calcium intake in youth and from youth to adulthood with the risk of developing adult IFG and T2D in a study among Finns with a generally high calcium intake.
Methods
Participants
The participants were from the prospective Cardiovascular Risk in Young Finns Study (YFS), which began in 1980, and were followed up in 2001, 2007, and 2011. At baseline, 3596 participants aged 3 to 18 years had been randomly selected from the national register of the study areas. A 50% random sample of the participants was selected to participate in the dietary recall interview (n = 1768). Those participants who had type 1 diabetes or were pregnant at any follow-up visit were excluded from all analyses. The present analyses used data from 1134 participants who had dietary and risk factor data available from baseline and adult T2D data available. All participants gave written informed consent, and the local ethics committees approved the present study.
T2D and IFG
The participants were classified as having T2D if they met one of the following criteria: fasting plasma glucose ≥7 mmol/L (126 mg/dL); T2D diagnosed by a physician (10); hemoglobin A1c ≥6.5% (48 mmol/mol) at the 2011 follow-up visit; and the use of glucose-lowering medication at the 2007 or 2011 follow-up visit or as confirmed by the National Social Insurance Institution Drug Reimbursement Registry. IFG was defined as a fasting plasma glucose ≥5.6 but ≤6.9 mmol/L using the latest available measurement (11).
Dietary intake/diet
Diet was assessed by trained dietitians using a 48-hour dietary recall method in 1980 and 2001 and a food frequency questionnaire in 2007 and 2011. We recorded the type and amount of food eaten by the participant during the 2 days before the interview (12). Special computer software was used to calculate the dietary calcium intake (12). The long-term calcium intake was calculated as the mean value of calcium intake in youth (1980) and adulthood (mean of 2001, 2007, and 2011).
Other factors
Height and weight were measured in 1980, 2001, 2007, and 2011, and the body mass index (BMI) was calculated as the weight in kilograms divided by the height in square meters. The latest available measures were used as the adulthood BMI. The baseline serum 25-hydroxyvitamin D levels were measured as previously described (2). Information on smoking habits was collected during a medical examination in a solitary room. Youth smoking for participants aged <12 years in 1980 was defined on a daily basis from ages 12 to 18 years. For those aged 12 to 18 years in 1980, youth smoking was defined as regular cigarette smoking on a weekly basis (or more often). A physical activity index was calculated as previously described (13). In brief, we asked and summed the different variables regarding exercise and physical activity habits, including the intensity and frequency of exercise, athletic club attendance (frequency of participating in training at an athletic club), athletic competitions (whether participating in club, district, or national level competitions), leisure time (usual activities during spare time: indoors, mostly indoors, and mostly outdoors), and sports participation. A parent-completed questionnaire was used for participants aged 3 and 6 years, and self-completed questionnaires were used for those aged 9 to 18 years. This physical activity measure has been shown to be reliable and valid (14). Physical activity indexes were standardized by age. Questionnaires were used to obtain information on parental history of T2D and years of education.
Statistical analysis
The mean ± standard deviation and number and percentages were used, as appropriate, to describe the variables. We compared the baseline characteristics between the participants who had participated in the baseline dietary recall interview and those who had not and between the participants with complete data and those lost to follow up (or with incomplete baseline characteristics). Univariable and multivariable modified Poisson regression models (using a robust error variance) (15) were used to estimate the relative risk and 95% CIs for youth and long-term dietary calcium intake and the risk of adult IFG and T2D. All analyses were stratified by sex. We selected potential confounders according to the biological plausibility of an association of a factor with both the outcome and the exposure of interest, including age, BMI, serum 25-hydroxyvitamin D level, parental history of T2D, fruit and vegetable consumption, physical activity, smoking, socioeconomic status (parents’ years of education) at baseline, and adult BMI. The association of tertiles of long-term dietary calcium intake with the risk of adult IFG and T2D was further examined using the same method. We used restricted cubic splines to examine the potential nonlinear associations between calcium intake and outcomes (16). Nonlinearity was tested by comparing the log-likelihood of the new model with that of the linear model. A cutoff of 800 mg/d (median recommended intake for youth aged 6 to 17 years in Finland) was used to estimate the relative risk and 95% CIs of developing IFG and T2D at different calcium intakes. We created 10 imputations using linear regression for missing data for adulthood BMI (n = 13; 1%; the predictors included sex and childhood BMI and age) and long-term calcium intake (n = 198; 17%; the predictors included sex, childhood calcium intake and BMI, and adulthood BMI). We assumed all values were missing at random. We also performed a sensitivity analysis for the association of long-term calcium intake with IFG and T2D using the available data for long-term dietary calcium intake. All analyses were performed in Stata, version 15.1 (StataCorp, College Station, TX). A two-tailed P value < 0.05 was considered to indicate statistical significance.
Results
Of the 1134 participants (51% female) in the YFS, 50 developed T2D and 240 developed IFG. The comparison of the participants’ characteristics between females and males in youth and adulthood is presented in Table 1. At baseline, the mean ± SD intake of dietary calcium was 1019 ± 366 mg/d for females and 1270 ± 514 mg/d for males. Only five participants were taking calcium supplements (<0.5%). The long-term mean ± SD intake was 1181 ± 340 mg/d for females and 1398 ± 424 mg/d for males. No differences were found in the baseline characteristics between those who participated in the dietary interview and those who did not (data not shown) or between the participants who were followed up and those who were lost to follow up (17). A flowchart of participation has been provided in an online repository (17).
Participant Characteristics in Youth (1980) and Adulthood in the YFS
| Characteristic | Females (n = 578) | Males (n = 556) |
|---|---|---|
| Youth | ||
| Age, y | 10.6 ± 4.9 | 10.5 ± 5.0 |
| BMI, kg/m2 | 17.9 ± 3.1 | 18.0 ± 3.1 |
| 25OHD, nmol/L | 50.3 ± 15.6a | 53.4 ± 14.7a |
| Dietary calcium intake, mg/d | 1019 ± 366a | 1270 ± 514a |
| Physical activity index (z score) | −0.25 ± 0.90a | 0.22 ± 1.03a |
| Parental history of diabetes, n (%) | 13 (2) | 7 (1) |
| Fruit consumption (>6 times/wk), n (%) | 485 (84)a | 429 (77)a |
| Vegetable consumption (>6 times/wk), n (%) | 199 (34) | 196 (35) |
| Smokers, n (%) | 125 (22) | 180 (32)a |
| Parental years of education | 10.1 ± 3.4 | 10.0 ± 3.3 |
| Adulthoodb | ||
| Age, y | 41.6 ± 4.9 | 41.5 ± 5.0 |
| BMI, kg/m2 | 25.7 ± 5.1a | 27.0 ± 4.1a |
| Smokers, n (%) | 94 (16)a | 119 (22)a |
| Education status, n (%) | ||
| Grammar school | 76 (15) | 79 (16) |
| College or vocational school | 232 (44) | 242 (48) |
| University degree | 212 (41) | 184 (36) |
| Fasting glucose, mmol/L | 5.19 ± 0.73a | 5.54 ± 0.92a |
| Glucose category, n (%) | ||
| NFG | 483 (84)a | 361 (65)a |
| IFGc | 76 (13)a | 164 (29)a |
| T2D | 19 (3)a | 31 (6)a |
| Fruit consumption, g/d | 216 ± 209a | 172 ± 213a |
| Vegetable consumption, g/d | 294 ± 194a | 244 ± 172a |
Data presented as mean ± SD, unless otherwise noted.
Abbreviations: 25OHD, 25-hydroxyvitamin D; NFG, normal fasting glucose.
Statistically significant difference between females and males, P < 0.05.
All variables used data from the latest available values in adulthood (from 2001, 2007 and 2011); For adult variables, the number of participants was 1121 for BMI, 1128 for fasting glucose, 936 for fruit and vegetable consumption, 1118 for smoking and 1025 for education.
IFG cutoff was 5.6 mmol/L.
We found no evidence of nonlinear associations between youth or long-term calcium intake and IFG or T2D in females or males (P for nonlinearity > 0.05 for all; Figs. 1 and 2 ). In the unadjusted models, higher youth and long-term (youth to adulthood) dietary calcium intake was associated with an increased risk of IFG and T2D among males. However, these associations were attenuated and no longer statistically significant after adjustment for confounders, including youth and adult BMI (Table 2). Youth or long-term dietary calcium intake was not associated with IFG or T2D among females (Table 2) (17). The results remained largely similar in the sensitivity analysis using the available data for long-term dietary calcium intake (data not shown).
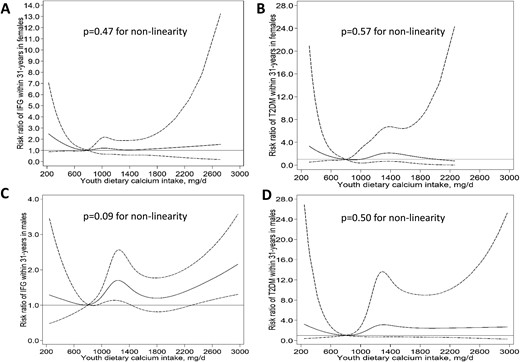
Restricted cubic splines for the nonlinear associations between youth dietary calcium intake, IFG, and T2D in (A, B) females and (C, D) males in the YFS. A calcium intake of 800 mg/d was used as the reference to estimate the relative risk of developing IFG and T2D at different calcium intakes. Solid and dashed lines denote relative risks and corresponding 95% CIs, respectively. T2DM, type 2 diabetes mellitus.
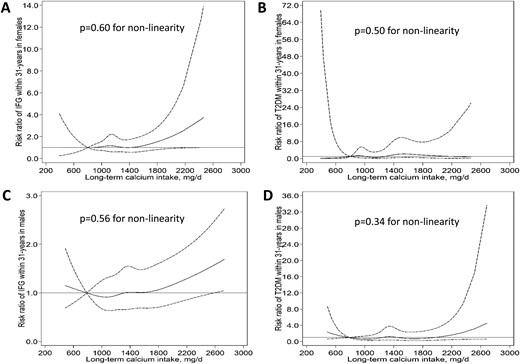
Restricted cubic splines for the nonlinear associations between long-term dietary calcium intake, IFG, and T2D in (A, B) females and (C, D) males in the YFS. A calcium intake of 800 mg/d was used as the reference to estimate the relative risk of developing IFG and T2D at different calcium intakes. Solid and dashed lines denote relative risks and corresponding 95% CIs, respectively. T2DM, type 2 diabetes mellitus.
Associations of Youth and Long-Term Dietary Calcium Intake With IFG and T2D in Adult Females and Males in the YFS
| Variable | Females | Males | ||
|---|---|---|---|---|
| n | RR (95% CI)a | n | RR (95% CI)a | |
| Youth calcium | ||||
| Model 1 | ||||
| NFG | 483 | 1.00 (Ref) | 361 | 1.00 (Ref) |
| IFGb | 76 | 0.90 (0.72–1.13) | 164 | 1.17c (1.05–1.30) |
| T2D | 19 | 1.08 (0.73–1.61) | 31 | 1.55c (1.20–2.01) |
| Model 2 | ||||
| NFG | 483 | 1.00 (Ref) | 361 | 1.00 (Ref) |
| IFG | 76 | 0.93 (0.74–1.17) | 164 | 1.11 (0.99–1.24) |
| T2D | 19 | 1.12 (0.71–1.79) | 31 | 1.31 (0.98–1.75) |
| Model 3 | ||||
| NFG | 483 | 1.00 (Ref) | 361 | 1.00 (Ref) |
| IFG | 76 | 0.93 (0.74–1.17) | 164 | 1.11 (0.99–1.24) |
| T2D | 19 | 1.11 (0.68–1.80) | 31 | 1.17 (0.83–1.64) |
| Long-term calcium | ||||
| Model 1 | ||||
| NFG | 483 | 1.00 (Ref) | 361 | 1.00 (Ref) |
| IFG | 76 | 1.04 (0.84–1.29) | 164 | 1.14c (1.02–1.28) |
| T2D | 19 | 1.37 (0.94–2.00) | 31 | 1.41c (1.01–1.98) |
| Model 2 | ||||
| NFG | 483 | 1.00 (Ref) | 361 | 1.0 (Ref) |
| IFG | 76 | 1.11 (0.91–1.36) | 164 | 1.08 (0.97–1.21) |
| T2D | 19 | 1.38 (0.98 1.94) | 31 | 1.05 (0.71–1.53) |
| Model 3 | ||||
| NFG | 483 | 1.0 (Ref) | 361 | 1.0 (Ref) |
| IFG | 76 | 1.11 (0.90–1.36) | 164 | 1.09 (0.97–1.22) |
| T2D | 19 | 1.39 (0.93–2.06) | 31 | 1.10 (0.72–1.69) |
Model 1, unadjusted; model 2, adjusted for age and childhood and adulthood BMI; model 3, model 2 plus baseline serum 25-hydroxyvitamin D levels, parental history of diabetes, fruit and vegetable consumption, physical activity, smoking, and socioeconomic status (parental education years).
Abbreviations: NFG, normal fasting glucose; Ref, reference; RR, relative risk.
RR for every SD (youth, 366 mg/d for females and 514 mg/d for males; long-term, 302 mg/d for females and 387 mg/d for males) of higher dietary calcium intake.
IFG cutoff was 5.6 mmol/L.
Statistically significant (P < 0.05).
Discussion
Using data from a cohort with, on average, high calcium intake, we found that neither youth nor long-term (child to adult) dietary calcium intake was associated with an increased risk of developing IFG or T2D in adulthood. The present study describes the association of youth and long-term dietary calcium intake with these outcomes in adulthood in cohorts with a high average intake of calcium. These findings suggest that higher dietary calcium intake might not confer an increased risk of developing impaired glucose metabolism or T2D in a population with calcium intake much higher than the recommended level (but lower than the tolerable upper intake level).
Important findings and possible explanations
The reported findings for the association between calcium intake and risk of T2D in adults have been contradictory (5–8). Overall, the participants in previous studies had a low to moderate average intake of calcium, with the investigators concluding that increased calcium intake was not, or inversely, was associated with T2D. For example, Lorenzo et al. (5) found that an increased serum calcium level, but not dietary calcium intake, was associated with increased risk of T2D in adults during a mean follow-up of 5.2 years (mean calcium intake, 942 mg/d; age, 40 to 69 years). In contrast, the Nurses’ Health Study showed that women (age, 30 to 55 years; mean calcium intake, 731 mg/d) in the highest category of calcium intake (>1200 mg/d) from all sources had a 21% lower risk of developing T2D compared with those in the lowest category (≤600 mg/d) (6). However, the association between dietary calcium intake and T2D was similar to our findings in females in the fully adjusted model. The analyses in the Nurses’ Health Study were stratified by prespecified cutoffs, which risks missing important associations. For example, it is unclear whether the association is linear and, if not, where and how the association changes, especially for those with high calcium intake. In the Shanghai Women’s Health Study, similar findings were observed (high calcium intake was associated with a lower risk of T2D) when the data were analyzed by fifths of calcium intake (7). However, the average intake of calcium was low (median, 466 mg/d). The median calcium intake of the highest fifth in the study was only 650 mg/d, much lower than the recommended level for adults. Therefore, these previous findings might not apply to populations with a higher average dietary calcium intake.
Although the exact mechanisms for the association between calcium and T2D remain unclear, those supporting a favorable role for calcium have suggested an adverse effect of low serum calcium concentrations on insulin secretion and other insulin actions (8). In contrast, increased serum calcium levels were associated with decreased insulin sensitivity but not insulin secretion in elderly men, even in participants with normal glucose and normal levels of serum calcium (18). In addition, recent epidemiological studies have found a positive association between increased serum calcium levels and the risk of T2D in adults (5, 19–22). The conflicting evidence might have resulted from differences in the serum calcium levels in the studied population, because the association between serum calcium concentration and the risk of T2D might differ by calcium level (5). In addition, a higher serum calcium level might not reflect high calcium intake but rather be an indicator of hyperparathyroidism, which can be attributed to long-term insulin insufficiency or insulin resistance, leading to an increased risk of T2D (23). Future studies should consider the potential threshold effect of calcium intake or serum calcium levels on the development of T2D and related outcomes with consideration of the effect of the serum PTH levels.
Only a few randomized controlled trials (RCTs) have examined the effect of calcium supplementation on T2D development in adults, and these results were also conflicting (24, 25). In 20 patients without diabetes but with essential hypertension, calcium supplementation of 1500 mg/d vs placebo for 8 weeks improved insulin sensitivity but did not affect fasting glycemia (25). However, a two-by-two factorial-design RCT of 92 adults found no effect of twice-daily 400-mg calcium supplementation (calcium plus vitamin D or vitamin D placebo) vs no calcium (calcium placebo plus vitamin D or vitamin D placebo) for 16 weeks on pancreatic β-cell function, acute insulin response, insulin sensitivity, or measures of glycemia (24). The participants in the control group of the smaller RCT continued with a low calcium intake (~500 mg/d), and the participants in the larger study had a moderate calcium intake at baseline (mean, 976 mg/d). These data suggest calcium supplementation might only be effective at reducing the risk of T2D among those with a low calcium intake. It has been suggested that calcium supplementation, but not a high intake of dietary calcium, increases the risk of cardiovascular disease (3, 26). However, our ability to examine calcium supplementation was limited owing to the low rate of supplementation (<0.5% in the youth and 8% in adulthood in the YFS). Thus, this should be examined in future research of people with a high rate of calcium supplementation. Moreover, a 6-month, small RCT (n = 95) showed that daily supplementation of calcium (1200 mg of calcium carbonate) combined with vitamin D (2000 to 6000 IU/d of cholecalciferol) improved insulin sensitivity in middle-age adults with prediabetes and low vitamin D levels (27). However, future research is needed to clarify whether this benefit results from calcium or vitamin D.
Methodological considerations and limitations
The strength of the present study was the analysis of data from a cohort with long-term follow-up in a population-based sample, enabling the examination of childhood factors and adult health outcomes. However, the present study had limitations. Youth dietary calcium intake was measured using the 48-hour recall method, which captures limited intraindividual variability. However, the long-term calcium intake was determined from data from four measurement points (two using the food frequency questionnaire), which partly overcome this limitation. Moreover, we had a small number of patients with T2D and participants with very low calcium intake (only 5% with <800 mg/d for the long-term intake). Therefore, we could not rule out the possible association between calcium intake and T2D in those with very low calcium intake. Also, our total sample size was relatively small. Although the statistical power for IFG appeared to be sufficient, studies of similar settings but with larger sample sizes are needed to confirm our findings regarding T2D before any potential risk of high calcium intake can be ruled out. Although, at baseline, no patient was reported to have T2D, we could not determine the baseline status of IFG because the fasting glucose levels had not been measured. Nevertheless, the rate of IFG at baseline was likely to be very low because of the younger age (mean age, 10.6 years) and very low rate of obesity (1%) in our childhood sample. Only 3.2% of the participants aged 18 years had IFG (measured in 2008) in the STRIP study (special Turku coronary risk factor intervention project) among Finns, which had an obesity rate of 3.6% (unpublished data). We had participants who had been lost to follow-up; however, we have previously shown that these samples were representative of the original cohorts (28, 29), which was again confirmed in the present study. Moreover, the results remained largely similar when a complete case analysis was conducted (i.e., no imputation for long-term calcium intake), suggesting a minor influence from the missing data on our findings.
Conclusions and Policy Implications
Our results have shown that dietary calcium intake in youth and between youth and adulthood is not associated with the risk of IFG or T2D in adulthood in a population with a calcium intake much greater than the recommended level (but lower than the tolerable upper intake levels). This finding should be considered in assessing the balance of risks and benefits of a high calcium intake to improve calcium-associated health outcomes.
Abbreviations:
- BMI
body mass index
- IFG
impaired fasting glucose
- RCT
randomized controlled trial
- T2D
type 2 diabetes
- YFS
Cardiovascular Risk in Young Finns Study
Acknowledgments
We thank Noora Kartiosuo for compiling data from the YFS for the present study. We also thank all the volunteers and participants involved in the present study.
FinancialSupport: The Young Finns Study has been financially supported by the Academy of Finland [grants 286284, 134309 (Eye), 126925, 121584, 124282, 129378 (Salve), 117787 (Gendi), and 41071 (Skidi)]; the Social Insurance Institution of Finland; Competitive State Research Financing of the Expert Responsibility area of Kuopio, Tampere and Turku University Hospitals (grant X51001); Juho Vainio Foundation; Paavo Nurmi Foundation; Finnish Foundation for Cardiovascular Research; Finnish Cultural Foundation; The Sigrid Juselius Foundation; Tampere Tuberculosis Foundation; Emil Aaltonen Foundation; Yrjö Jahnsson Foundation; Signe and Ane Gyllenberg Foundation; Diabetes Research Foundation of Finnish Diabetes Association; European Union Horizon 2020 (grant 755320 for TAXINOMISIS); European Research Council (grant 742927 for MULTIEPIGEN project); and Tampere University Hospital Supporting Foundation. The present study was supported by the National Health and Medical Research Council Project (grant APP1098369). C.G.M. was supported by a National Heart Foundation of Australia Future Leader Fellowship (no. 100849). F.W. is supported by a National Health and Medical Research Council Early Career Fellowship (no. APP1158661). They did not have any role in the study concept, design, data analysis, manuscript writing, or submission of the manuscript for publication. The researchers were totally independent of the funders.
Author Contributions: F.W., C.G.M., and M.J. were involved in the study design. M.J., N.P., A.J., T. Lehtimäki, K.P., M.K., T. Laitinen, J.S.A.V., and O.T.R. were responsible for data collection and management. F.W. performed data analysis, in consultation with C.G.M. and M.J. F.W. drafted the manuscript. All the authors revised the manuscript content and approved the final manuscript and had access to the data. J.S.A.V. contributed to the initial design of the Young Finns Study. O.T.R. leads the Young Finns Study and contributed to obtaining funding and to the study design. C.G.M. and O.T.R. are the guarantors of the study and accept full responsibility for the finished article, had access to any data, and controlled the decision to submit for publication.
Disclosure Summary: The authors have nothing to disclose.
References
Author notes
O.T.R. and C.G.M. contributed equally to this work.
