


Abstract
Despite extensive searches for novel noninvasive diagnostics, laparoscopy remains the reference test for endometriosis. Circulating miRNAs are purported endometriosis biomarkers; however, the miRNA species and their diagnostic accuracy differ between studies and have not been validated in independent cohorts.
Identify endometriosis-specific plasma miRNAs and determine their diagnostic test accuracy.
Two university-based, public hospitals and a private gynecology practice in Australia.
Four phases: (i) Explorative phase. Plasma miRNA menstrual cycle fluctuations were evaluated in women with endometriosis and asymptomatic controls (n = 16). (ii) Biomarker discovery. Endometriosis-specific plasma miRNAs were identified in (a) women with endometriosis and asymptomatic controls (n = 16) and (b) women with and without surgically defined endometriosis (n = 20). (iii) Biomarker selection. Plasma miRNAs with the best diagnostic potential for endometriosis were selected in a surgically defined selection cohort (n = 78). (iv) Biomarker validation. The diagnostic test accuracy of these miRNAs was calculated in an independent, surgically defined validation cohort (n = 119).
Forty-nine miRNAs were differentially expressed in women with endometriosis. Nine maintained dysregulation in the selection cohort, but only three (miR-155, miR574-3p and miR139-3p) did so in the validation cohort. Combined, these three miRNAs demonstrated a sensitivity and specificity of 83% and 51%, respectively.
Plasma miRNAs demonstrated modest sensitivity and specificity as diagnostic tests or triage tools for endometriosis. Other groups’ findings were not replicated and accorded poorly with our results. Circulating miRNAs demonstrate diagnostic potential, but stringent, standardized methodological approaches are required for the development of a clinically applicable tool.
Endometriosis afflicts 5% to 10% of reproductive aged women, who suffer dysmenorrhea, chronic pelvic pain, and infertility. The gold standard diagnostic test for endometriosis is laparoscopic visualization of lesions, as noninvasive tests are not accurate enough to replace surgical diagnosis (1–3). The expense and inaccessibility of laparoscopic surgery contribute to an average diagnostic delay of 6 to 12 years (4) and significant societal costs (5). Even when undertaken, laparoscopy demonstrates only 94% sensitivity and 79% specificity for detecting endometriotic lesions (6).
miRNAs are 9- to 22-nucleotide-long, non–protein-encoding RNAs that posttranscriptionally regulate gene expression via suppression of specific target mRNAs (7). These small RNAs regulate ∼30% of the human genome in most biologic pathways (8, 9). miRNAs also act as systemic messengers, being secreted into the circulation in exosomes, which are then taken up by cells at distant sites, where they modulate recipient cell function (10).
Differentially expressed miRNAs have been identified in ectopic endometrium where they regulate specific gene networks (11–13). Our recent systematic review identified six papers that compared circulatory miRNA profiles in women with and without endometriosis (14). Several blood-based, miRNA-based test panels were identified as having potential as noninvasive diagnostic tests for endometriosis (14–18). However each study reports a different set of biomarkers for endometriosis with varying levels of diagnostic accuracy. This inconsistency demonstrates that a definitive set of circulating miRNAs that reliably distinguishes endometriosis and control patient groups has not been identified. There are additional challenges to be addressed before a clinically useful plasma miRNA-based test for endometriosis becomes available.
First, hormonal fluctuations across the menstrual cycle could confound circulating miRNA profiling in women of reproductive age, potentially explaining the disparity between studies. miRNA-regulated genes are involved in ovarian steroidogenesis, and their expression is modulated by ovarian steroid hormones and hormone antagonists (19, 20). Although cycle phase changes in circulating miRNA levels were not seen in healthy women (21), cycle phase effects have not been tested in women with endometriosis. The evaluation of circulating miRNA cycle phase differences is critical to establish the reliability of a test using blood drawn at different menstrual cycle phases or from women using hormonal contraception.
The abundance of miRNAs varies greatly between plasma samples, even if the relative balance of individual miRNAs does not. Data normalization corrects for quantitative differences between samples, a crucial step in molecular diagnostic test development (22). This could account for the lack of consistency seen in endometriosis miRNA-profiling studies (23–27), as different normalization techniques were used and many of the comparators are now considered weak normalizers. As the most suitable “normalization” strategy for plasma miRNA data in endometriosis is not defined, several normalization strategies need to be compared to ensure that the accuracy of the data are not altered by quantitative artifacts from sample variability.
Results in endometriosis studies could also vary depending on the control comparator group. Although distinguishing symptomatic women with and without endometriosis is the most clinically relevant diagnostic design, symptomatic women without endometriosis commonly have conditions such as adenomyosis, fibroids, irritable bowel syndrome, or pelvic pain sequelae, which could influence plasma miRNA signatures. Furthermore, restricting the comparator group to symptom-free volunteers could miscategorize women with painless endometriosis, as it is ethically unjustifiable to perform laparoscopic surgery in healthy recruits to assign a disease-free status. The most valid methodology is to compare both surgically defined, endometriosis-free and asymptomatic, healthy control groups to women with surgically-defined endometriosis.
Finally, diagnostic test development requires biomarker testing and validation in large independent cohorts using Standards for Reporting of Diagnostic Accuracy Studies (STARD) guidelines (28), which has not been undertaken in any published study to date. High-quality studies prospectively sample blood from consecutively recruited women who are undertaking diagnostic surgery to investigate endometriosis-like symptoms. Expertise in surgical diagnosis, accurate staging of endometriosis, objective evaluation of menstrual cycle phase, and blinded surgeons and data analysts are critical methodological steps for defining diagnostic test accuracy.
To evaluate the diagnostic test accuracy of plasma miRNAs in detecting endometriosis and address the methodological concerns raised in our literature review, a stepwise experimental approach was developed to assess the diagnostic test accuracy of plasma miRNA profiles in endometriosis (Fig. 1). The effects of menstrual cycle phase and normalization method were evaluated in the explorative phase. In the biomarker discovery phase, two microarray comparisons identified differentially regulated plasma miRNAs in (i) women with and without surgically defined endometriosis and (ii) women with endometriosis and asymptomatic healthy women. In the biomarker selection phase, plasma miRNAs with the highest diagnostic test accuracy for endometriosis were selected for their potential to be incorporated into a diagnostic test. In the biomarker validation phase, these most promising plasma miRNAs were tested for their diagnostic test accuracy in a further, large independent cohort.
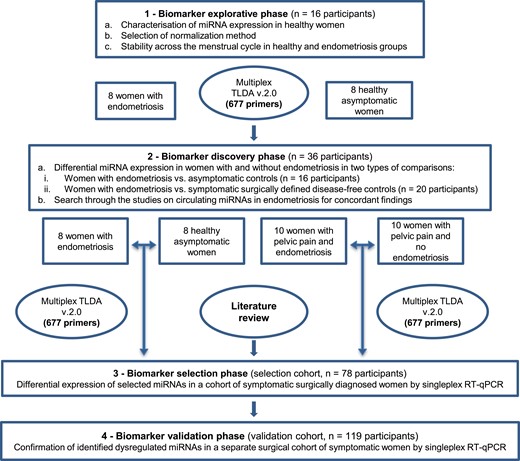
Study design and flow of participants through each phase of the study.
Materials and Methods
Ethical approval
The study was approved by the Human Research Ethics Committees of the Women’s and Children’s Hospital, the Burnside War Memorial Hospital (Adelaide, SA, Australia; REC 2121/11/11), and the Royal Women’s Hospital (Melbourne, VIC, Australia; project 05/35). All participants provided written informed consent before blood collection.
Study design and study populations
The project included two preliminary case-control experiments and two cohort studies as presented in Fig. 1. We report the laboratory experiments in accordance with minimum information about a microarray experiment guidelines (29) and the minimum information for publication of quantitative real-time PCR experiments guidelines (30). The cohort experiments were conducted and reported in accordance with STARD guidelines (28). The study participants were recruited from the tertiary, university public Women’s and Children’s Hospital and the private Burnside War Memorial Private Hospital in Adelaide, SA, Australia (the selection cohort) and the Royal Women’s Hospital in Melbourne, VIC, Australia (the validation cohort). All participants were 18 to 50 years of age. Inclusion criteria varied in each experimental phase as detailed below. Exclusion criteria for all recruits were presence of infection, an allergic response, surgery within the 3 months before the blood sample, and a history of malignancy or autoimmune disease. In all clinical cohorts, the participants’ demographic data and full medical histories were recorded preoperatively. The phase of cycle was defined as early proliferative (days 0 to 5), late proliferative (days 6 to 14), or secretory (days 15 to 35). Endometriosis was diagnosed by direct visualization of endometriotic lesions in the pelvic cavity during surgery and, where possible, histological confirmation of lesions. The revised American Society of Reproductive Medicine (rASRM) classification system was used to categorize the severity of endometriosis. Laparoscopy was performed by several surgical teams, all of which included a senior gynecological surgeon with >10 years of experience in the diagnosis and management of endometriosis.
Explorative phase
The impact of the menstrual cycle on plasma miRNA levels was evaluated in women with surgically diagnosed endometriosis and in healthy, asymptomatic women. A multiplex RT-PCR microarray analysis was undertaken using plasma miRNA samples taken at three different phases of the menstrual cycle (menstrual, proliferative, and secretory) from both groups of women. These data were also used to determine the most effective normalization methods for subsequent multiplex quantitative real-time PCR (RT-qPCR) microarray and singleplex RT-qPCR plasma miRNA experiments.
In both groups, participants were enrolled when they met the inclusion criteria of having regular 21- to 31-day menstrual cycles, not using hormonal therapy for at least 3 months, and having blood collected in three phases of the cycle. The hormone profile at the time of phlebotomy had to be consistent with the cycle phase in both groups: early proliferative phase [day 3 to 5, blood levels of estradiol (E2) <265 pmol/L and progesterone (P4) <4 nmol/L), late proliferative phase (day 9 to 12, E2 of 350 to 1500 pmol/L and P4 <4 nmol/L), and mid-secretory phase (day 18 to 24, E2 >150 pmol/L and P4 >12 nmol/L).
Asymptomatic healthy volunteers (n = 8) were enrolled from a group of women who responded to a recruitment poster. A detailed medical history was taken to ensure participants in this group did not have a history of abdominal pain or pathologies such as pelvic inflammatory disease, irritable bowel syndrome, or primary dysmenorrhea. None had medical, surgical, autoimmune, or genetic conditions, was taking any medications, smoked, or had a family history of endometriosis. The endometriosis group (n = 8) was prospectively recruited from outpatient clinics at the Women’s and Children’s Hospital and from a private gynecology practice at the Burnside War Memorial Hospital and comprised women with pelvic pain scheduled for a laparoscopic gynecological procedure. In the surgical control group, blood was collected in the 2 months prior to surgery and only used when endometriosis was visualized at surgery.
Biomarker discovery phase
An analysis of plasma miRNA signatures detected by RT-PCR microarray profiling compared (i) healthy asymptomatic controls (n = 8) and surgically defined women with endometriosis (n = 8), and (ii) symptomatic women who had been surgically diagnosed as having endometriosis (n = 10) or being endometriosis-free (n = 10). The former comparison used explorative phase data globally (samples from all cycle phases) and in three individual cycle phase comparisons. The second comparison recruited consecutive women with pelvic pain and/or infertility scheduled for laparoscopy for clinically suspected endometriosis at the Women’s and Children’s Hospital and the Burnside War Memorial Hospital between March 2010 and October 2012. Patients were excluded when they took hormonal therapy. Blood was collected at induction of anesthesia at any phase of the menstrual cycle.
Biomarker selection phase
A prospective cohort study was implemented to corroborate the differential expression and diagnostic potential of the previously identified plasma miRNAs and to select biomarkers with the most potential for use in a diagnostic test for endometriosis. Seventy-eight women with symptoms of endometriosis (dysmenorrhea, dyspareunia, chronic pelvic pain, or infertility) were consecutively recruited at a preadmission clinic before surgery at the Women’s and Children’s Hospital and the Burnside War Memorial Hospital between March 2010 and February 2012. In 51 women endometriosis lesions were identified at surgery, 36 having minimal–mild (rASRM stage I to II) and 15 having moderate–severe (rASRM stage III to IV) endometriosis. In this cohort, the 27 women who did not have identifiable endometriotic lesions comprised the control group. Blood was collected at induction of anesthesia, irrespective of cycle phase or previous hormonal treatment.
Biomarker validation phase
Validation of the diagnostic potential of the most promising miRNAs was carried out in a second independent validation cohort of women. The validation cohort comprised 119 women having a laparoscopy for one or more symptoms (dysmenorrhea, dyspareunia, and chronic pelvic pain) recruited from the gynecology preadmission clinic at the Royal Women’s Hospital between May 2006 and February 2009. Of these, 80 women had surgical confirmation of endometriosis (study group) and 39 women were disease-free and categorized as being in the control group. Blood samples were prospectively collected 1 to 2 weeks prior to surgery irrespective of the menstrual cycle phase.
Evaluation of miRNA expression
Sample collection and miRNA extraction
miRNA isolation from plasma is more time efficient, better controlled, and extracts 10% to 15% more RNA from the same amount of blood, when compared with serum (31–33). Blood (5 to 8 mL) was collected into EDTA tubes stored at 4°C. Within 2 hours, plasma was separated by centrifugation at 1200 × g for 10 minutes at 4°C and stored in aliquots at −80°C. Total RNA was extracted from 0.5 mL of plasma using TRIzol LS reagent for liquid samples (Invitrogen, Carlsbad, CA), followed by chloroform purification and isopropanol precipitation according to the manufacturer’s protocols. The final RNA pellet was dissolved in 10 μL of diethyl pyrocarbonate–treated water and stored at −80°C. Fixed volumes rather than fixed amounts of RNA were used because of its low yield in plasma (34).
Given the limited options to assess the quality of our samples, spike-ins were employed as an important tool for evaluating RNA extraction quality. A spiked-in synthetic template (35) [25 fmol Caenorhabditis elegans miRNA (cel-miR-54)] was added after TRIzol to evaluate the quality of each extraction. Triplicate, RT-qPCR reactions measured the cel-miR-54 levels and a SD of the raw quantification cycle (Cq) was calculated for each PCR plate. Samples in which cel-miR-54 deviated by >2 SD within the same plate were considered as poorly recovered and were subsequently reextracted from the original plasma sample. The SD of the raw Cq values for each PCR plate was low for the experimental replicates, indicating a satisfactory and comparable RNA extraction efficiency. RT-qPCR was performed as described in “Singleplex RT-qPCR experiments” below. The yield was assessed by small RNA chips for Agilent’s Bioanalyzer 2100 (Agilent Technologies, Waldbronn, Germany). Across the collection of plasma samples, 41% to 97% of total small RNAs were identified. All experiments were performed by experienced operators (V.N., Z.W., and D.J.S.) blinded to the clinical data. In our preliminary experiments we have confirmed that interoperator variability did not exceed the intraexperimental variability when the same person performed RNA extraction, demonstrating the reproducibility of the technique. RNA extraction was not undertaken on any hemolyzed blood samples.
Multiplex RT-qPCR array experiments
TaqMan low-density human miRNA array (TLDA) v2.0 microfluidic card sets A and B were used to screen 667 human miRNAs (Applied Biosystems, Foster City, CA) in the explorative and biomarker discovery phases. Sample RNA (3 µL) was reverse transcribed and then preamplified in 25-µL reactions according to the manufacturer’s protocols (Applied Biosystems). Preamplified cDNA in 75 μL of nuclease-free water was stored at −20°C before amplification with MegaPlex human pool PCR primers using an ABI 7900HT thermal cycler (Applied Biosystems), which was performed under the following cycling conditions: 95°C for 10 minutes, followed by 55 cycles of 95°C for 15 seconds and 60°C for 1 minute. The nonmammalian negative control (miR-159a) did not amplify, whereas the positive array control, mammalian U6, was amplified on both cards in all experiments.
Raw Cq values were obtained using SDS v.2.3 and RQ Manager v.1.2 software (automatic baseline, threshold of 0.1). miRNA expression was defined by a Cq cutoff of ≤32.0, above which detectors were excluded, as were those that failed amplification. Detectors expressed in <50% of samples in both study and control populations were also removed from the data. The amplification efficiency was assessed by visual inspection of each of the remaining miRNA amplification curves. Amplification was considered adequate when (i) background noise was below the baseline, (ii) the exponential phase demonstrated a strong upward swing and the threshold crossed a linear part of the slope, and (iii) there was a clearly defined plateau phase.
The raw data have been submitted to the Gene Expression Omnibus repository (www.ncbi.nlm.nih.gov/projects/geo), accession no. GSE46735.
Singleplex RT-qPCR experiments
Single TaqMan miRNA assay kits (Applied Biosystems) were used to measure individual plasma miRNA levels by RT-qPCR. Briefly, 2.5 μL of RNA was reverse transcribed in a 7.5-μL reaction before PCR amplification in a final volume of 10 μL. Three technical replicates per sample were run concurrently with no reverse transcription and no template controls on an ABI 7900HT thermal cycler (cycling conditions as in TLDA experiments). SDS v2.3 software (Applied Biosystems) (automatic baseline, threshold of 0.2) was used to generate the Cq values, and a Cq value >35 indicated the absence of the target miRNA (36). Replicate Cq values were averaged when the SD of all replicates was <0.5; otherwise, outliers were excluded from the analysis. An endogenous control (normalizer) was included on each plate to calculate the ΔCt from the tested samples, alleviating the need for the inclusion of an internal calibrator.
Amplification efficiency was assessed by standard curves generated for each assay based on five 10-fold serial dilutions of the input sample, made up from pooled RT product from the tested samples. Amplification efficiency based on the slope of Cq plotted against the logarithm of the amount of input miRNAs was calculated using as log210−1/slope. A corrected Cq corresponds to the predicted averaged Cq values if amplification occurred at 100% efficiency and was determined using the formula: efficiency calibrated Cq = Cq × log base 2(10−1/slope).
Normalization strategy for plasma miRNAs
Normalization for wide-scale array experiments
Four normalization strategies for wide-scale array experiments were assessed across the 47 samples in the first phase of the study: (i) quantile normalization (37), (ii) rank invariant normalization (38), (iii) normalization to the reference (housekeeping) miRNAs detected with the GeNorm algorithm (39), and (iv) normalization against mammalian U6 miRNA. For the GeNorm method, an average expression stability value (M) was calculated for all detectable miRNAs present in all samples. miRNAs with the lowest M values are the most stable. The optimal number of endogenous controls required for accurate normalization was calculated from the pairwise variation values [V(n/n + 1)] between each combination of sequential normalization factors, using a cutoff value of 0.15, below which the inclusion of any additional controls did not improve the precision (39). All normalization was performed in LIMMA in R (40), qPCRNorm (41), and SLqPCR R (42) Bioconductor packages (www.bioconductor.org/). The normalization methods were compared using the coefficient of variation and visual inspection of graphs of the differently normalized data sets (Fig. 2a and 2b). Quantile normalization (34) resulted in data with the lowest mean miRNA-specific coefficient variation (Fig. 2c) and was selected as the method of choice for both multiplex RT-qPCR array analyses in the biomarker discovery phase.
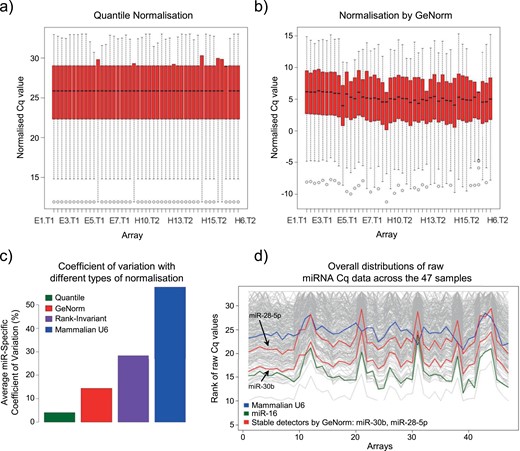
Determination of most appropriate normalization method for wide-scale array experiments. (a and b) Degrees of dispersion and skewness in the data when different normalization approaches were used, including quantile normalization (a) or normalization by GeNorm (b), are shown, with minimal and maximal observations represented by whiskers, the median shown as a black line, and lower and upper quartile by a red box. (c) Quantile normalization resulted in data with the lowest mean miRNA-specific coefficient of variation when all four different normalization approaches were compared. (d) Overall distributions of raw miRNA Cq data across 47 samples are shown in gray, whereas evaluated normalizers, including mammalian U6 (blue), miR-16 (green), and stable normalizers identified using GeNorm (red), are highlighted.
Normalization for singleplex RT-qPCR experiments
The quantile method is not applicable to individual assays, which require a specific normalizer. Previously used mammalian U6 (or RNU6B) (12, 15, 18, 43–51) and miR-16 (16) were excluded as normalizers, as they only loosely approximated the distribution of the raw miRNA Cq data (Fig. 2d). Furthermore, mammalian U6 demonstrated a high M value, indicating low stability and abundance, whereas miR-16 exhibited differential expression in endometriosis, consistent with other reports from endometrial tissues and the circulation (44, 51, 52). The five miRNAs with the lowest M values (miR-28-5p, miR-30b, miR-30a, miR-30d, miR-30e-5p) closely approximated the distributions of raw miRNA Cq data and were considered as possible endogenous controls (Fig. 2d).
These GeNorm-identified endogenous controls and, for completeness, the three controls used by other groups [miR-16 (16), miR-132 (17), and RNU6B (12, 15, 18, 43–51)] were evaluated using RT-qPCR in the 78 samples from the biomarker selection cohort. Up to two endogenous controls were sufficient to normalize miRNA expression levels [V 2/3 = 0.008 − 0.012 (array data) and V 2/3 = 0.015 (individual assays)] in a pairwise analysis. miR-28-5p and miR-30b were superior to all other evaluated normalizers as they (i) were readily detected and demonstrated little variation across the samples, (ii) showed no expression differences between the endometriosis and control groups, and (iii) exhibited excellent assay linearity in serial dilutions of the purified RNA samples. The average of these two endogenous controls performed as well as each individual control in normalizing the data set, and therefore miR-30b was chosen to normalize the validation experiments. The list of normalizers evaluated in this study with their miRBase accession number, target sequences, and amplification efficiencies are presented in Table 1.
Primer Sequences and Amplification Efficiencies of Evaluated Normalizers for Singleplex Assays and miRNAs Used in Validation Cohort
| Assay Name | miRBase Accession No. | miRBase Name | Target Sequence (5′→3′) | Slope | PEA | EA | DR | R2 | Selected as Normalizer |
|---|---|---|---|---|---|---|---|---|---|
| miR-16 | MIMAT0000069 | hsa-mir-16-5p | UAGCAGCACGUAAAUAUUGGCG | −4.35 | 76% | 1.6978 | 5 | 0.991 | Jia et al., 2013 (16) |
| miR-28-p | MIMAT0000085 | hsa-mir-28-5p | AAGGAGCUCACAGUCUAUUGAG | −3.77 | 88% | 1.8430 | 4 | 0.996 | GeNorm (our experiment) |
| miR-30a | MIMAT0000087 | hsa-mir-30a-5p | TGTAAACATCCTCGACTGGAAG | −3.89 | 86% | 1.8088 | 4 | 0.998 | GeNorm (our experiment) |
| miR-30b | MIMAT0000420 | hsa-mir-30b-5p | UGUAAACAUCCUACACUCAGCU | −3.76 | 88% | 1.8442 | 5 | 0.996 | GeNorm (our experiment) |
| miR-30d | MIMAT0000245 | hsa-mir-30d-5p | TGTAAACATCCCCGACTGGAAG | −3.89 | 85% | 1.8080 | 4 | 0.997 | GeNorm (our experiment) |
| miR-30e | MIMAT0000692 | hsa-mir-30e-5p | TGTAAACATCCTTGACTGGAAG | −3.87 | 86% | 1.8136 | 4 | 0.998 | GeNorm (our experiment), |
| Rekker et al., 2015 (40) | |||||||||
| miR-132 | MIMAT0000426 | hsa-mir-132-3p | UAACAGUCUACAGCCAUGGUCG | −3.22 | 103% | 2.0430 | 5 | 0.992 | Suryawanshi et al., 2013 (17) |
| RNU6B | NR_002752 | sn rna U6 (RNU6B) | CGCAAGGATGACACGCAAATTCGTGAAGCGTTCCATATTTTT | −2.89 | 115% | 2.2183 | 2 | 0.999 | Others |
| miRNAs used in validation cohort | |||||||||
| miR-9* | MIMAT0000442 | hsa-mir-9-3p | ATAAAGCTAGATAACCGAAAGT | −3.213 | 103% | 2.0476 | 3 | 0.998 | |
| miR-29c | MIMAT0000681 | hsa-mir-29c-3p | UAGCACCAUUUGAAAUCGGUUA | −4.19 | 79% | 1.7325 | 5 | 0.995 | |
| miR-135b | MIMAT0000758 | hsa-mir-135b-5p | UAUGGCUUUUCAUUCCUAUGUGA | −3.148 | 106% | 2.0781 | 2 | 0.964 | |
| miR-139-3p | MIMAT0004552 | hsa-mir-139-3p | GGAGACGCGGCCCUGUUGGAGU | −3.887 | 86% | 1.8083 | 3 | 0.996 | |
| miR-141* | MIMAT0004598 | hsa-mir-141-5p | CATCTTCCAGTACAGTGTTGGA | −2.655 | 125% | 2.3804 | 2 | 0.883 | |
| miR-145* | MIMAT0004601 | hsa-mir-145-3p | GGATTCCTGGAAATACTGTTCT | −3.372 | 99% | 1.9795 | 3 | 0.996 | |
| miR-155 | MIMAT0000646 | hsa-mir-155-5p | UUAAUGCUAAUCGUGAUAGGGGU | −4.639 | 72% | 1.6427 | 5 | 0.905 | |
| miR-574-3p | MIMAT0003239 | hsa-mir-574-3p | CACGCUCAUGCACACACCCACA | −3.412 | 97% | 1.9637 | 5 | 0.986 | |
| miR-923 | MI0005715 | hsa-mir-923 | GTCAGCGGAGGAAAAGAAACT | −4.450 | 75% | 1.6777 | 4 | 0.995 | |
The percentage of amplification efficiency (PEA) was determined as (log 2 EA) × 100% [EA = 2^PEA], where amplification efficiency (EA) is 10−1/slope.
Abbreviations: DR, dynamic range; R2, coefficient of determination in regression model.
Hormonal assays and measurement of CA-125
All hormone assays were performed in the endocrine laboratory of the Women’s and Children’s Hospital. Serum levels of E2, P4, LH, and CA-125 were measured by commercially available automated assays performed on an ADVIA Centaur XP instrument (Siemens, Munich, Germany) according to the manufacturer’s instructions.
Statistical analysis
Demographic and clinical characteristics were compared using the Student t test for normally distributed data. The Mann–Whitney U test was used for small sample sets or when normal distributions of the data were not confirmed with the Shapiro–Wilk test for continuous variables. Fisher’s exact test was used for categorical variables. Values are expressed as mean ± SD or medians (range).
For miRNA expression analyses we used a principle of the 2−ΔΔCq method for a relative quantification of RT-qPCR data, which assumes logarithmic transformation of the normalized Cq values (53). Because raw Cq values are logarithmic in nature and may grossly underestimate the true degree of variation within the tested cohort, that would be evident on a linear scale (54). Therefore, we converted the normalized (ΔCq) values to the linear values of relative expression and compared these transformed values between the groups (disease vs controls). Relative expression was calculated by the equation 2−quantile-normalized Cq in the TLDA experiments and 2−∆Cq = 2 − [Cq target − Cq normalizer] in singleplex RT-qPCR. Fold change was calculated as 2−(normalized Cq in endometriosis − normalized Cq in controls).
Empirical Bayesian moderation of standard errors and linear models for microarray data (LIMMA Bioconductor R package) were used for the TDLA data (41). Direct comparisons between endometriosis and control groups were made using moderated t statistics. The factorial design approach compared miRNA profiles between more than two groups. For the microarray data, corrections for multiple testing were controlled by setting the false discovery rate at 5% using the Benjamini–Hochberg method (36). Considering the exploratory “hypothesis-generating” nature of the array experiments and to avoid too many type 2 errors, the correction for multiple testing was not a mandatory exclusion criterion in the discovery phase experiment. Therefore, the differentially expressed targets at non–false discovery rate-adjusted P values <0.05 were selected as suitable for further exploration in the larger data sets (55). To identify plasma miRNAs with consistent abundance across the menstrual cycle, equivalence testing was performed using the tost method (ε = 1, α = 0.05) from the R equivalence package (56, 57).
For the singleplex RT-qPCR experiments, the Mann–Whitney U or Kruskal–Wallis test (two-sided with a P value of <0.05) was used to determine statistical significance. The Spearman rank order correlation test was used to examine correlation relationships between the variables. Very high correlation was defined by correlation coefficients (rs) of 0.9 to 1.0, high correlation by rs of 0.7 to 0.9, moderate correlation by rs of 0.5 to 0.7, low correlation by rs of 0.3 to 0.5, and little if any correlation by rs of <0.3. Statistical analyses were performed using the R environment v2.13.0 (R Development Core Team, 2012) and SPSS 18.0 software (SPSS, Chicago, IL). Venn diagrams for comparing between the data sets were constructed using Venny, the online interactive tool (http://bioinfogp.cnb.csic.es/tools/venny/index.html) (58).
Results
Explorative phase
Demographic analysis
Eight healthy control group women were recruited from a cohort of 12 volunteers. Anovulatory hormone profiles excluded three participants, and a positive pregnancy test excluded one further volunteer. Eight women with surgically defined endometriosis were identified from a group of 15 patients with chronic pelvic pain. Five women were excluded because endometriosis was not confirmed at surgery, and two had an anovulatory hormonal profile. None of the included women had pelvic pathology other than endometriosis identified at surgery. The demographic characteristics of the two groups are presented in Table 2. There were no significant differences in endocrine profiles between women with and without endometriosis as shown in Table 3.
Clinical Characteristics of the Study Population in Explorative and Biomarker Discovery Phases of the Study
| Characteristic | Endometriosis (n = 8 Women; 23 Samples) | Healthy controls,(n = 8 Women; 24 Samples) | P Value |
|---|---|---|---|
| Explorative and biomarker discovery phasea | |||
| Age, y (mean ± SD) | 33.4 ± 5.6 | 39.5 ± 4.8 | 0.035 |
| BMI, kg/m2 (mean ± SD) | 26.5 ± 3.3 | 28.3 ± 5.1 | 0.414 |
| Surgical inspection of pelvis, n (%) | 8 (100%) | 3 (37.5%) | |
| Indications for surgery, n (%) | |||
| Pain | 4 (50%) | — | |
| Pain plus infertility | 4 (50%) | — | |
| Sterilization | — | 3 (100%) | |
| Severity of endometriosis (rASRM), n (%) | |||
| Minimal–mild (stage I to II) | 5 (62.5%) | NA | |
| Moderate–severe (stage III to IV) | 3 (37.5%) | NA |
| Characteristic | Endometriosis (n = 10 Women; 10 Samples) | Symptomatic Controls (n = 10 Women; 10 Samples) | P Value |
|---|---|---|---|
| Biomarker discovery phaseb | |||
| Age, y (mean ± SD) | 32.7 ± 4.7 | 28.1 ± 6.7 | 0.073 |
| BMI, kg/m2 (mean ± SD) | 23.1 ± 2.3 | 26.8 ± 5.02 | 0.05 |
| Stage of menstrual cycle, n (%) | 0.851 | ||
| Early proliferative | 0 (0%) | 2 (20%) | |
| Late proliferative | 1 (10%) | 1 (10%) | |
| Secretory | 8 (80%) | 6 (60%) | |
| Undetermined | 1 (10%) | 1 (10%) | |
| Indications for surgery, n (%) | >0.999 | ||
| Pain | 7 (70%) | 7 (70%) | |
| Pain plus infertility | 3 (30%) | 3 (30%) | |
| Severity of endometriosis (rASRM), n (%) | |||
| Minimal–mild (stage I to II) | 0 (0%) | NA | |
| Moderate–severe (stage III to IV) | 10 (100%) | NA |
Abbreviation: NA, not applicable.
Women with endometriosis vs healthy asymptomatic controls.
Women with endometriosis vs symptomatic controls; surgically defined cohort.
Endocrine Profile of the Participants Included in the Explorative Phase of the Study
| Sample ID | Cycle Length (d) | Early Proliferative Phase of the Menstrual Cycle | Late Proliferative Phase of the Menstrual Cycle | Mid-Luteal Phase of the Menstrual Cycle | |||||||||
|---|---|---|---|---|---|---|---|---|---|---|---|---|---|
| Day of Sample Collection | E2 (pmol/L) | P4 (nmol/L) | LH (IU/L) | Day of Sample Collection | E2 (pmol/L) | P4 (nmol/L) | LH (IU/L) | Day of Sample Collection | E2 (pmol/L) | P4 (nmol/L) | LH (IU/L) | ||
| Healthy asymptomatic control women | |||||||||||||
| H-5 | 28 | 3 | 113 | <2 | 4.4 | 10 | 618 | <2 | 4.4 | 22 | 387 | 23 | 1 |
| H-11 | 26 | 5 | 163 | <2 | 2.8 | 9 | 459 | <2 | 2.3 | 20 | 243 | 65 | 4.4 |
| H-10 | 30 | 5 | 131 | <2 | 2.3 | 13 | 360 | <2 | 3.1 | 22 | 640 | 20 | 1.8 |
| H-6 | 28 | 4 | 189 | <2 | 2.2 | 12 | 1050 | <2 | 11 | 19 | 330 | 35 | 1 |
| H-9 | 24 | 3 | 188 | <2 | 1.4 | 10 | 926 | <2 | 7.4 | 18 | 781 | 46 | 1.8 |
| H-100 | 32 | 5 | 123 | <2 | 7.2 | 12 | 601 | <2 | 2.7 | 24 | 287 | 46 | 3.7 |
| H-101 | 28 | 3 | 111 | <2 | 3.4 | 12 | 464 | <2 | 30 | 20 | 228 | 38 | 8.2 |
| H-102 | 26 | 3 | 125 | <2 | 6.5 | 9 | 567 | <2 | 27 | 20 | 180 | 46 | 11 |
| Median | 28 | 3.5 | 128 | 2 | 3.1 | 11 | 584 | 2 | 5.9 | 20 | 308.5 | 42 | 2.75 |
| Women with endometriosis | |||||||||||||
| E-21 | 28 | 4 | 126 | <2 | 3.9 | 10 | 469 | <2 | 4 | 20 | 332 | 30 | 4.5 |
| E-22 | 28 | 5 | 263 | <2 | 4.4 | 11 | 702 | 2.4 | 62.3 | 19 | 329 | 35 | 6.2 |
| E-25 | 28 | 3 | 71 | <2 | 2.9 | 9 | 475 | <2 | 4.3 | 22 | 279 | 38 | 5.1 |
| E-26 | 30 | 3 | 117 | <2 | 4.6 | 9 | 356 | <2 | 2.2 | 22 | 373 | 40 | 2.8 |
| E-29 | 27 | 3 | 81 | <2 | 4.3 | 10 | 382 | <2 | 4.7 | 19 | 373 | 36 | 4.8 |
| E-30 | 27 | 5 | 109 | <2 | 5.4 | 13 | 591 | 3.1 | 19 | 23 | 299 | 19 | 2.7 |
| E-32 | 23 | 5 | 159 | <2 | 5.5 | 10 | 631 | 2 | 5.2 | 24 | 497 | 25 | 2.7 |
| EN-101 | 29 | 4 | 120 | 2 | 4.6 | 11 | 268 | <2 | 6 | 18 | 241 | 12 | 7.7 |
| Median | 28 | 4 | 118.5 | 2 | 4.5 | 10 | 475 | 2 | 4.7 | 21 | 330.5 | 32.5 | 4.65 |
Generation of genome-scale plasma miRNA data from women with and without endometriosis
TLDAs were used to analyze 667 plasma miRNAs in the 16 women across three time points of the menstrual cycle. A low late proliferative phase E2 level excluded 1 sample, and thus 47 plasma samples in total were available. Out of 667 miRNAs, 502 were detected in at least one sample, whereas 370 were detectable in >50% of the samples and were used in subsequent analyses.
Plasma miRNA expression across the menstrual cycle
Most plasma miRNAs exhibited no statistically significant difference in abundance between the three cycle phases either in women with endometriosis or in healthy controls. Out of 370 readily detectable miRNAs only 13 miRNAs (6 in the control and 7 in endometriosis group) fluctuated between some but not all menstrual cycle phases at P < 0.05 (Table 4). Sixteen plasma miRNAs from women with endometriosis (let-7b, miR-140-5p, miR-146b-5p, miR-150, miR-182, miR-186, miR-19a, miR-19b, miR-222, miR-223, miR-329, miR-345, miR-484, miR-655, miR-758, and miR-889) and six from control women (miR-141, miR-181c, miR-328, miR-422a, miR-589, and miR-886-3p) exhibited the most stable expression across the cycle and were consistently expressed at all three time point comparisons (tost method threshold of ε = 1 and α = 0.05). Neither miR-28-5p nor miR-30b fluctuated across the menstrual cycle.
The Top Ranked miRNAs Exhibiting Differential Expression Across the Menstrual Cycle, in Women With and Without Endometriosis
| ID | Average Meana | T1 to T2 | T1 to T3 | T2 to T3 | F Statistic | F (P Value)d | |||
|---|---|---|---|---|---|---|---|---|---|
| tb | (P Value)c | tb | (P Value)c | tb | (P Value)c | ||||
| Endometriosis | |||||||||
| miR-141 | 29.48 | −2.54 | (0.015) | −0.91 | (0.367) | 1.66 | (0.104) | 3.29 | (0.046) |
| miR-205 | 30.66 | 0.53 | (0.598) | 2.49 | (0.017) | 1.88 | (0.067) | 3.40 | (0.042) |
| miR-130b | 24.74 | −0.67 | (0.505) | −2.22 | (0.031) | −1.48 | (0.147) | 2.58 | (0.087) |
| miR-331-3p | 20.39 | −1.12 | (0.269) | −2.08 | (0.043) | −0.89 | (0.377) | 2.17 | (0.126) |
| miR-382 | 23.54 | −0.46 | (0.646) | −2.06 | (0.045) | −1.53 | (0.133) | 2.31 | (0.111) |
| miR-511 | 29.67 | 1.09 | (0.283) | −0.97 | (0.336) | −2.03 | (0.049) | 2.05 | (0.141) |
| miR-939 | 31.69 | −2.40 | (0.022) | −1.55 | (0.129) | 0.81 | (0.425) | 3.00 | (0.062) |
| Asymptomatic controls | |||||||||
| miR-212 | 28.00 | −1.15 | (0.255) | 1.48 | (0.145) | 2.64 | (0.012) | 3.50 | (0.039) |
| miR-138 | 29.06 | 2.34 | (0.024) | 0.20 | (0.843) | −2.14 | (0.038) | 3.35 | (0.044) |
| miR-150 | 18.06 | 0.52 | (0.604) | 2.32 | (0.025) | 1.80 | (0.079) | 2.97 | (0.062) |
| let-7g | 21.23 | 1.56 | (0.126) | −0.76 | (0.452) | −2.32 | (0.025) | 2.79 | (0.072) |
| miR-642 | 29.68 | 1.69 | (0.098) | 2.23 | (0.031) | 0.54 | (0.590) | 2.72 | (0.077) |
| miR-135a | 29.79 | 1.61 | (0.114) | 2.08 | (0.043) | 0.47 | (0.641) | 2.38 | (0.104) |
Results are from the analyses by using linear models with application of moderated t statistics and nested F test approach (LIMMA package). Separate analyses are shown for women with endometriosis and healthy controls across the three time points of the menstrual cycle.
Abbreviations: T1, early proliferative stage of the cycle; T2, late proliferative stage of the cycle; T3, mid-luteal stage of the cycle.
Average normalized Cq values for each probe over all the arrays.
Empirical Bayesian t statistic.
P value corresponding to t statistic.
P value corresponding to F statistic; statistical significance is determined by P < 0.01.
Biomarker discovery phase
Comparison of women with surgically defined endometriosis and asymptomatic controls
Using the explorative phase data set, 62 miRNAs displayed altered expression when the endometriosis and control groups (P < 0.05) were compared. Of these, 29 miRNAs exhibited differential expression in the early proliferative phase, 27 in the late proliferative phase, and 29 in the mid-luteal phase of the cycle. The expression of the dysregulated miRNAs was stable across the menstrual cycle with the exception of two miRNAs in the endometriosis group (miR-130b, miR-331-3p) and two miRNAs in the asymptomatic control groups (miR-642), which fluctuated across the menstrual cycle phases. Six miRNAs (miR-23a, miR-155, miR-574-3p, miR-662, miR-93*, and miR-29a*) were differentially regulated between the two groups at all three stages of the menstrual cycle, but only one (miR-662) passed the correction for multiple testing [Fig. 3a; see the online repository (59)].
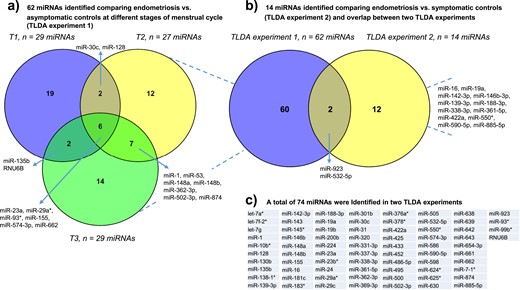
Explorative analysis of plasma miRNA profiles in women with endometriosis and different control populations: results of two TLDA experiments. (a) In TLDA experiment 1, a total of 62 miRNAs were found to be dysregulated by comparing miRNA profiles of women with endometriosis vs asymptomatic healthy controls at each phase of the menstrual cycle (T1, early proliferative phase; T2, late proliferative phase; T3, mid-luteal phase). (b) In TLDA experiment 2, 14 dysregulated miRNAs were identified by comparing miRNA profiles of women with endometriosis vs symptomatic women who were surgically defined as disease-free and analyzed irrespective of menstrual cycle phase. Overlap between the two TLDA experiments is also shown. (c) The identity of the full list of miRNAs found to be dysregulated in the two TLDA experiments is presented.
Singleplex RT-qPCR of four miRNAs (miR-128, miR-155, miR-662, and miR-93*) demonstrated concordant differential expression in at least one phase of the cycle and when all the cycle stages were pooled together for each individual (59).
Comparison of women with and without surgically defined endometriosis
The demographic characteristics of the participants are presented in Table 2. Blood collection was not limited to a specific cycle phase, as the explorative phase results did not demonstrate menstrual cycle phase variability for most miRNAs. The few miRNAs that displayed any measurable cycle phase changes were excluded from the analysis.
Although none passed the correction for multiple testing, 14 miRNAs were identified as being differentially expressed when women with and without endometriosis were compared (P < 0.05) (Fig. 3b). Little concordance was seen in the miRNAs identified when the comparison between women with endometriosis and asymptomatic controls was compared with the comparison of women with and without surgically defined endometriosis, with only two miRNAs appearing in both data sets (miR-532-5p and miR-923) (Fig. 3b). In total, 74 miRNAs were identified as dysregulated in the two experiments (Fig. 3c).
Concordance between the published studies on miRNAs in endometriosis and our explorative data set
PubMed and EMBASE searches identified 47 peer-reviewed, English language, original miRNA studies in endometriosis between January 2000 and March 2018. Of these, 37 studies explored miRNA expression in eutopic and/or ectopic endometrial tissue in either wide-scale microarray experiments (n = 16 studies) or by RT-PCR measurement of individual miRNA expression or functional in vitro analyses (n = 31 studies) (46, 48, 49, 52, 60–76). An additional 10 studies focused on circulating miRNAs in endometriosis through array profiling (16, 17, 45, 77) or individual RT-PCR evaluations (15, 40, 78–80). Of the miRNAs identified using global analysis methods, only 62 miRNAs in endometrial tissues and 40 miRNAs in the circulation were validated using singleplex RT-PCR analyses, showing little concordance between the studies. Only five endometriosis-associated miRNAs overlapped between the blood experiments (miR-145-5p, miR-15b-5p, miR-199a, miR-20a-5p, and miR-451a), and none was reported in more than two studies. Fourteen miRNAs were identified at least in one study in both tissue and blood experiments, and only two endometriosis-associated miRNAs overlapped between our array data set and those previously reported in both tissue and circulation (Fig. 4). Likewise, only 19 miRNAs overlapped between the endometrial tissue experiments reported by different groups, of which only 8 were found dysregulated in more than two studies (miR-16-5p, miR-20a-5p, miR-21-5p, miR-29c, miR-126, miR200b, miR-200c, and miR-424-5p) and some showed discordance in the direction of dysregulation. Overall, 10 miRNAs reported in previous (either blood or tissue) experiments were present in our array data sets (miR-10b*, mir-16-5p, miR-23a, miR-29c, miR-31, miR-135b, miR-142-3p, miR-143-3p, miR-145*, and miR-200b), and most of them (n = 8 miRNAs) were further evaluated.
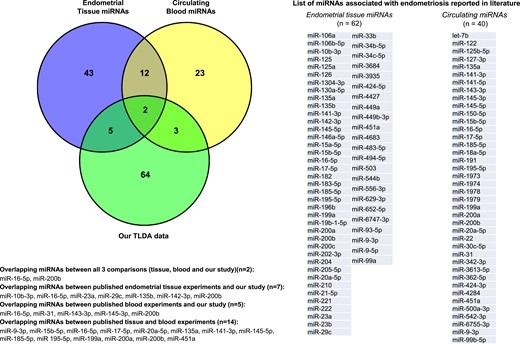
Concordance between the published studies on miRNAs in endometriosis and our array data set. Venn diagram represents comparison between the miRNA studies in endometrial tissue and circulation, and with our explorative data set, demonstrating the number of overlapping miRNAs.
Biomarker selection phase—the selection cohort
Demographic analysis
The selection cohort included 78 women, of whom 51 were diagnosed with endometriosis and 27 had surgically confirmed normal pelvis. In the endometriosis group, 36 had minimal–mild (rASRM stage I to II) and 15 moderate–severe endometriosis (rASRM stage III to IV) endometriosis. The diagnosis was confirmed histologically in 45 patients. There were no significant differences in age, body mass index (BMI), use of hormonal treatment, past history or family history of endometriosis, and stage of menstrual cycle were found between the two groups (Table 5). Smoking and a history of miscarriage were significantly more common in disease-free women (P < 0.05), whereas nulliparity was more prevalent in women with endometriosis (P < 0.05). All participants suffered from chronic abdominal pain and no differences were seen in the duration of the pain symptoms or the rate of infertility between the groups.
Clinical Characteristics of the Study Population Included in Two Validation Experiments in Surgically Defined Cohorts
| Characteristic | Endometriosis (n = 51) | Controls (n = 27) | P Value |
|---|---|---|---|
| Biomarker selection phasea | |||
| Age, y (mean ± SD) | 29.39 ± 8.6 | 31.23 ± 9.0 | 0.057 |
| BMI, kg/m2 (mean ± SD) | 25.65 ± 4.94 | 25.68 ± 7.10 | 0.648 |
| Smoking, n (%) | 5 (9.8%) | 7 (25.9%) | 0.047 |
| Previous miscarriage, n (%) | 10 (19.6%) | 10 (37%) | 0.045 |
| Parity, median (range) | 0 (0–3) | 1.0 (0–2) | 0.018 |
| Nulliparity, n (%) | 35 (68.6%) | 11 (51.9%) | 0.042 |
| Hormonal treatment, n (%) | 19 (37.3%) | 3 (11.1%) | 0.053 |
| Past diagnosis of endometriosis, n (%) | 14 (27.5%) | 5 (18.5%) | 0.775 |
| Family history of endometriosis, n (%) | 13 (25.5%) | 6 (22.2%) | >0.999 |
| Stage of menstrual cycle, n (%) | 0.317 | ||
| Early proliferative | 2 (3.9%) | 3 (11.1%) | |
| Late proliferative | 24 (47.1%) | 6 (22.2%) | |
| Secretory | 14 (27.4%) | 13 (48.1%) | |
| Undetermined | 11 (21.7%) | 5 (18.5%) | |
| Pain, n (%) | 51 (100%) | 27 (100%) | >0.999 |
| Duration of pain, y [median (range)] | 6 (1–23) | 10 (3– 28) | 0.264 |
| Infertility, n (%) | 11 (21.6%) | 9 (33.3%) | 0.495 |
| Severity of endometriosis (rASRM), n (%) | |||
| Minimal–mild (stage I to II) | 36 | NA | |
| Moderate–severe (stage III to IV) | 15 | NA | |
| CA-125, IU/mL (mean ± SD) | 23.40 ± 37.65 | 14.40 ± 7.05 | 0.295 |
| Characteristic | Endometriosis (n = 80) | Controls (n = 39) | P Value |
|---|---|---|---|
| Biomarker validation phasea | |||
| Age, y (mean ± SD) | 29.22 ± 7.43 | 31.36 ± 5.99 | 0.320 |
| BMI, kg/m2 (mean ± SD) | 25.23 ± 5.06 | 26.15 ± 7.53 | 0.575 |
| Smoking, n (%) | 26 (33.3%) | 10 (26.3%) | 0.660 |
| Previous miscarriage, n (%) | 7 (9%) | 6 (15.8%) | 0.339 |
| Parity, median (range) | 0 (0–4) | 0 (0–3) | 0.020 |
| Nulliparity, n (%) | 54 (69%) | 18 (47.4%) | 0.039 |
| Hormonal treatment, n (%) | 8 (10.3%) | 3 (7.9%) | >0.999 |
| Past diagnosis of endometriosis, n (%) | 31 (39.7%) | 8 (21%) | 0.085 |
| Family history of endometriosis, n (%) | 20 (25.7%) | 6 (15.8%) | 0.342 |
| Stage of menstrual cycle, n (%) | 0.276 | ||
| Early proliferative | 8 (10%) | 4 (11%) | |
| Late proliferative | 14 (18%) | 7 (18.4%) | |
| Secretory | 26 (33.3%) | 6 (15.8%) | |
| Undetermined | 30 (38.5%) | 21 (55.3%) | |
| Pain, n (%) | 78 (100%) | 38 (100%) | >0.999 |
| Severity of pain (VAS 1/100), median (range) | 65 (3–100) | 68.0 (20–100) | 0.684 |
| Severity of endometriosis (rASRM), n (%) | |||
| Minimal–mild (I to II) | 56 | NA | |
| Moderate–severe (III to IV) | 24 | NA |
Abbreviations: NA, not applicable; VAS, visual analog scale.
Women with endometriosis vs symptomatic controls.
CA-125 was measured in 65 batched plasma samples (45 women with endometriosis and 20 controls). There were no significant differences in CA-125 levels between the control and endometriosis groups (14.40 ± 7.05 vs 23.40 ± 37.65, P = 0.295).
miRNA selection for testing in large cohorts
Of the 74 miRNAs identified in the discovery phase, 38 were selected for further testing based on the visual inspection of the amplification plots of the raw data and when several comparisons demonstrated their dysregulation. We also incorporated miRNAs identified as putative circulating biomarkers of endometriosis by other studies published at the time of biomarker selection. These miRNAs included miR-9*, miR-122, miR-141*, miR-145*, miR-199a, and miR-542-3p reported by Wang et al. (18); miR-17-5p, miR-20a, and miR-22 found by Jia et al. (16); and miR-200a, miR-200b, and miR-141-3p reported by Rekker et al. (40). Of these, only two miRNAs (miR-145*and miR-200b) were identified in our explorative experiments. Overall, 48 miRNAs were selected for further testing.
miRNAs dysregulated in endometriosis
The amplification efficiency of the singleplex assays ranged from 58% to 125% [86% to 100% efficiency for 54% assays (n = 26/48)], and an adjustment for this was unnecessary, as there was a strong, positive correlation between corrected and uncorrected raw Cq values for each detector (Spearman rank order correlation, P < 0.01, rs = 0.9 to 1.0). miR-30b demonstrated the highest stability and abundance in these data. After normalization of raw Cq values to miR-30b, the expression levels of most miRNAs were not normally distributed.
Out of 48 miRNAs evaluated in this phase of the experiment, 9 were found dysregulated in endometriosis. Of them, seven miRNAs were identified in our biodiscovery data set (miR-29c, miR-135b, miR-139-3p, miR-145*, miR-155, miR-574-3p, and miR-923) and two miRNAs were sourced from published studies (miR-9* and miR-141*). Seven plasma miRNAs were significantly downregulated (miR-9*, miR-135b, miR-139-3p, miR-141*, miR-155, miR-574-3p, and miR-923) [Fig. 5(a)–5(g), respectively] and one was significantly upregulated (miR-145*) [Fig. 5(h)] in women with endometriosis compared with disease-free controls. One additional miRNA, miR-29c, was only found to be dysregulated in women with moderate–severe endometriosis as described below. Four miRNAs (miR-574-3p, miR-139-3p, miR-923, and miR-145*) demonstrated a concordant and two (miR-135b and miR-155) a discordant direction of change to the array data set. miR-23b* and miR-188-3p did not amplify in most samples and were excluded. All other miRNAs did not demonstrate differential expression between the endometriosis and disease-free groups.
![Expression levels of dysregulated miRNAs identified in the selection cohort (n = 78 women). (a–i) Left panels: expression profiles of significantly altered miRNAs identified in plasma from women with endometriosis (Endo) and without endometriosis [Con]. Right panels: expression levels of dysregulated miRNAs stratified by severity of the disease. Number of subjects per group: women with endometriosis, n = 51 [comprised of n = 36 with minimal–mild endometriosis (rASRM stage I to II) and n = 15 with moderate–severe endometriosis (rASRM stage III to IV)]; control women, n = 27. Data are presented as relative expression values normalized to miR-30b [median (middle line), interquartile range (top and bottom lines)]. *P < 0.05, **P < 0.01, ***P < 0.001, by Mann–Whitney U test.](https://oup.silverchair-cdn.com/oup/backfile/Content_public/Journal/jcem/104/6/10.1210_jc.2018-01464/2/m_jc.2018-01464f5.jpeg?Expires=1748051197&Signature=hXtZ34zIzyDig7cRYPeBA0nEKtqxr6w52MLbTzREIT7nMADL8rmWcJmCpZiN6b8L7LjwDFnTTSLZIiJ1CwSL0U63YxZtSlyXwWLonPELKJ660CLjaFjE2TZrkJWf7yZb1-HDpQ6ATiwsYpMw7I98nV0GgX4rgg1t~bLqAih6GGL24dLFVI0YQAP74kX5nwmTPATm9wXXCJastYMcIugPvo2Xy4czn9yYgU8bOfxDtEf7Ia3wlgbbXM6DXJmM5dPFpWX-tMIOEdHQPz31FmkK2xECQUQK20CBhPijfD5ZX7KbdbAbj6XCNhFiR5e3FbFxCZ0uqi9~19BCA9OReWBO2w__&Key-Pair-Id=APKAIE5G5CRDK6RD3PGA)
Expression levels of dysregulated miRNAs identified in the selection cohort (n = 78 women). (a–i) Left panels: expression profiles of significantly altered miRNAs identified in plasma from women with endometriosis (Endo) and without endometriosis [Con]. Right panels: expression levels of dysregulated miRNAs stratified by severity of the disease. Number of subjects per group: women with endometriosis, n = 51 [comprised of n = 36 with minimal–mild endometriosis (rASRM stage I to II) and n = 15 with moderate–severe endometriosis (rASRM stage III to IV)]; control women, n = 27. Data are presented as relative expression values normalized to miR-30b [median (middle line), interquartile range (top and bottom lines)]. *P < 0.05, **P < 0.01, ***P < 0.001, by Mann–Whitney U test.
Subgroup analysis stratified by severity of endometriosis revealed that six of eight miRNAs (miR-135b, miR-139-3p, miR-141*, miR-145*, miR-155, and miR-923) demonstrated altered expression in both minimal–mild and moderate–severe endometriosis when compared with controls, whereas dysregulation of miR-9* and miR-574-3p was restricted to women with minimal–mild disease. miR-29c showed significant dysregulation only when women with moderate–severe endometriosis were compared with disease-free women, but this significance disappeared when all women with endometriosis were included in the comparison [Fig. 5(i)]. There were no significantly dysregulated miRNAs identified when women with different severities of endometriosis were directly compared.
We did not confirm dysregulation of the miRNAs reported by two other teams of investigators (16, 40) and only partially confirmed the findings of the third group (18). Differential expression of three out of six endometriosis-associated miRNAs reported by Wang et al. (18) was confirmed in our study (miR-141*, miR-145*, and miR-9*) and demonstrated a similar pattern of dysregulation. The other three miRNAs (miR-122, miR-199a, and miR-542-3p) were not significantly dysregulated even when the data were normalized to U6, which was used as a normalizer in the original study.
Diagnostic potential of differentially regulated miRNAs
Three miRNAs (miR-141*, miR-145*, and miR-923) had the highest area under the receiver operating characteristic (ROC) curve (AUC) of 0.923 (95% CI, 0.862 to 0.9830), 0.856 (95% CI, 0.770 to 0.942), and 0.766 (95% CI, 0.647 to 0.885), respectively (Fig. 6a). The sensitivity and specificity for miR-141* were 100% and 80%, for miR-145* were 86% and 55%, and for miR-923 were 85% and 55%, respectively. Other dysregulated miRNAs had only a modest discriminatory capacity for endometriosis with the AUC ranging from 0.672 to 0.923. Combined signatures of miR-145* and miR-923 revealed an AUC of 0.959 (95% CI, 0.917 to 1.00) with a sensitivity of 92% and a specificity of 95% (Fig. 6b). The addition of miR-141* to the diagnostic combination did not improve predictive performance and resulted in an AUC of 0.958 (95% CI, 0.915 to 1.00) with comparable diagnostic parameters (a sensitivity of 92% and a specificity of 95%).
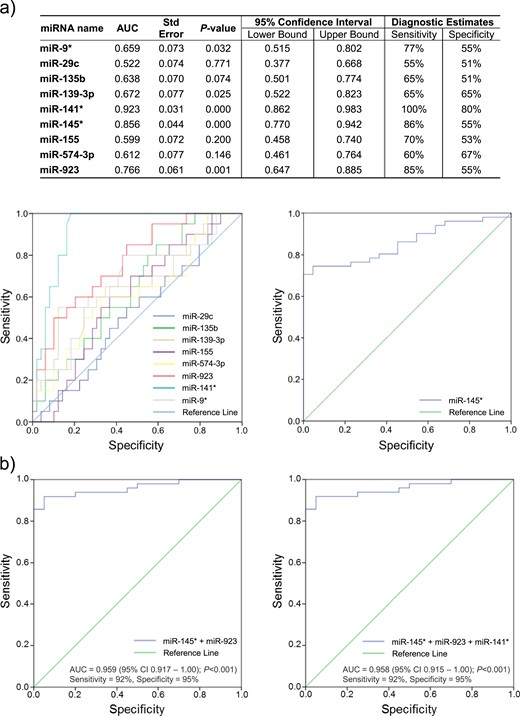
Diagnostic estimates of miRNAs identified as dysregulated in the selection cohort. (a) ROC curve analysis was performed for each of the miRNAs identified as being dysregulated in the selection cohort and the associated AUC and diagnostic sensitivities and specificities for individual miRNAs are presented. For miR-29c, miR-135b, miR-139-3p, miR-141*, miR-155, miR-574-3p, miR-923, and miR-9*, the larger the test result variables, the stronger the evidence for endometriosis-free status, whereas for miR-145*, whose ROC curve is presented separately, the larger the test variables, the stronger the evidence for endometriosis. (b) ROC curves and associated AUCs as well as diagnostic sensitivities and specificities for the combined best performing miRNAs in the selection cohort (i) miR-145* + miR-923 and (ii) miR-145* + miR-923 + miR-141*.
Correlation of differentially expressed miRNAs with clinical predictors of endometriosis and CA-125 levels
We identified clinical parameters with predictive potential for endometriosis that could improve the diagnostic accuracy of plasma miRNAs. In the selection cohort, both parity and miscarriage correlated with endometriosis in a binary logistic regression, but the Spearman rank order coefficient indicated only a weak negative relationship: parity (rs = −0.274, P = 0.02), miscarriage (rs = −0.257, P = 0.03). No significant correlation was found between endometriosis and any other demographic or clinical characteristic. No correlation was seen between levels of CA-125 and expression of any of the dysregulated miRNAs (Spearman rank correlation coefficients <0.2 for each miRNA).
Biomarker validation phase—the validation cohort
Demographic analysis
The validation cohort comprised 119 women, of whom 80 had surgical confirmation of endometriosis [56 with minimal–mild disease (rASRM stage I to II) and 24 with moderate–severe disease (rASRM stage III to IV)] and 39 women were disease-free. A histological diagnosis was available for 91 women. There were no significant differences in age, BMI, smoking, history of miscarriage, use of hormonal treatment, past or family history of endometriosis, and presence or severity of pain between women with and without endometriosis. The only significant demographic difference was a higher number of nulliparous women in the endometriosis group. Demographic characteristics of both groups are summarized in Table 5.
Validated expression of plasma miRNA in the validation cohort
Nine miRNAs that demonstrated differential expression in the selection cohort were validated in the independent cohort from a different geographical area (Fig. 7).
![Expression levels of nine dysregulated miRNAs evaluated in the validation cohort. (a–i) Left panels: expression profiles of nine miRNAs identified as dysregulated in plasma from women with endometriosis (Endo) and without endometriosis (Con) in previous experiments. Right panels: expression levels of dysregulated miRNAs stratified by severity of the disease. Number of subjects per group: women with endometriosis, n = 80 [comprised of n = 56 with minimal–mild endometriosis (rASRM stage I to II) and n = 24 with moderate–severe endometriosis (rASRM stage III to IV)]; control women, n = 39. Data are presented as relative expression values normalized to miR-30b [median (middle line), interquartile range (top and bottom lines)]. *P < 0.05, **P < 0.01, by Mann–Whitney U test.](https://oup.silverchair-cdn.com/oup/backfile/Content_public/Journal/jcem/104/6/10.1210_jc.2018-01464/2/m_jc.2018-01464f7.jpeg?Expires=1748051197&Signature=g3YQwPAhUV6N~2bhElCsTLijvR2zNwYNDOaG59XmGuwUGrSCj4kuU9~F5MSauVGOD5TQGMv2eOjC~qxm~pNzMle-rXEWdbJm9pv9a8RU6xO1ROAly8-naGV1X~kyN7urhxj5Nhtml8undTmBRpj9KzjCvCLHNEdvvmmPcy39l3VcL4s7bQR3grL9yahqYu0OMvuqdyqFQbV7xc2lMhwHc3JWsPOZN6~nr4TdA76M2JZGFjEpLrFrY62GOHlghd5EZZgC16mwQcLMjw3RohpXzlMQOIbrUKfQB93JmmmQWUoddyjU~yToizqyao~bXHw-JGt1E8znm-FYCK1JrV-1WQ__&Key-Pair-Id=APKAIE5G5CRDK6RD3PGA)
Expression levels of nine dysregulated miRNAs evaluated in the validation cohort. (a–i) Left panels: expression profiles of nine miRNAs identified as dysregulated in plasma from women with endometriosis (Endo) and without endometriosis (Con) in previous experiments. Right panels: expression levels of dysregulated miRNAs stratified by severity of the disease. Number of subjects per group: women with endometriosis, n = 80 [comprised of n = 56 with minimal–mild endometriosis (rASRM stage I to II) and n = 24 with moderate–severe endometriosis (rASRM stage III to IV)]; control women, n = 39. Data are presented as relative expression values normalized to miR-30b [median (middle line), interquartile range (top and bottom lines)]. *P < 0.05, **P < 0.01, by Mann–Whitney U test.
The significant downregulation of three plasma miRNAs (miR-139-3p, miR-155, and miR-574-3p) was corroborated in the validation cohort. In a subgroup analysis miR-155 remained differentially expressed in both mild and more severe forms of the disease, and miR-574-3p was proven to be significantly different only in minimal–mild endometriosis when compared with the control group, confirming the findings of the selection cohort. In contrast, the expression levels of miR-139-3p in the validation cohort were now significantly different only in minimal–mild disease but not in moderate–severe disease. Furthermore, miR-9*, miR-29c, miR-135b, miR-141*, miR-145*, and miR-923 did not exhibit differential expression in the validation cohort between the two groups or in any subgroup comparisons (Fig. 7).
Interestingly, miR-145* and miR-923, which appeared to be the most powerful discriminators in the selection cohort, did not significantly differ between the groups and appeared to have an opposite direction of expression in the validation cohort.
Assessment of the diagnostic potential of differentially expressed plasma miRNAs
The AUCs for differentially expressed and validated miRNAs are summarized in Fig. 8a and 8b. The AUCs for validated miRNAs were: 0.674 (95% CI, 0.562 to 0.786; P = 0.05) for miR-155, 0.626 (95% CI, 0.513 to 0.738; P = 0.045) for miR-574-3p, and 0.619 (95% CI. 0.498 to 0.739; P = 0.058) for miR-139-3p (Fig. 8b). The respective sensitivities and specificities were 67% and 60% for miR-155, 73% and 53% for miR-574-3p, and 70% and 57% for miR-139-3p (Fig. 8b). The combination of three miRNAs resulted in an AUC of 0.705 (95% CI. 0.601 to 0.808; P = 0.001) with a sensitivity of 83% and a specificity of 51% (Fig. 8c).
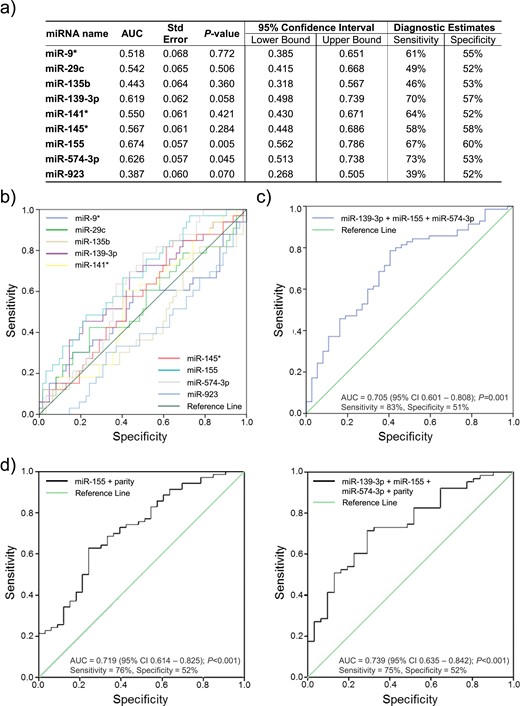
Diagnostic estimates of miRNAs evaluated in the validation cohort. ROC curve analysis was performed for each of the evaluated miRNAs. (a and b) The associated AUC and diagnostic sensitivities and specificities for individual miRNAs are presented in (a) and plots are shown in (b). (c) ROC analysis of the combined miRNAs confirmed as dysregulated in the validation cohort (miR-139-3p, miR-155, and miR-574-3p). (d) ROC analysis of the regression model using the best performing combination of miRNA(s) and clinical data to discriminate endometriosis.
Predictive models for endometriosis
Nulliparity was the only clinical parameter that correlated weakly with endometriosis (rs = −0.229, P = 0.019) in the validation cohort. A predictive model was formulated using logistic regression that included parity and miR-155 expression levels. This combination demonstrated an AUC of 0.719 (95% CI, 0.614 to 0.825; P < 0.001) with a sensitivity of 76% and a specificity of 52%, which was lower than that of three dysregulated miRNAs without incorporation of clinical data (Fig. 8d). The addition of miR-574-3p and miR-139-3p did not improve the diagnostic performance of the model [AUC, 0.739 (95% CI, 0.635 to 0.842; P < 0.001); sensitivity, 75%; specificity, 52%] (Fig. 8d).
Discussion
This study aimed to evaluate the diagnostic performance of circulating miRNAs for detecting pelvic endometriosis. To our knowledge, this is the first study that used two independent well-characterized cohorts of women with suspected endometriosis to confirm the results of the explorative microarray experiments. The findings are reported in accordance with STARD guidelines for diagnostic test accuracy studies (28).
Endometriosis-associated miRNAs were identified across all phases of the menstrual cycle, and most did not demonstrate a menstrual cycle phase–dependent miRNA profile. Our findings concur with Rekker et al. (21), who did not identify menstrual cycle effects on plasma miRNA levels in healthy women, and with two studies (45, 77), which demonstrated no variation across the menstrual cycle in endometriosis-associated miRNA levels when independent patients made up the cycle phase groups. This finding was critical to determining the diagnostic test accuracy of plasma miRNA for endometriosis in our selection and validation cohorts, which included women taking hormonal contraceptives and having blood drawn at surgery in all cycle phases. We also identified particularly stable circulating miRNA signatures with the capacity to serve as menstrual cycle–independent detectors in reproductive aged women. This finding is of particular importance in biomarker research, where the phase of the menstrual cycle in which blood is drawn or the use of hormone-containing medications might impact the performance of an miRNA-based diagnostic test.
Our results demonstrate that three plasma miRNAs (miR-139-3p, miR-155, and miR-574-3p) were consistently dysregulated in endometriosis. The diagnostic estimates for each of these miRNAs differed between the two cohorts, and none of the miRNAs displayed a sensitivity >75% or specificity >70% in either cohort. When the signatures of the three miRNAs were combined, a higher diagnostic performance ensued (sensitivity of 83% and specificity of 51% in the validation data set); however, none of these estimates equated to an adequate diagnostic test.
The diagnostic test accuracy Cochrane library review suggested that an adequate diagnostic test for endometriosis should have a sensitivity of 94% and a specificity of 79% to replace diagnostic surgery (a replacement test) (3). This cutoff was based on that reported by the only systematic review that determined the accuracy of laparoscopy in detecting endometriosis (6). A triage test would improve the selection of individuals with suspected endometriosis for an invasive diagnosis with laparoscopy. Two types of triage tests are recognized, including a test with high sensitivity that rules a condition out (SnOUT test) and a test with high specificity that rules a condition in (SpIN test). The proposed diagnostic thresholds for triage tests for endometriosis were a sensitivity of 95% and a specificity of 50% for a SnOUT test and a sensitivity of 50% and a specificity of 95% for a SpIN test (3). None of the validated miRNAs in this study or their combinations met the criteria for either a SnOUT or SpIN test.
Of the clinical parameters, only parity and a history of miscarriage correlated with the presence of endometriosis. When clinical characteristics were incorporated with miRNA signatures into a diagnostic algorithm, the diagnostic performance did not improve. Furthermore, CA-125 levels did not distinguish the groups and did not correlate with any of the dysregulated miRNAs in the selection cohort. The Cochrane library’s diagnostic test accuracy review of blood biomarkers in endometriosis highlighted the limited diagnostic value of CA-125 in endometriosis (3), but this was challenged in a recent small well-designed prospective diagnostic test accuracy study that reported a sensitivity of 57% and a specificity of 96% for CA-125 at a cutoff of ≥30 U/mL (81).
A subset of miRNAs exhibited a high sensitivity and specificity, suggesting value as replacement or triage tests in the selection cohort. Resampling into this same data set would have erroneously validated this result. The lack of confirmation of these findings in a validation cohort determined that the diagnostic potential of the miRNA profiles was limited to that set of individuals, and not reproducibly related to the endometriotic disease process. Notably, six out of the nine miRNAs that were significantly dysregulated in our selection cohort did not differ between the groups in the validation cohort. This emphasizes the importance of repeating initial plasma miRNA evaluations in an independent cohort to ensure the differences between groups truly define disease status.
To date, five studies have explored the diagnostic potential of circulating miRNAs in endometriosis using high-throughput methods to identify endometriosis-associated miRNAs, followed by individual RT-PCR analyses to test their diagnostic accuracy in cohorts of women with and without endometriosis. In most cohorts all stages of endometriosis were evaluated (16, 18, 45), others only included minimal–mild disease (77), and one compared endometrioma with malignant ovarian tumors (17). Five additional studies assessed predetermined miRNA signatures for their diagnostic performance (40, 45, 78–80). Although some models were purported to be highly accurate for the noninvasive detection of endometriosis, these findings are largely unreplicated. Each of these studies used different methodologies for miRNA assessment and included different sets of participants, and none has validated their findings in an independent cohort.
Surprisingly, little concordance was seen in the data sets. Our literature review showed that out of 45 circulating miRNAs, the dysregulation of which was confirmed in individual RT-PCR experiments, only five were identified as concordant across any of the other studies (miR-145-5p, miR-15b-5p, miR-199a, miR-20a-5p, and miR-451a) and none was reported by more than two groups. Of these, miR-15b-5p and miR-199a exhibited an opposite direction of dysregulation in different studies. Similarly, there was little concordance between data from our study and previously published data. Five dysregulated circulating miRNAs overlapped between our array findings and at least one data set reported by other groups (miR-16-5p, miR-31, miR-143-3p, miR-145-3p, and miR-200b). Of these, none was confirmed in our validation cohort by using singleplex RT-PCR. We were also not able to replicate the disparate findings of the other groups and could not confirm the diagnostic estimates for miRNA biomarkers presented in these studies (16, 18, 40).
Technical differences in sample handling, RNA extraction, normalization, array platforms, and methods of statistical analysis are likely to account for at least some of the differences between studies. To reduce noise and identify true biological differences, miRNAs that were not expressed in most of the samples or that consistently exhibited high Cq values were excluded in our study. When developing molecular diagnostics, it is essential to optimize and validate the normalization approach. In our array data set, quantile normalization was the most effective strategy, in accord with previous papers (42). Endogenous controls are the method of choice for the low-scale validation experiments (82), and the most abundant and stable miRNA in our data set (miR-30b) was selected and validated. There is no consensus regarding reliable endogenous miRNA controls (23); however, selection of normalizers that are specific to the experimental sample set are known to outperform predefined universal endogenous controls, such as mammalian U6 (34, 83). In our preliminary work, we have observed a difference in differential expression and dysregulation patterns when data were normalized by using different endogenous controls. In this study, we did not perform direct comparisons between different normalization methods on all the samples analyzed in the selection and validation experiments. However, we used a normalization to mammalian U6 to replicate the dysregulated miRNAs from Wang et al. (18) in line with this original study. Different results were observed when U6 rather than miR-30b was used as a normalizer in our data set and when U6 was used to normalize both experiments. Several studies also used data set–specific endogenous controls, which were different from those selected in our study (16, 17, 40).
Geographic and ethnic differences in miRNA expression could explain the lack of concordance between published studies; however, this would seem unlikely given racial overlap between Australians and North Americans. A consistent experimental approach with reproducible techniques would be required to investigate this possible source of difference. Studies evaluating noninvasive diagnostic methods for endometriosis, in particular those assessing circulating miRNAs, lack methodological consistency with regard to population selection and vary in reporting of patient phenotypical characteristics. Major determinants of high-quality diagnostic studies include prospective consecutive sampling of the clinically relevant population, sufficient description of the reference standard to assure its diagnostic performance, blinding of the test operators to the surgical findings, adjustment of the test results to clinical confounders, and validation of the obtained results in an independent validation cohort (3).
An additional possible explanation for discrepancy between the cohorts in our study and between different groups of investigators is that preanalytical variables could differ between the cohorts and influence RNA levels. Rekker et al. (40) documented diurnal variation of certain mRNAs in both control and endometriosis groups that impacted their differential expression in endometriosis. Blood collection (blood cell lysis, skin contamination), a fasting vs nonfasting state, or differing blood cell counts as well as sample storage conditions may influence plasma miRNA expression (34). The analysis of miRNAs is a relatively new, growing, and dynamic field of research with an increasing number of reports identifying additional preanalytical factors that influence circulating miRNA levels (34, 84, 85). Although international consensus has been reached on the best practice for taking some biological samples in endometriosis studies (86), there are no universal recommendations regarding the analysis of miRNAs, particularly in liquid samples.
Our findings reiterate the data presented in a recent systematic review that found little agreement between the studies that report diagnostic accuracy of circulating miRNAs in endometriosis (87). In concert, marked heterogeneity was present in miRNAs between the studies on the topic and highlighted a need for a harmonized approach to tissue biopsy collection, as well as specimen characterization, processing, and storage, all of which are important impediments in current miRNA research (88).
The strength of our study is its adherence to minimum information about a microarray experiment (29) and minimum information for publication of quantitative real-time PCR experiments (30) guidelines for laboratory experiments and to STARD (28) criteria for the diagnostic cohort studies. By utilizing a robust experimental approach and by comparing plasma samples from women with endometriosis to two different control groups, we explored every possibility of identifying miRNAs with diagnostic potential for endometriosis.
It is important to mention several limitations of this study. First, only the top 38 out of 74 identified miRNAs with some diagnostic potential in the array experiments were selected for validation, and it is possible that one or more of the others may have some diagnostic relevance. Thus, some biomarkers with the potential for diagnosing endometriosis may have been omitted. Furthermore, even though we matched as many clinical confounders as possible, we could not adjust for all of them. For instance, we did not evaluate the impact of comorbidities such as small intramural uterine fibroids, adenomyosis, or other pathologies that were not easily identifiable at laparoscopy, but could potentially confound the results.
In summary, no circulating miRNAs were identified that could on their own comprise a reproducible, noninvasive diagnostic test for endometriosis. We support the view in Agrawal et al.’s recent systematic review (87), which advocates optimizing circulating miRNA experimental methods and meticulously characterizing patient populations. This study highlights the importance of conducting diagnostic test accuracy studies in accordance with STARD criteria, of including only clinically relevant patient groups and of confirming these findings in an independent population before claiming a diagnostic test has clinical utility. Further collaborative work is required to understand whether circulating miRNAs have any utility in detecting or managing endometriosis.
Abbreviations:
- AUC
area under the ROC curve
- BMI
body mass index
- cel-miR-54
Caenorhabditis elegans miRNA
- Cq
quantification cycle
- E2
estradiol
- P4
progesterone
- rASRM
revised American Society of Reproductive Medicine
- ROC
receiver operating characteristic
- RT-qPCR
quantitative real-time PCR
- STARD
Standards for Reporting of Diagnostic Accuracy Studies
- TLDA
TaqMan low-density human miRNA array
Acknowledgments
The authors thank the medical staff of the Women’s and Children’s Hospital for assistance in sample collection, confirmation of diagnosis, and staging of disease: Dr. Ray Yoong, Dr. Wendy Hodge, Dr. Prabath Wagaarachchi, and Dr. Jane Zhang. We are grateful to the nursing staff from S.F.E.’s rooms, particularly to Diana Morgan, for valuable assistance in patient recruitment and to all of the patients who kindly agreed to participate in this study. We acknowledge useful discussions with Dr. Wee Ching Kong concerning techniques for miRNA quantification and analysis.
Financial Support: This work was supported by grants from Bio Innovation SA, the Fertility Society of Australia, Australian Gynaecological Endoscopy and Surgery Society, and the A. J. and J. S. Ballantyne Medical and Surgical Research Foundation to M.L.H. A Colin Matthews Research Fund grant was awarded to E.M.C.O.T.
Author Contributions: V.N.: conception and design of the study, patient recruitment, sample collection and sample processing, performance of experiments, acquisition of data, data analysis and interpretation, drafting manuscript, revising manuscript for critical content and final approval. D.J.S.: performance of experiments, data analyses, drafting manuscript, critical revision and final approval of the manuscript. Z.W.: performance of experiments and final approval of the manuscript. S.F.E.: patient recruitment, confirmation of diagnosis and staging of disease, preparation of patient information, and final approval of the manuscript. M.H.: patient recruitment, confirmation of diagnosis and staging of disease, preparation of patient information, and final approval of the manuscript. E.M.C.O.T.: conception and design, setup of the laboratory assays, performance of preliminary experiments, revising manuscript for critical content, and final approval of the manuscript. C.G.P.: analysis, interpretation, revising manuscript for critical content, and final approval of the manuscript. S.A.R.: design and interpretation of the study, revising manuscript for critical content, and final approval of the manuscript. M.L.H.: conception and design of the study, interpretation, drafting manuscript, revising manuscript for critical content and final approval.
Disclosure Summary: The authors have nothing to disclose.
