


Abstract
The combination of two beneficial antidiabetes interventions, regular exercise and pharmaceuticals, is intuitively appealing. However, metformin, the most commonly prescribed diabetes medication, attenuates the favorable physiological adaptations to exercise; in turn, exercise may impede the action of metformin.
We sought to determine the influence of an alternative diabetes treatment, sodium glucose cotransporter 2 (SGLT2) inhibition, on the response to endurance exercise training.
In a randomized, double-blind, repeated measures parallel design, 30 sedentary overweight and obese men and women were assigned to 12 weeks of supervised endurance exercise training, with daily ingestion of either a placebo or SGLT2 inhibitor (dapagliflozin: ≤10 mg/day).
Endurance exercise training favorably modified body mass, body composition (dual-energy x-ray absorptiometry), peak oxygen uptake (graded exercise with indirect calorimetry), responses to standardized submaximal exercise (indirect calorimetry, heart rate, and blood lactate), and skeletal muscle (vastus lateralis) citrate synthase activity (main effects of exercise training, all P < 0.05); SGLT2 inhibition did not influence any of these physiological adaptations (exercise training × treatment interaction, all P > 0.05). However, after endurance exercise training, fasting blood glucose was greater with SGLT2 inhibition, and increased insulin sensitivity (oral glucose tolerance test/Matsuda index) was abrogated with SGLT2 inhibition (exercise training × treatment interaction, P < 0.01).
The efficacy of combining two beneficial antidiabetes interventions, regular endurance exercise and SGLT2 inhibition, was not supported. SGLT2 inhibition blunted endurance exercise training–induced improvements in insulin sensitivity, independent of effects on aerobic fitness or body composition.
Increased physical activity and initiation of a program of regular exercise are recognized as being important for diabetes treatment and prevention (1). Depending on the initial health status and diabetes classification of the patient, exercise may be prescribed as the sole intervention or supplemented with medication, such as metformin, perhaps the most commonly prescribed antidiabetes agent (2–4). Unfortunately, a growing body of evidence has illustrated the unfavorable interactions between metformin and exercise (5–10). Specifically, metformin use has been shown to attenuate exercise-induced improvements in insulin sensitivity (10), blunt some of the favorable effects of exercise on risk factors for cardiovascular disease (such as blood pressure and inflammation) (8), lower peak aerobic capacity (6), and impair exercise-mediated improvements in hepatic mitochondrial function (7). Reciprocally, exercise has been shown to blunt the beneficial effects of metformin on postprandial circulating glucose (5, 9).
Noteworthy, metformin is not the only medication that has been shown to have potentially unfavorable interactions with exercise. For example, statins (HMG-CoA reductase inhibitors) have been reported to blunt the cardiopulmonary and skeletal muscle adaptations to exercise training in mice (11) and humans (12) and lower peak oxygen uptake in men (13). In rats, cardiorespiratory fitness and vascular adaptation to endurance training are attenuated by glucagon-like peptide-1 (GLP-1) receptor antagonism (14), whereas in humans GLP-1 receptor agonism appears to inhibit the exercise training–mediated improvements in left ventricular diastolic function (15). Furthermore, there is controversy as to the potential interference in the adaptation of bone to exercise training when combined with nonsteroidal anti-inflammatory drugs (16–18) and in the adaptation of skeletal muscle to exercise training when combined with antioxidants (19, 20).
In the context of diabetes, in the previous 5 to 10 years a number of pharmacological alternatives to metformin have become available (2, 21). Given the continued emphasis on the role of exercise in diabetes prevention and treatment (1), an understanding of the potential interactions between these newer diabetes medications and exercise has obvious clinical relevance. In this regard, the focus of the current study is the influence of sodium glucose cotransporter 2 (SGLT2) inhibition on the physiological adaptation to endurance exercise training.
After the first detailed description of sodium glucose cotransporters in the early 1990s (22), the potential for SGLT2 inhibition as a method to lower circulating glucose was recognized and these properties subsequently exploited to create a safe antidiabetes therapy. Since then, several SGLT2 inhibitors have been developed and approved for human use, including dapagliflozin (23), the SGLT2 inhibitor studied in the current investigation. The mechanism of action is via attenuation of renal reabsorption of glucose, thus promoting glucosuria. Support for the efficacy of SGLT2 inhibitors is widespread. For example, specific to dapagliflozin, 24 weeks of 5 and 10 mg/day lowered fasting plasma glucose and glycosylated hemoglobin and decreased body mass in adults with type 2 diabetes (24). More recently, evidence is emerging that SGLT2 inhibition may have additional clinical benefits, such as decreased prevalence of adverse cardiovascular events (25), and, perhaps more pertinent to the current study, additional physiological benefits, including improved vascular function (26) and arterial stiffness (27), weight loss (24), a preferential switch to lipid for substrate utilization (28), and improved cardiac (left ventricular) diastolic function (29, 30), These are all characteristics or adaptations also associated with habitual aerobic physical activity. In light of these similarities between the physiological responses to exercise training and SGLT2 inhibitor use, in the current study we explore the potential interaction between endurance exercise training and SGLT2 inhibition. We hypothesized that SGLT2 inhibition would augment the physiological adaptations to endurance exercise training.
Materials and Methods
Study design
A randomized, double-blind, repeated measures parallel design was used. The trial was registered at ClinicalTrials.gov (identifier: NCT02371187) and conducted in accordance with the Good Clinical Practice guidelines. All procedures were reviewed and approved by the institutional review board at Colorado State University in accordance with the principles set out in the Declaration of Helsinki. All participants provided written informed consent before commencing involvement in the study.
Participants
Sedentary overweight and obese men and women were invited to participate. Inclusion criteria included age within the range 18 to 50 years, body mass index (BMI) within the range 25 to 45 kg/m2, sedentary lifestyle (defined as a maximum of two regularly scheduled weekly activity sessions of <20 minutes duration during the previous 2 years), and being willing and physically able to perform endurance exercise. Exclusion criteria consisted of evidence of cardiovascular, respiratory, renal, hepatic, pulmonary, gastrointestinal, hematological, neurologic, psychiatric, or other disease that may interfere with the objectives of the study or the safety of the participant, use of prescription drugs (with the exception of birth control and medicine for gastroesophageal reflux disease, seasonal allergies, and depression), use of tobacco products within the previous 2 years, and pregnancy or breastfeeding.
Protocol overview
After screening, all research participants began 12 weeks of supervised endurance exercise training combined with daily ingestion of either a placebo or an SGLT2 inhibitor. Before and after exercise training, participants were assessed for body mass and composition, peak oxygen uptake (VO2peak), physiological responses to standardized submaximal exercise, skeletal muscle aerobic enzyme activity, and insulin sensitivity.
Procedures
Screening included review of medical history, physical examination, and completion of an exercise stress test (from rest to volitional fatigue) with 12-lead electrocardiogram and blood pressure assessment. After participant enrollment, primary outcome variables were measured over several separate visits to the laboratory before and after endurance exercise training.
Body composition was assessed with dual-energy x-ray absorptiometry (Discovery W, QDR Series; Hologic, Bedford, MA), as previously described (31). In addition, body mass was determined with a physician’s digital scale, and waist circumference was measured midway between the lower border of the costal margin and the uppermost border of the iliac crest. VO2peak was determined via indirect calorimetry (Parvo Medics, Sandy, UT) during incremental stationary cycle ergometer exercise to volitional fatigue, as previously described (32).
On a separate day, participants performed standardized exercise. This consisted of three 10-minute bouts of work on an electrically braked cycle ergometer (Dynafit Velotron; Racermate Inc., Seattle, WA). External work rates were 25, 50, and 100 W. During the final 2 minutes of each bout, heart rate, VO2, respiratory exchange ratio (crude indicator of substrate utilization), ratings of perceived exertion (33), and circulating concentrations of lactate (2900 STAT Plus Glucose Lactate Analyzer; YSI Inc., Yellow Springs, OH) were recorded.
After a 12-hour fast and 24-hour abstention from exercise, participants reported to the laboratory for completion of an oral glucose tolerance test (OGTT) and skeletal muscle sampling. Participants ingested 75 g of glucose diluted in 300 mL water; venous blood was sampled before ingestion and systematically over the next 2 hours for the determination of circulating concentrations of glucose (2300 STAT Plus Glucose Lactate Analyzer, YSI Inc.) and insulin (enzyme-linked immunosorbent assay; Crystal Chem, Inc., Elk Grove Village, IL), in a manner similar to that previously described (34). Insulin sensitivity was estimated via the Matsuda index (35), a widely accepted alternative to the gold standard euglycemic hyperinsulinemic clamp technique (36). Immediately after completion of the OGTT, the vastus lateralis was sampled with standard procedures (37) and analyzed for citrate synthase activity (MitoCheck Citrate Synthase Activity Assay Kit; Cayman Chemical, Ann Arbor, MI), a marker of mitochondrial function and skeletal muscle oxidative capacity.
Endurance exercise training
Endurance exercise training began with three training sessions per week of 20 to 40 minutes (in addition to a 5-minute self-paced warmup and cooldown), progressing to four sessions per week of 40 to 60 minutes on week 4. Participants exercised at an intensity that elicited a heart rate equivalent to 70% to 80% of heart rate reserve (i.e., the difference between resting and maximal heart rate). Exercise modalities were treadmill walking or running, stationary cycle ergometer exercise, and elliptical ergometer exercise. The modalities were varied between (but not within) sessions to avoid boredom and potential overuse injuries. The exercise training sessions and modalities were matched between groups; that is, the participants assigned to the placebo or the SGLT2 inhibitor completed the same number of treadmill, cycle ergometer, and elliptical ergometer sessions. In total, each participant was scheduled to complete 44 exercise sessions. Participants who failed to complete 40 sessions (~90%) or two sessions within a 7-day period were removed from the study.
Treatment
Research participants were randomly assigned to placebo or the SGLT2 inhibitor, dapagliflozin, via coin toss, until one treatment had 15 enrollees, after which all remaining participants were assigned to the other treatment. Assignments were completed in a double-blind fashion. Oral ingestion of either dapagliflozin or placebo coincided with the first day of endurance exercise training and ended on the last day of endurance exercise training. The dosage of dapagliflozin began as 5 mg/day for the first 14 days. In the absence of complications, side effects, or unfavorable reactions, the dosage was increased to 10 mg/day for the remainder of the study. The cessation of both treatments (placebo and SGLT2 inhibition) coincided with the final bout of exercise training.
Statistical analysis
Baseline (before exercise training) differences between placebo and SGLT2 inhibition groups were compared via independent Student t tests. Consistent with the experimental design (randomized, double-blind, parallel, repeated measures) the influence of SGLT2 inhibition on the physiological responses to endurance exercise training was examined via two-way (placebo vs. SGLT2 inhibition × before vs. after exercise training) ANOVA with repeated measures (before and after exercise training). The influence of SGLT2 inhibition and endurance exercise training on the dynamic responses to standardized exercise and oral glucose ingestion were examined via three-way ANOVA (placebo vs. SGLT2 inhibition × before vs. after exercise training × time or exercise intensity, as appropriate). Pairwise multiple comparison procedures were performed via the Holm-Sidak method. Relations of interest were described via Pearson product moment correlations. The level of statistical significance was set at P < 0.05. Data are reported as mean and standard deviation, unless otherwise indicated. Calculations were performed in commercially available statistical software (SigmaStat 3.0; Systat Software Inc., San Jose, CA).
Results
The progress of all participants throughout the trial (from screening to completion) is presented in Fig. 1. A total of 30 participants completed the study; baseline physiological characteristics are presented in Table 1. Consistent with the inclusion and exclusion criteria, participants displayed physiological characteristics typical of sedentary and overweight or obese but otherwise healthy adults. There were no baseline differences in any of the primary variables between the placebo and SGLT2 inhibitor groups, although the unequal distribution of men and women within each group is noted.
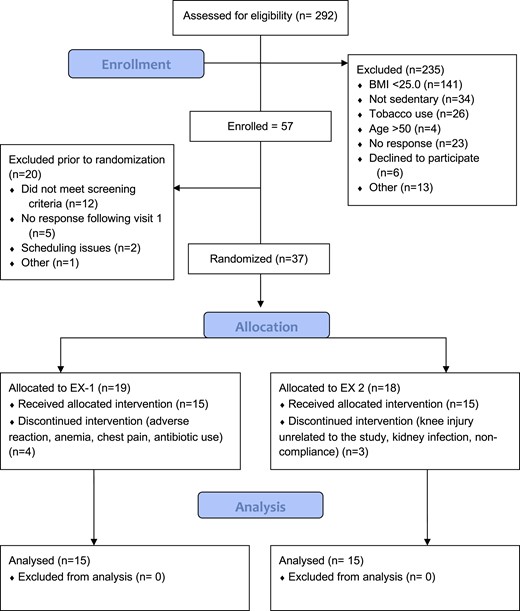
Progress of all participants throughout the trial (from screening to completion).
Selected Baseline Physiological Characteristics
| Placebo | SGLT2 Inhibition | P | |
|---|---|---|---|
| Male/female | 7/8 | 4/11 | — |
| Age, y | 24 ± 10 | 28 ± 12 | 0.24 |
| Height, m | 1.71 ± 0.10 | 1.67 ± 0.08 | 0.23 |
| Body mass, kg | 91.8 ± 16.9 | 87.8 ± 17.3 | 0.53 |
| BMI, kg/m2 | 31.2 ± 4.3 | 31.3 ± 5.4 | 0.94 |
| Blood pressure, mm Hg | 129/82 ± 13/11 | 130/83 ± 14/10 | 0.79/0.79 |
| VO2peak, mL/kg/min | 30.1 ± 6.1 | 26.9 ± 5.3 | 0.13 |
| VO2peak, mL/kg fat-free mass/min | 47.5 ± 8.5 | 44.5 ± 6.3 | 0.28 |
| Fasting glucose, mg/dL | 75.8 ± 5.1 | 78.8 ± 7.3 | 0.21 |
| Fasting insulin, mU/L | 8.9 ± 6.7 | 7.6 ± 4.0 | 0.53 |
Data are mean ± SD.
Endurance exercise training and medication compliance
Compliance with exercise training was similar between groups (placebo, 94% vs. SGLT2 inhibition, 96%; P > 0.10). Exercising heart rate data are presented in Fig. 2; there were no group differences across the 12 weeks, indicating the training stimulus was similar irrespective of group assignment. Consistent with heart rate data, aside from unexpected differences during the first seven sessions, ratings of perceived exertion were also similar between groups. Medication compliance was excellent and did not differ between groups (100% for both placebo and SGLT2 inhibition).
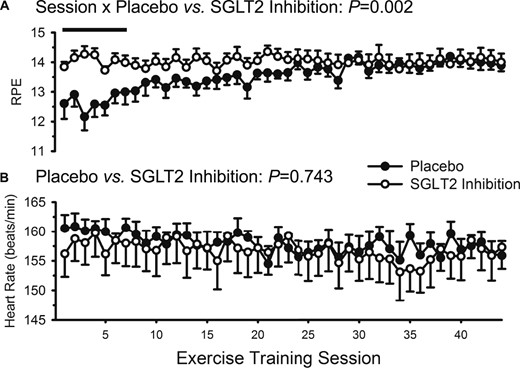
Ratings of perceived exertion (RPE) and heart rate during the 44 supervised exercise training sessions over 12 weeks. Data are mean ± SE. Closed circles represent placebo. Open circles represent SGLT2 inhibition. (A) RPE was greater in the SGLT2 inhibition group during the first seven exercise training sessions (as indicated by the solid straight line); (B) heart rate was similar between the placebo and SGLT2 inhibitor groups throughout the entire 12 weeks of training.
Body mass and composition
Body mass and composition data are presented in Fig. 3 and Table 2. Endurance exercise training favorably modified body mass and composition, with decreases in mass, BMI, fat mass, percentage body fat, and waist circumference (all main effects of exercise training, P ≤ 0.01). Lean mass and bone mineral content were unchanged. SGLT2 inhibition did not influence any of these adaptations (all interactions, P > 0.10).
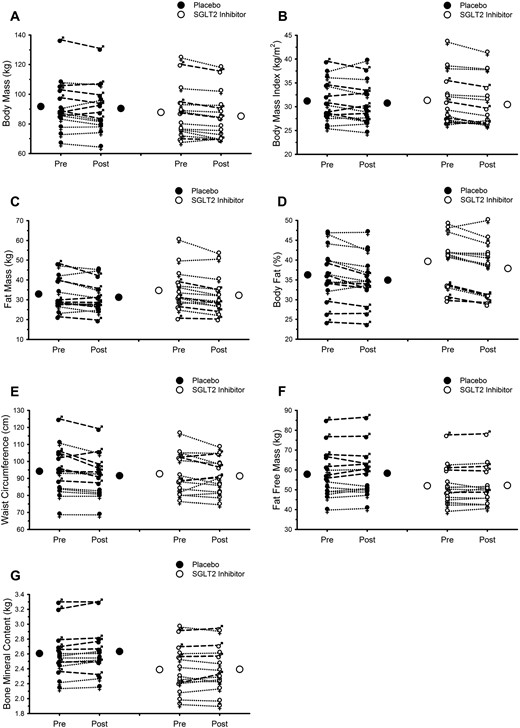
Endurance exercise training favorably modifies body mass and composition; SGLT2 inhibition does not attenuate these adaptations. (A) Body mass. (B) BMI. (C) Fat mass. (D) Percentage body fat. (E) Waist circumference. (F) Fat-free mass. (G) Bone mineral content. In all panels, Pre and Post refer to data collected before and after 12 weeks of supervised exercise training, respectively. Closed and open circles represent mean responses for placebo and SGLT2 inhibition, respectively. Male symbols and dashed lines represent individual male participant responses. Female symbols and dotted lines represent individual female participant responses. All closed symbols represent placebo. All open symbols represent SGLT2 inhibition. See Table 2 for results of statistical analysis.
Body Mass and Composition Before and After 12 Weeks of Endurance Exercise Training With and Without Concurrent SGLT2 Inhibition
| Placebo | SGLT2 Inhibition | ANOVA P | |||||
|---|---|---|---|---|---|---|---|
| Before Training | After Training | Before Training | After Training | Group | Training | Interaction | |
| Body mass, kg | 91.8 ± 17.0 | 90.5 ± 16.3 | 87.8 ± 17.3 | 85.3 ± 16.1 | 0.459 | 0.002 | 0.283 |
| BMI, kg/m2 | 31.2 ± 4.3 | 30.8 ± 4.4 | 31.3 ± 5.3 | 30.5 ± 5.1 | 0.966 | 0.002 | 0.266 |
| Fat mass, kg | 32.9 ± 8.5 | 31.3 ± 7.7 | 34.7 ± 10.2 | 32.3 ± 9.5 | 0.669 | <0.001 | 0.350 |
| Body fat, % | 36.3 ± 6.7 | 35.0 ± 6.2 | 39.7 ± 6.2 | 37.9 ± 6.4 | 0.181 | <0.001 | 0.426 |
| Waist circumference, cm | 94.2 ± 14.1 | 91.6 ± 12.6 | 92.7 ± 11.9 | 91.4 ± 10.2 | 0.854 | 0.010 | 0.345 |
| Fat-free mass, kg | 57.8 ± 12.2 | 58.3 ± 12.1 | 52.0 ± 9.9 | 52.2 ± 9.9 | 0.150 | 0.261 | 0.618 |
| BMC, kg | 2.607 ± 0.315 | 2.634 ± 0.323 | 2.390 ± 0.316 | 2.394 ± 0.310 | 0.057 | 0.065 | 0.153 |
| BMC in the legs, kg | 0.936 ± 0.162 | 0.944 ± 0.170 | 0.848 ± 0.172 | 0.853 ± 0.168 | 0.154 | 0.200 | 0.799 |
Data are mean ± SD.
Abbreviation: BMC, bone mineral content.
Responses to submaximal and peak exercise
Exercise data are presented in Fig. 4 and Table 3. Endurance exercise training increased peak work rate and VO2peak, whether expressed in absolute units or scaled to body mass (all main effects of exercise training, P < 0.001); SGLT2 inhibition did not influence any of these adaptations (all interactions, P > 0.10). After exercise training, VO2 was lower during standardized exercise (main effects of exercise training, P = 0.01); again, SGLT2 inhibition did not influence this response (interaction, P = 0.50). Heart rate, respiratory exchange ratio, and circulating lactate concentration were all lower after endurance training (all main effects of exercise training, P ≤ 0.002), but only the lactate data demonstrated an interaction between exercise training and group (P = 0.02). That is, before and during the exercise test, the average pretraining lactate values were higher in the SGLT2 inhibition group, but after training, the average lactate values were not different between placebo and SGLT2 inhibition. Skeletal muscle citrate synthase activity was increased with endurance training (P = 0.01); SGLT2 inhibition did not influence this training response (P = 0.27).
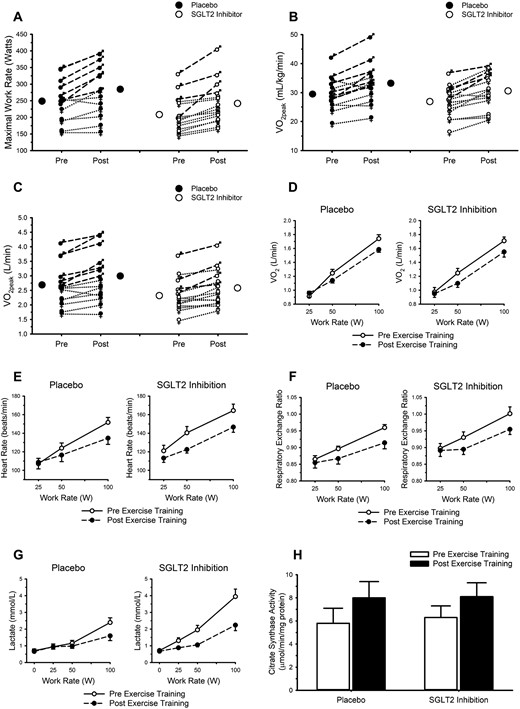
Endurance exercise training favorably modifies responses to maximal and submaximal exercise; SGLT2 inhibition does not attenuate these adaptations. (A) Maximal work rate. (B and C) Peak oxygen uptake (VO2peak). (A–C) Closed and open circles represent mean responses for placebo and SGLT2 inhibition, respectively. Male symbols and dashed lines represent individual male participant responses. Female symbols and dotted lines represent individual female participant responses. All closed symbols represent placebo. All open symbols represent SGLT2 inhibition. Responses to submaximal exercise are displayed in panels D–H. (D) VO2. (E) Heart rate. (F) Respiratory exchange ratio. (G) Circulating lactate concentration. (H) Citrate synthase activity in samples of the vastus lateralis (placebo n = 8; SGLT2 inhibitor n = 14). In panels D–H, data are mean ± SE. Open circles and solid lines represent data before exercise training. Closed circles and dashed lines represent data after exercise training. See Table 3 for results of statistical analysis.
Peak Exercise Responses and Skeletal Muscle (Vastus Lateralis) Activity Before and After 12 Weeks of Endurance Exercise Training With and Without Concurrent SGLT2 Inhibition
| Placebo | SGLT2 Inhibition | ANOVA P | |||||
|---|---|---|---|---|---|---|---|
| Before Training | After Training | Before Training | After Training | Group | Training | Interaction | |
| Work ratepeak, W | 249 ± 60 | 282 ± 78 | 208 ± 55 | 242 ± 65 | 0.097 | <0.001 | 0.816 |
| VO2peak, mL/kg/min | 30.1 ± 6.1 | 32.4 ± 7.5 | 26.9 ± 5.3 | 30.6 ± 6.1 | 0.241 | <0.001 | 0.989 |
| VO2peak, L/min | 2.79 ± 0.82 | 2.98 ± 0.85 | 2.32 ± 0.56 | 2.58 ± 0.63 | 0.146 | <0.001 | 0.606 |
| Citrate synthase activity, μmol/min/mg protein | 5.8 ± 3.6 | 8.0 ± 4.0 | 6.3 ± 3.7 | 8.1 ± 4.5 | 0.840 | 0.010 | 0.267 |
Data are mean ±SD.
Oral glucose tolerance
Circulating glucose and insulin concentrations before and after endurance exercise training are presented in Fig. 5 and Table 4, with baseline fasting insulin and glucose data presented in Table 1. As in Table 1, before exercise training fasting glucose was similar between the placebo and SGLT2 inhibition groups. However, after endurance exercise training, statistical analyses revealed an interaction between exercise training and treatment (P = 0.032). Post hoc analysis revealed higher fasting glucose after exercise training in the SGLT2 inhibition group compared with placebo (73.6 ± 6.4 vs. 82.0 ± 8.1 mg/dL).
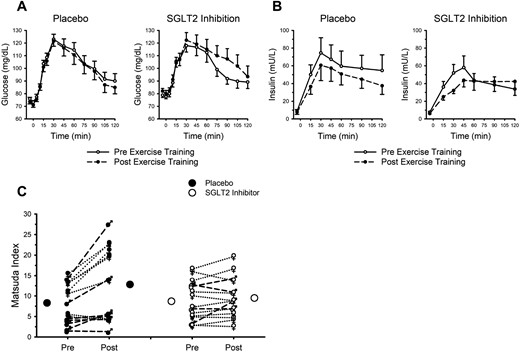
Endurance exercise training favorably modifies insulin sensitivity; SGLT2 inhibition does not attenuate these adaptations. (A) Circulating glucose concentration after ingestion of 75 g of glucose. (B) Circulating insulin concentration after ingestion of 75 g of glucose. (A and B) Data are mean ± SE. Open circles and solid lines represent data before exercise training. Closed circles and dashed lines represent data after exercise training. (C) Closed and open circles represent mean responses for placebo and SGLT2 inhibition, respectively. Male symbols and dashed lines represent individual male participant responses. Female symbols and dotted lines represent individual female participant responses. All closed symbols represent placebo. All open symbols represent SGLT2 inhibition. Data are mean ± SE. See Table 4 for data pertaining to calculated areas under the curves and results of statistical analysis.
OGTT-Derived Data Before and After 12 Weeks of Endurance Exercise Training With and Without Concurrent SGLT2 Inhibition
| Placebo | SGLT2 Inhibition | ANOVA P | |||||
|---|---|---|---|---|---|---|---|
| Before Training | After Training | Before Training | After Training | Group | Training | Interaction | |
| Glucose | |||||||
| Area under curve, mg/dL/min | 12,383 ± 2069 | 12,177 ± 2377 | 12,161 ± 1815 | 12,925 ± 2796 | 0.728 | 0.503 | 0.249 |
| Area under curve 0–1 h, mg/dL/min | 6472 ± 849 | 6362 ± 927 | 6437 ± 1033 | 6572 ± 1174 | 0.787 | 0.949 | 0.527 |
| Area under curve 1–2 h, mg/dL/min | 5911 ± 1346 | 5815 ± 1536 | 5724 ± 981 | 6353 ± 1854 | 0.712 | 0.337 | 0.196 |
| Insulin | |||||||
| Area under curve, mU/L/min | 4857 ± 3923 | 3821 ± 2852 | 4280 ± 2944 | 3786 ± 3030 | 0.779 | 0.143 | 0.597 |
| Area under curve 0–1 h, mU/L/min | 2084 ± 1557 | 1565 ± 1290 | 1815 ± 1197 | 1232 ± 565 | 0.450 | 0.014 | 0.881 |
| Area under curve 1–2 h, mU/L/min | 2773 ± 2548 | 2255 ± 1687 | 2465 ± 1913 | 2553 ± 2662 | 0.995 | 0.562 | 0.415 |
| Matsuda index | 8.3 ± 4.9 | 12.8 ± 8.9 | 8.7 ± 4.8 | 9.5 ± 4.8 | 0.512 | <0.001 | 0.006 |
Data are mean ± SD.
Although there were no appreciable main effects of endurance exercise training (P = 0.39) on the overall circulating glucose response to glucose ingestion (Fig. 5A), there was a noteworthy interaction (P = 0.01). The overall glucose response during the 2-hour OGTT was decreased with exercise training in the placebo group and increased in the SGLT2 inhibition group (i.e., interaction of group × training × time; Fig. 5A). As in Table 4, there were no notable main effects of exercise training, or exercise training interactions with placebo vs. SGLT2 inhibition, pertaining to estimated areas under the glucose curves.
Fasting insulin was unaffected by endurance exercise training or placebo vs. SGLT2 inhibition (all Ps > 0.07). As in Fig. 5B, the influence of endurance exercise training on the overall insulin response to glucose ingestion did not attain statistical significance (P = 0.06), nor was there an interaction (P = 0.49). Analysis of the estimated areas under the insulin curves (Table 4) revealed lower insulin during the first hour of the OGTT after exercise training; SGLT2 inhibition did not influence this response.
Combining the glucose and insulin data via the Matsuda index, an indicator of insulin sensitivity, revealed an appreciable and favorable main effect of endurance exercise training (P < 0.001); SGLT2 inhibition attenuated this response (interaction, P = 0.006). As in Fig. 5C, insulin sensitivity was improved in 12 of the 15 participants in the placebo group, in contrast to only 8 of the 15 participants assigned to SGLT2 inhibition.
Relations of interest
Both BMI and age varied greatly within our study population (25.4 to 43.6 kg/m2, and 18 to 48 years). To determine the potential influence of BMI and age on our primary outcomes, bivariate correlations were used to examine the relationship between these baseline characteristics and the magnitude of change in the primary outcome variables in the pooled data (i.e., all subjects, irrespective of treatment assignment). Neither baseline age nor BMI were related to the changes in body mass, body fat, VO2peak, or Matsuda index (all Ps > 0.05). The only relation that came close to attaining significance was between baseline BMI and the absolute change in body fat (r = −0.36, P = 0.051; i.e., more fat lost in people with the highest baseline BMI); all other correlations were P > 0.27.
To further explore the unexpected outcome pertaining to insulin sensitivity, we examined the magnitude of change in insulin sensitivity with pre–exercise training (baseline) insulin sensitivity. A significant positive correlation was present within the placebo group (r = 0.80, P < 0.001) but absent within the SGLT2 inhibition group (r = −0.18, P = 0.515).
Conclusions
In light of reported unfavorable drug-exercise interactions, including metformin, statins, nonsteroidal anti-inflammatory drugs, and GLP-1 targeting agents, the purpose of the current study was to investigate the potential influence of an alternative and recently developed diabetes therapy, SGLT2 inhibition, on the physiological adaptations to endurance exercise training. Twelve weeks of endurance exercise training favorably modified body mass and composition, VO2peak, responses to standardized submaximal exercise, skeletal muscle citrate synthase activity, and insulin sensitivity. The current study found that SGLT2 inhibition neither augmented nor attenuated any of these beneficial physiological adaptations, with the exception of increasing fasting blood glucose relative to placebo and abrogating the improvement in insulin sensitivity.
In the context of combining pharmacotherapy and increased physical activity for diabetes prevention and treatment, the therapeutic properties of SGLT2 inhibition are such that they might feasibly be of benefit to exercise training. In addition to reports of improved vascular function (26), decreased arterial stiffness (27), improved cardiac (left ventricular) function (29, 30), and a preferential switch to fatty acid oxidation for substrate utilization (28), SGLT2 inhibition has also been associated with weight loss (24) and pseudo-carbohydrate restriction. Previously it has been shown that as a consequence of excess body (fat) mass or metabolic dysfunction, the health-promoting effects of exercise training may be blunted (38–41). This finding has led some to speculate about the potential advantage of prior or concurrent weight loss to augment the adaptation to exercise (42, 43); thus, the weight loss associated with SGLT2 inhibition may be particularly beneficial. Furthermore, although somewhat controversial, a low-carbohydrate diet has been proposed to increase the benefits of endurance exercise training by enhancing the metabolic pathways associated with fat and ketone metabolism (44). In this regard, on account of decreased renal glucose reabsorption and increased glucosuria, SGLT2 inhibition may act as a mimetic for an athletic ketogenic diet (45) and favorably modify cardiac energy status (46, 47). In actual fact, data from the current study showed that endurance exercise training evoked expected physiological adaptations (e.g., increased aerobic capacity, improved body composition), and, for the most part, SGLT2 inhibition neither augmented nor attenuated these adaptations. The two important exceptions to this observation were fasting blood glucose and insulin sensitivity. The divergent fasting blood glucose response to endurance exercise training (greater with SGLT2 inhibition after training) was unexpected. Similarly, the abrogation of the training-mediated improvement in insulin sensitivity with SGLT2 inhibition was not predicted. At this time, the mechanisms to explain these unexpected and somewhat counterintuitive outcomes are not clear. Within the placebo group, the magnitude of change in insulin sensitivity was correlated with pre–exercise training (baseline) insulin sensitivity; this relationship was absent within the SGLT2 inhibition group. Pre–exercise training insulin sensitivity was not different between the placebo (8.3 ± 4.9) and SGLT2 inhibition (8.7 ± 4.8) groups (P = 0.80), and thus the law of initial baseline does not explain the unfavorable exercise-SGLT2 inhibition interaction. Alternatively, as in Table 1, there was an unequal distribution of men and women within each group (greater ratio of women to men in the SGLT2 inhibition group), and thus it is possible the unfavorable interaction between SGLT2 inhibition and exercise training as it pertains to insulin sensitivity could be attributed to a potential sex difference. However, three-way ANOVA (male vs. female × placebo vs. SGLT2 inhibition × before vs. after exercise training) revealed no main effect of sex (P = 0.08) and no interaction between sex and the influence of SGLT2 inhibition on the exercise training response (P = 0.73). Finally, based on recent reports (48), it is plausible the increased fasting blood glucose and absence of improved insulin sensitivity after exercise training combined with SGLT2 inhibition could have been mediated by increased glucagon secretion from pancreatic alpha cells. Unfortunately, we did not measure glucagon and are therefore unable to address this potential mechanism. Although definitive explanations for the abrogated training-mediated improvement in insulin sensitivity with SGLT2 inhibition remain elusive, it is important to consider the physiological relevance of these observations. As indicated by fasting blood glucose concentration and the metabolic responses to ingestion of glucose, all participants began the current study with normal glucose tolerance; at the completion of the study, this classification for diabetes and glucose control was unchanged. It may be that the response of adults with diabetes to a combination of exercise training and SGLT2 inhibition will be different from that of our study participants, who all exhibited normal glucose control.
The higher ratings of perceived exertion with SGLT2 inhibition during the early exercise training sessions were unexpected. We speculate that this finding could be explained partly in the context of potential decreased carbohydrate availability. SGLT2 inhibition limits dietary carbohydrate absorption; higher exercise ratings of perceived exertion during the initial adaptations to low-carbohydrate diets have been reported (49, 50). We have also considered the unequal distribution of men and women between the two treatment groups. There are some selective reports of sex differences pertaining to ratings of perceived exertion during exercise (51, 52), but this observation is not consistent across all studies. Alternatively, a recent report (53) suggested that the SGLT2 inhibitor luseogliflozin lowered resting heart rate after 12 weeks for patients with diabetes who had higher baseline heart rates (i.e., defined by the authors as >70 beats per minute). The authors speculated that the mechanism may be via decreased sympathetic activation. If SGLT2 inhibition does lower heart rate, and in our study exercise prescription was based on heart rate reserve, then it is plausible that the participants receiving the SGLT2 inhibition could have been working at a higher absolute intensity. However, in contrast to the luseogliflozin study, a single dose of either empagliflozin or dapagliflozin has no effect on heart rate or QT interval (54, 55), and 8 weeks of empagliflozin has been reported to have no effect on heart rate, heart rate variability (an indicator of cardiac autonomic balance), or circulating catecholamines (56). Thus, the interaction between SGLT2 inhibition and perceived exertion and heart rate during exercise remains a fertile topic for scientific evaluation.
Similar to most medications, SGLT2 inhibitors are not without side effects. For example, recent reports suggest that SGLT2 inhibition (57), and specifically canagliflozin (58), may be associated with decreased bone health and increased fracture risk. In this context, the coupling of exercise and SGLT2 inhibition may be beneficial because exercise, particularly load-bearing and impactful exercise, is known to promote bone health. Pertinent to our study, 12 weeks of endurance exercise training would normally be considered to be insufficient to increase bone density. The observed magnitudes of increase in whole body and lower-limb bone mineral content did not attain statistical significance (P ≥ 0.20); importantly, these responses did not appear to be influenced by SGLT2 inhibition. Most recent studies suggest that the evidence for a link between SGLT2 inhibition and fracture risk may not be as compelling as perhaps first thought (59, 60).
There are several limitations in our study worthy of discussion. In the current investigation we chose to focus on sedentary overweight and obese adults, who, though free from diabetes, were nevertheless at risk for developing insulin resistance on account of their lifestyle and body habitus. Our rationale for choosing this population was to establish an experimental model that would allow investigation of the potential interaction between exercise training and SGLT2 inhibition without the additional complications associated with diabetes and metabolic dysfunction (38–41). This rationale could be construed as a potential limitation in the context of the effectiveness and relevance of SGLT2 inhibition in adults free from diabetes. However, at least two independent investigations have demonstrated that SGLT2 inhibition (dapagliflozin, 10 mg/day) mediated glucosuria (~40 to 80 g/day) in healthy, diabetes-free adults of varied race and background (61, 62). Furthermore, there is considerable precedent for studying the physiological responses to pharmacotherapy in healthy, disease-free populations (6, 13, 14, 16, 18, 54, 55), including the landmark Diabetes Primary Prevention Trial (1), in which the use of metformin was evaluated in adults without diabetes. Thus, we remain convinced as to the sagacity of the rationale for our experimental approach.
The exercise training sessions were scheduled with little regard to time of day, time since most recent ingestion of food, and time since ingestion of treatment. The rationale for this approach was based on our intention to facilitate exercise compliance and promote maximum ecological validity. That is, we did not want to impose additional constraints on previously sedentary overweight or obese adults about to begin 12 weeks of regular endurance exercise training. We recognize that this approach may have introduced potential bias or variability into our data, but this bias was likely to be random and not systematic, and thus we do not believe it influenced our outcomes or our interpretation of the data.
The favorable endurance exercise training–mediated changes in body mass and composition were not influenced by SGLT2 inhibition. However, it may have been useful to confirm that these changes were mediated to the same extent, across each condition (i.e., exercise plus placebo vs. exercise plus SGLT2 inhibition), by exercise training or potential changes in dietary intake. The manner in which initiation of regular aerobic exercise might influence eating behavior and dietary intake in overweight and obese adults remains highly controversial (63); initial insight into the potential interaction of exercise training combined with SGLT2 inhibition may have been of value.
Additional limitations include our decision to study glucose regulation by using the OGTT instead of insulin sensitivity via the gold standard hyperinsulinemic euglycemic clamp technique and our reliance on a single aerobic enzyme, citrate synthase, to characterize the changes in skeletal muscle. Our choice of technique for measuring glucose regulation was driven by the light burden it would impose on our research participants. Citrate synthase was selected as our aerobic enzyme of interest because of its strong relationship with other physiological characteristics, including skeletal muscle mitochondrial volume (64) and whole body maximal oxygen uptake (65).
The study has important clinical implications. The positive effects of exercise are ubiquitous; all organs and systems benefit from regular exercise. Specific to diabetes, regular exercise promotes insulin sensitivity (66, 67), can prevent the transition from prediabetes to diabetes (1), and can attenuate the symptoms and prevalence of comorbidities and reduce the mortality associated with type 2 diabetes (68–70). In the clinical setting, the health practitioner may be tempted to supplement exercise prescription with pharmacology. Combining two independent interventions, where each is known to have favorable antidiabetes outcomes, is intuitively appealing. However, in light of the reviewed metformin (5–10), GLP-1 (14, 15), and statin (11–13) literature, this approach may be counterproductive from the perspective of the intended aims of exercise and of medication prescription. Our data suggest that some of the same concerns may be warranted if exercise is supplemented with SGLT2 inhibition.
Endurance exercise training evoked many favorable and predictable responses in previously sedentary overweight and obese adults; the current study found that SGLT2 inhibition did not attenuate or augment any of these beneficial physiological adaptations, with the notable exceptions of increasing fasting glucose relative to placebo and abrogating the desirable change in insulin sensitivity. As with other medications, such as metformin, statins, and GLP-1 agents, the baseline health status and final goals for concomitant prescription of exercise and SGLT2 inhibition may need to be considered carefully before initiation.
Abbreviations:
- BMI
body mass index
- GLP-1
glucagon-like peptide-1
- OGTT
oral glucose tolerance test
- SGLT2
sodium glucose cotransporter 2
- VO2peak
peak oxygen uptake
Acknowledgments
The authors are grateful to E. W. Clark, J. R. Fleck, M. R. Hanson, B. L. Hayward, L. C. Hoskovec, S. P.P. Ryan, A. M. Scheifley, and J. Theisen for supervision of endurance exercise training, to M. S. Hickey and A. R. Konopka for assistance with skeletal muscle sampling, and to E. A. Thompson for administrative and quality assurance support.
Financial Support: AstraZeneca Pharmaceuticals LP provided financial support to C.B. for this investigator-initiated project.
Clinical Trial Information: ClinicalTrials.gov no. NCT02371187 (registered 25 February 2015).
Author Contributions: A.A.N., N.C.G., J.R.W., H.M.S., S.R.J.T., C.L.M., and C.B. produced the data. J.R.W., C.L.M., and C.B. designed the study. A.A.N., N.C.G., J.R.W., H.M.S., S.R.J.T., C.L.M., and C.B. analyzed the data. C.B. wrote the first draft of the manuscript. All authors contributed editorially to subsequent manuscript drafts. All authors approved the final draft. C.B. is the guarantor of this work and as such had full access to all the data in the study and takes responsibility for the integrity of the data and the accuracy of the data analysis.
Disclosure Summary: The authors have nothing to disclose.
