


Abstract
Women with polycystic ovary syndrome (PCOS) have a higher prevalence of metabolic syndrome (MetS), but whether they develop MetS earlier than women without PCOS is unknown. Understanding the impact of PCOS on the timing of MetS onset is important for screening and clinical care in this population.
Women with PCOS-like status (PCOSp) were identified from participants of the Michigan Bone Health and Metabolism Study based upon history of irregular menstrual cycles, high free-androgen index, and high levels of antimüllerian hormone. MetS was defined according to the Adult Treatment Panel III criteria. Age at MetS onset was compared between women with and without PCOSp using an accelerated failure time model adjusted for baseline education, lifestyle factors, and midlife body weight.
Among the 496 women in the analysis, 11.7% (n = 58) were determined to have PCOSp. Over a mean follow-up of 11 years, 20 women with PCOSp and 136 women without PCOSp developed MetS. After adjusting for smoking, education, and physical activity, women with PCOSp developed MetS at an age 14.4% (95% CI −22.7, −5.2) younger than women without PCOSp. The magnitude of the association was attenuated to 5.4% in models additionally adjusted for body mass index (95% CI −12.4, 2.1). Because a typical study participant without PCOSp developed MetS at 51.5 years old, 5.4% translates to almost 3 years earlier onset of MetS for a comparable woman with PCOSp.
Women with PCOSp develop MetS at a younger age. Earlier screening for MetS in women with PCOS may be warranted.
Polycystic ovary syndrome (PCOS) is a common endocrine disorder affecting 6% to 10% of reproductive-aged women (1). The syndrome is typically characterized by a triad of ovulatory dysfunction, hyperandrogenism, and polycystic ovarian morphology (PCOM), although not all patients have all three of these features. The widely accepted Rotterdam criteria (2) define PCOS as the presence of any two of these three cardinal features, underlining the heterogeneity of this disorder.
In addition to the hallmark reproductive and endocrine abnormalities, a growing body of evidence suggests that women with PCOS have a higher risk for developing metabolic syndrome (MetS) (3, 4). Defined as a clustering of central obesity, dyslipidemia, hypertension, and abnormal glucose metabolism, MetS not only contributes to morbidity and reduced quality of life at its onset, but also predicts increased disability, cardiovascular disease, and health expenditure later in life (5). Timing of MetS onset thus could have important health implications for women with PCOS. Understanding the epidemiology of MetS among women with PCOS is crucial for the management of this common endocrine disorder.
Although the literature has documented a substantially higher prevalence of MetS in women with PCOS, several limitations exist. First, studies have largely been conducted among clinical populations (6–9), yet up to 69% of women with PCOS are undiagnosed (10). Furthermore, because a majority of studies are cross-sectional, an understanding of how the incidence and timing of onset of MetS may differ between women with and without PCOS is lacking, particularly in nonclinical populations. Moreover, population-based studies, particularly longitudinal studies, do not generally include data documenting a diagnosis of PCOS prospectively, making it exceedingly difficult to associate with other conditions using the accepted diagnostic criteria. This study aimed to address these limitations by comparing the age at onset of MetS (and its components) between women with and without PCOS-associated characteristics in a population-based, prospective cohort study.
Methods
Study population
The Michigan Bone Health and Metabolism Study (MBHMS) is a longitudinal cohort study of women’s health across reproductive life and the menopausal transition. The full cohort includes 664 women, of whom 543 were recruited in 1988 from among the female offspring of the Tecumseh Community Health Study participants (11), and 121 were recruited in 1992 from a community listing of residents from Tecumseh, Michigan (12). All women are white and were 24 to 50 years old in 1992/1993. Fourteen follow-up visits were conducted between 1992 and 2009 on an approximately annual basis. Data for the characterization of MetS began at follow-up visit 2 in 1993. The 34 women who dropped out of the study prior to visit 2 and 113 women for whom information necessary to classify PCOS-like status was lacking were excluded. In addition, 21 women were excluded because they did not have information for body mass index (BMI). The analytic sample thus consisted of 496 women. MBHMS was approved by the University of Michigan Institutional Review Board. All MBHMS participants provided informed consent at each study visit.
PCOS-like status
At each visit, participants reported their reproductive history and provided blood samples for measurement of testosterone, sex-hormone binding globulin (SHBG), and antimüllerian hormone (AMH), a biochemical proxy for PCOM (13). The testosterone and SHBG assays were described previously (14, 15). The AMH of 94.6% of blood samples was measured using the Beckman Coulter AMH Gen II A73818 assay (Beckman Coulter Diagnostics, Brea, CA). The lower limit of detection of this assay was 0.08 ng/mL. The intra-assay coefficient of variation (CV) was 5.1% (2.99 ng/mL) and 1.7% (9.59 ng/mL); the interassay CV was 6.1% (2.99 ng/mL) and 5.4% (9.59 ng/mL). The AMH of the remaining 5.4% of blood samples was measured using the DSL-10-14400 assay (Diagnostics Systems Laboratory, Webster, TX). This assay had a minimum detectable concentration of 0.02 ng/mL. The interassay CV was 8.0% (0.15 ng/mL), 4.8% (0.85 ng/mL), and 6.7% (4.28 ng/mL). The intra-assay CV was 4.6% (0.14 ng/mL), 2.4% (0.84 ng/mL), and 3.3% (4.41 ng/mL). AMH values from DSL-10-14400 were calibrated to those from Beckman Coulter AMH Gen II A73818 using the equation: Beckman Coulter AMH Gen II A73818 = 0.036 + 2.13 × DSL-10-14400. This equation had an R2 of 0.82 and was based on data from 124 blood samples that were measured by both assays.
PCOS-like cases, designated as PCOS proxy (PCOSp), were identified by longitudinally examining the menstrual history, free androgen index [FAI = (100 × total testosterone (ng/dL)]/ [SHBG (nM) × 28.84] and AMH values of all women. Analogous to the Rotterdam criteria, participants were classified as PCOSp if they met any two of the following three criteria: (i) having a history of irregular menstrual cycles not explained by pregnancy, lactation, menopause, surgeries, cancer, exogenous hormone use, or chemotherapies; (ii) having consistent biochemical evidence for hyperandrogenism (FAI ≥4.5 at 2 or more visits); and (iii) having consistently high AMH (AMH ≥7 ng/mL at two or more visits).
A history of irregular menstrual cycles was defined either by a participant’s affirmative answer to the question, “Are you having irregular menstrual cycles now?” in 1988 or ever reporting missing three or more cycles in the past 12 months at follow-up visits. The number of missed cycles, age (especially relative to the age at final menstrual period), self-reported reproductive/menopausal status, and medical history were then reviewed for all visits to rule out other explanations for irregular/missed cycles. Because there are no established cut-points for either FAI or AMH, high FAI and high AMH were defined based upon each biomarker’s distribution (85th and 90th percentiles, respectively). In addition, we designated a group of women who ever had an AMH ≥10 ng/mL (97th percentile = 10.2 ng/mL) as being PCOSp. Although AMH is not currently used to diagnose PCOS, such high levels of AMH suggest PCOS-like status, especially given that 10 ng/mL is substantially higher than AMH cut-points previously shown to have 70% to 97% specificity in PCOS diagnosis (16).
Based upon the above criteria, 61 women were identified as PCOSp and an additional 3 women were identified as probable PCOSp in the entire MBHMS cohort. The women with probable PCOSp met at least one of the above criteria and had a number of high AMH and/or FAI near the criteria values but were deemed probable because they did not fully meet a second criterion. Because six women with PCOSp did not have information for BMI, analyses were based upon 58 PCOSp women (55 confirmed and 3 probable). Sensitivity analyses excluding the three women with probable PCOSp were conducted.
Metabolic syndrome
Glucose, triglycerides, and high-density lipoprotein cholesterol
Glucose was measured using an automated hexokinase method. Triglycerides were measured using a colorimetric, enzymatic method on an Eastman Kodak analyzer (Model: E700, Eastman Kodak Company, Rochester, NY) at visit 2 [described previously in Sowers and Sigler (17)]. At visits 3 to 12, the Alfa-Wasserman angiotensin-converting enzyme triglyceride assay was used. This assay had intra-assay and interassay CVs of less than 2% across a wide range of triglyceride levels. At visits 13 to 16, triglycerides were measured using reagents No. 3034658 from Roche Diagnostics (Roche Diagnostics U.S., Indianapolis, IN) on a Cobas Mira Plus (Roche) chemistry analyzer. The interassay CV was 3.4% (109 mg/dL) and 3.1% (171 mg/dL). The assay for high-density lipoprotein cholesterol (HDL-C) at visit 2 was described previously (17). At visits 3 to 12, HDL-C was measured using an angiotensin-converting enzyme assay. This assay had intra-assay and interassay CVs of less than 5% across a range of HDL-C levels. At visits 13 to 16, HDL-C was measured using the HDL Direct reagent (No. 3034569) from Roche Diagnostics on a Cobras Mira chemistry analyzer from Roche. Interassay CV was 5.2% and 3.6% at 20 mg/dL and 67 mg/dL, respectively.
Definition of MetS
MetS status was based upon the Adult Treatment Panel III guidelines (18), which define MetS as the presence of any three of the following components: waist circumference ≥88 cm; triglycerides ≥150 mg/dL; HDL-C <50 mg/dL; systolic blood pressure ≥130 mm Hg, diastolic blood pressure ≥85 mm Hg or current use of blood pressure medications; and fasting glucose ≥110 mg/dL, self-reported doctor’s diagnosis of diabetes, or use of diabetes medications. Importantly, given that metformin is a first-line medication for PCOS treatment, we reviewed the self-reported indications for women who reported metformin use, but did not have elevated fasting glucose or a diabetes diagnosis. Except for one woman who reported using metformin for weight loss, all of these women reported using metformin to treat diabetes. Therefore, all such women, except for the one who used metformin for weight loss, were deemed to have diabetes. We treated the age at which a participant was first determined as having MetS as the age at MetS onset.
Covariates
Covariates included years of education, smoking status (never, former, and current), relative ranking of physical activity level, and BMI. BMI was calculated as weight, measured in kilograms using a calibrated balance-beam scale, divided by the square of height (meters). All covariates were collected at baseline, except BMI. For BMI, we calculated the mean BMI between age 38 and age 54 (38–54); this window represents the median age at baseline (38 years) and the median age at MetS onset (54 years). 38–54 more accurately reflects the long-term weight status of women during this midlife age window of rapid MetS onset. Physical activity was originally measured in metabolic equivalents (METS), calculated based on the frequency and intensity of physical activities reported in annual questionnaires (19, 20). As changes to the physical activity questionnaire occurred across follow-up visits, the METS scores at each visit were ranked and converted to normal scores using the Blom method (21). These normal scores represented an individual’s physical activity level relative to all participants at a given visit.
Statistical methods
Descriptive statistics, including medians and interquartile ranges for continuous variables and proportions for categorical variables, were calculated by PCOSp status. Differences between women with and without PCOSp were tested using the Wilcoxon rank-sum test (continuous variables) or a χ2 test (categorical variables).
Accelerated failure time model
The primary outcome of interest was the age at onset of MetS. We evaluated the development of MetS using a survival analysis framework, in which participants were at risk for MetS since birth and until MetS development. The age at MetS onset thus represented the survival time. If a participant had MetS at baseline, her survival time was left-censored, that is, she developed MetS at an age younger than her baseline age. If a participant developed MetS during follow-up, her survival time was equal to her age at MetS onset. Finally, if a participant did not develop MetS during follow-up, her survival time was right-censored.
Similar to estimates from multiple linear regression, the effect measure for PCOSp is interpreted as the mean difference in log (age at onset) between women with and without PCOSp, holding covariates constant. To facilitate interpretation of the mean difference in log (age at onset), we reported the mean percent difference in the age at onset, which was approximated by (exp (β1) − 1) × 100%.
Predicted age at onset, risk, risk difference, and risk ratio
To facilitate interpretation of the AFT models further, we reported the predicted median ages at onset of MetS for two hypothetical groups of women who shared the same covariate profile (set to be non-smoking with mean levels of education and physical activity at visit 2 and 38–54), one with and the other without PCOSp. Using the survival function associated with the AFT model and assuming a closed cohort with no competing risks, we calculated the predicted risk between age 40 and 50 for each of these two groups. The risk difference and risk ratio between women with and without PCOSp were calculated based on the predicted risks. The standard errors of risk, risk difference, and risk ratio were estimated by bootstrapping (resampling data 1000 times). To understand how the risk of MetS associated with PCOSp might vary with obesity and smoking, we repeated the same analyses for hypothetical groups of women whose 38–54 was set at the 25th (24 kg/m2) and 75th (32.09 kg/m2) percentiles, respectively, and whose smoking status was set to be “never” and “current,” respectively.
We used the same statistical method to compare the age at onset of each MetS component by PCOSp status. Statistical analyses were performed in SAS 9.3 (SAS, Cary, NC) and R version 3.3.1 [R Foundation for Statistical Computing, Vienna, Austria; package used: survival (2.39-4)].
Sensitivity analyses
We conducted two sensitivity analyses to examine the robustness of our findings. The first sensitivity analysis excluded the three women with probable PCOSp from the PCOSp case group and treated them as “not PCOSp.” The second sensitivity analysis dropped HDL-C data from visit 2, visit 3, and visits 13 to 16 because a different HDL-C assay was used during these study visits.
Exploratory analyses
We tested potential effect modification by BMI on the association between PCOSp and the onset of MetS and its components by adding an interaction term between 38–54 and PCOSp in AFT models. Furthermore, because of the heterogeneity of PCOS and the many different criteria a woman could meet to be classified as PCOSp in this study, we compared the cardiometabolic characteristics and age at MetS (and its components) onset across women who met different criteria of PCOSp, classified into the following four groups: group 1: extreme AMH (i.e., AMH ever ≥10 ng/mL); group 2: high FAI + high AMH; group 3: high FAI + irregular cycles; group 4: high FAI + irregular cycles + high AMH.
Results
Among the 496 women in the analytic sample, 58 (11.7%) had PCOSp. At baseline, women in the analytic sample had a median age of 38.6 years; 26.4% (n = 131) of all women were obese and 15.3% (n = 76) already had MetS. Compared with women without PCOSp, women with PCOSp were statistically significantly younger, had higher AMH and FAI levels, and were more likely to be obese (Table 1). Cardiometabolic biomarkers at baseline did not differ by PCOSp status and the baseline prevalence of MetS was only slightly higher among women with PCOSp (19.0% vs 14.8%). Over a mean follow-up of 11 years (range, 9.5 months to 16 years), the incidence of MetS was 36.5% (95% CI: 0.32, 0.41) among women without PCOSp and 42.6% (95% CI: 0.28, 0.57) among women with PCOSp. The overall distribution of MetS status (prevalent, incident, never) did not differ significantly by PCOSp status (P = 0.52).
Baseline Population Characteristics and Distribution of MetS Status
| Not PCOSpa (n = 438) Median (Q1, Q3) | PCOSp (n = 58) Median (Q1, Q3) | Pb | |
|---|---|---|---|
| Age, y | 39.2 (35.5, 42.5) | 35.6 (31.9, 38) | <0.0001 |
| BMI at baseline, kg/m2 | 25.6 (22.3, 29.6) | 27.5 (22.4, 31.3) | 0.20 |
| Mean BMI between 38 and 54 y, kg/m2 | 27.4 (23.9, 31.6) | 29.3 (24.7, 35.1) | 0.04 |
| Years of education | 13 (12, 15) | 14 (12, 16) | 0.19 |
| Physical activity score | −0.02 (−0.66, 0.65) | 0.16 (−0.67, 0.77) | 0.41 |
| AMH, ng/mL | 1.68 (0.72, 3.36) | 8.47 (6.36, 10.76) | <0.0001 |
| Testosterone, ng/dL | 20.5 (13.6, 28.6) | 27.7 (17.2, 41.6) | 0.0006 |
| SHBG, nM | 38.0 (25.0, 56.0) | 34.0 (14.0, 52.0) | 0.10 |
| FAI | 1.88 (1, 3.41) | 3.46 (1.89, 5.96) | <0.0001 |
| Waist circumference, cm | 77 (70, 86) | 81 (73, 91.75) | 0.098 |
| Systolic blood pressure, mm Hg | 114 (106, 122) | 116 (107.5, 126) | 0.40 |
| Diastolic blood pressure, mm Hg | 72 (68, 80) | 72 (68, 80) | 0.62 |
| Fasting glucose, mg/dL | 84 (80, 90) | 83 (76.3, 91.8) | 0.42 |
| Triglycerides, mg/dL | 92 (68, 134) | 89.5 (62.5, 151.8) | 0.56 |
| HDL-C, mg/dL | 49 (42, 58) | 49 (42, 57.8) | 0.65 |
| n (%) | n (%) | ||
| Obesity (BMI ≥ 30 kg/m2) | 107 (24.4%) | 24 (41.4%) | 0.010 |
| Smoking status | |||
| Never | 246 (56.2%) | 39 (67.2%) | 0.20 |
| Former | 100 (22.8%) | 12 (20.7%) | |
| Current | 92 (21%) | 7 (12.1%) | |
| MetS | |||
| Prevalent at baseline | 65 (14.8%) | 11 (19%) | 0.52 |
| Incident | 136 (31.1%) | 20 (34.5%) | |
| Never during follow- up | 237 (54.1%) | 27 (46.6%) |
All data came from baseline unless otherwise noted. Baseline was defined as the first visit at which a participant’s MetS status was known. The baseline for 460 (93%) participants was visit 2 (1993/1994). The baseline of the remaining participants was visit 3 (n = 17), visit 4 (n = 2), visit 7 (n = 12), visit 8 (n = 3), and visit 10 (n = 2).
Not all subjects had data in all measures shown in Table 1. Among women without PCOSp, n missing was 2, 67, 1, 1, 1, 7, 12, 2, 1, and 5 for physical activity, AMH, testosterone, SHBG, FAI, systolic blood pressure, diastolic blood pressure, glucose, triglycerides and HDL-C, respectively. Among women with PCOSp, n missing was 4, 2, and 3 for AMH, systolic blood pressure, and diastolic blood pressure, respectively.
P values were obtained from Wilcoxon rank-sum tests for continuous variables and from χ2 tests for categorical variables.
In unadjusted models, women with PCOSp developed MetS at an age 13% (point estimate: −13.0; 95% CI: −21.5, −3.5) younger than women without PCOSp (P = 0.0082) (Table 2). The difference in age at onset persisted after adjustment for smoking, education, and physical activity (P = 0.0027, Table 2). After further adjustment for 38–54, the age at onset difference by PCOSp status was reduced to −5.4% (95% CI: −12.4, 2.1; P = 0.16).
Percent Difference in the Age at Onset of MetS
| Percent Difference ($) in Age at MetS Onset (95% CI) | |||
|---|---|---|---|
| Not PCOSp | PCOSp | P | |
| Model 1a | ref | −13.0 (−21.5, −3.5) | 0.0082 |
| Model 2b,c | ref | −14.4 (−22.7, −5.2) | 0.0027 |
| Model 3c,d | ref | −5.4 (−12.4, 2.1) | 0.16 |
| Percent Difference ($) in Age at MetS Onset (95% CI) | |||
|---|---|---|---|
| Not PCOSp | PCOSp | P | |
| Model 1a | ref | −13.0 (−21.5, −3.5) | 0.0082 |
| Model 2b,c | ref | −14.4 (−22.7, −5.2) | 0.0027 |
| Model 3c,d | ref | −5.4 (−12.4, 2.1) | 0.16 |
Model 1: PCOSp only.
Model 2: Model 1 + smoking, education, physical activity.
Two subjects whose physical activity was missing were excluded from Models 2 and 3.
Model 3: Model 2 + 38–54 + 38–54 squared.
Table 3 shows how percent difference in age at onset translates to absolute difference in age at onset and risk difference for women with a typical covariate profile as well as women with combinations of obesity and smoking status. In unadjusted analysis (model 1), the 13.0% difference corresponds to 7.1 years earlier onset of MetS, or 38% higher risk of MetS between age 40 and 50 (risk ratio = 1.38, 95% CI 1.08, 1.69), among women with PCOSp. In the fully adjusted model (model 3) for women with a mean covariate profile, the 5.4% difference translates to 2.8 years earlier onset of MetS, or 21% higher risk of MetS between age 40 and 50 (risk ratio = 1.21, 95% CI 0.91, 1.51). In other words, based upon the fully adjusted model and assuming that both groups were nonsmokers with 14 years of education, mean level of physical activity, and a mean BMI of 29 kg/m2 between age 38 and 54, MetS occurred 2.8 years earlier among women with PCOSp compared with women without PCOSp. The risk of MetS onset from age 40 to 50 associated with PCOSp did not vary by obesity and smoking status.
Median Age at MetS Onset and Relative Risk as Predicted by Models 1 and 3 in Table 2
| Predicted Median Age at Onset
(95% CI) | Predicted Risk from Age 40 to 50
(95% CI) | Predicted Risk Ratio from Age 40 to 50
(95% CI) | Predicted Risk Difference (in Percentage Points) from Age 40 to 50
(95% CI) | |||||||
|---|---|---|---|---|---|---|---|---|---|---|
| Not PCOSp | PCOSp | Not PCOSp | PCOSp | Not PCOSp | PCOSp | Not PCOSp | PCOSp | |||
| For all women, regardless of covariates: | ||||||||||
| Model 1a | 54.5 (52.5, 56.7) | 47.4 (43.0, 52.3) | 0.27 (0.23, 0.31) | 0.37 (0.29, 0.46) | ref | 1.38 (1.08, 1.69) | ref | 10.3 (2.3, 18.3) | ||
| For women with a mean covariate profilec: | ||||||||||
| Model 3b | 51.5 (49.5, 53.5) | 48.7 (45.1, 52.6) | 0.37 (0.30, 0.43) | 0.44 (0.33, 0.56) | ref | 1.21 (0.91, 1.51) | ref | 7.7 (−3.1, 18.4) | ||
| For women with specified combinations of BMI and smoking status, adjusted for education and physical activityd: | ||||||||||
| 38–54 | Smoking | |||||||||
| Model 3 | Normal | Never | 65.1 (61.7, 68.9) | 61.5 (56.4, 67.2) | 0.10 (0.07, 0.14) | 0.15 (0.07, 0.23) | ref | 1.46 (0.70, 2.22) | ref | 4.8 (−2.4, 12) |
| Normal | Current | 63.5 (59.1, 68.2) | 60.1 (54.1, 66.7) | 0.12 (0.07, 0.18) | 0.18 (0.07, 0.28) | ref | 1.43 (0.74, 2.12) | ref | 5.3 (−2.8, 13.3) | |
| Obese | Never | 45.7 (43.9, 47.6) | 43.3 (40.1, 46.7) | 0.53 (0.45, 0.6) | 0.60 (0.48, 0.72) | ref | 1.13 (0.95, 1.32) | ref | 7.1 (−2.6, 16.7) | |
| Obese | Current | 44.7(42.1, 47.4) | 42.2 (38.6, 46.3) | 0.56 (0.46, 0.66) | 0.63 (0.49, 0.76) | ref | 1.12 (0.95, 1.29) | ref | 6.8 (−2.4, 16) | |
Bold: P value < 0.05.
Model 1: PCOSp only.
Model 3: Model 1 + smoking, education, physical activity, 38–54 and 38-54 squared.
Mean covariate profile: covariates were set to be “non-smoker” with mean Visit 2 (1993/1994) level of education (14 years), physical activity (0) and 38–54 (29 kg/m2) for all women.
For “Normal BMI,” 38–54 was set at the 25th percentile (24 kg/m2). For obese, 38–54 was set at the 75th percentile (32.09 kg/m2). Education and physical activity were both set at the mean levels.
As for MetS components, both groups of women were similar in terms of the distribution of MetS component categories (prevalent, incident, never) over the course of the study. In unadjusted analyses, women with PCOSp developed impaired fasting glucose/diabetes mellitus(IFG/DM), large waist circumference, elevated blood pressure, and high triglycerides at younger ages than women without PCOSp [ranging from −13.4% (95% CI: −20.6, −5.6) for large waist circumference to −10.0% (95% CI: −18.0, −1.2) for high triglycerides] (Table 4). Full adjustment for covariates attenuated these differences and a statistically significant difference was observed for large waist circumference only [−7.2% (95% CI: −11.9, −2.4), P = 0.0038]. We did not find statistically significant differences in the age at low HDL-C onset regardless of covariate adjustment.
Percent Difference (95% CI) in Age at Onset of Each MetSComponent
| Model 1a | Model 2b | Model 3c | |||||||
|---|---|---|---|---|---|---|---|---|---|
| Not PCOSp | PCOSp | P | Not PCOSp | PCOSp | P | Not PCOSp | PCOSp | P | |
| Impaired fasting glucose/Diabetes | ref | −10.9 (−18.5, −2.6) | 0.011 | ref | −11.1 (−18.6, −2.9) | 0.0093 | ref | −6.3 (−14.1, 2.2) | 0.14 |
| Large waist circumference | ref | −13.4 (−20.6, −5.6) | 0.0010 | ref | −14.5 (−21.5, −7.0) | 0.0003 | ref | −7.2 (−11.9, −2.4) | 0.0038 |
| Elevated blood pressure | ref | −10.6 (−18.0, −2.5) | 0.01 | ref | −11.1 (−18.5, −3.1) | 0.0078 | ref | −6.3 (−13.6, 1.6) | 0.12 |
| High triglycerides | ref | −10.0 (−18.0, −1.2) | 0.027 | ref | −11.1 (−18.9, −2.5) | 0.012 | ref | −7.3 (−15.1, 1.2) | 0.089 |
| Low HDL-C | ref | −15.9 (−34.4, 7.9) | 0.17 | ref | −19.4 (−36.4, 2.1) | 0.074 | ref | −8.6 (−26.5, 13.7) | 0.42 |
Model 1: PCOSp only.
Model 2: Model 1 + smoking, education, physical activity.
Model 3: Model 2 + 38–54 (quadratic for large waist circumference, high triglycerides, and low HDL-C; linear for the other components).
In sensitivity analyses, recoding the three women who were “probable PCOSp” to “not PCOSp” slightly strengthened the association between PCOSp and age at MetS onset [percent difference in fully adjusted model: −6.0% (95% CI: −13.1, 1.7), P = 0.13]. Dropping HDL-C data from visit 2, visit 3 and visits 13 to 16 slightly attenuated the association between PCOSp and age at MetS onset [percent difference in fully adjusted model: −4.6% (95% CI: −10.9, 2.2), P = 0.18]. This attenuation was caused by substantial changes to the identified age at MetS onset for one woman with PCOSp (a 7-year later estimated age at onset).
In exploratory analyses, we found striking differences in baseline metabolic profiles across women classified as having PCOSp by the different PCOSp criteria (Fig. 1). Women who were classified as PCOSp by having all of high FAI, irregular cycles, and high AMH had the worst metabolic profile, whereas women who were classified as having PCOSp only by having an AMH >10 ng/mL were relatively healthy. In fully adjusted models comparing the ages at onset between women who met different criteria of PCOSp and women without PCOSp, women characterized by high FAI, irregular cycles, and high AMH consistently developed MetS and its components at a younger age than women without PCOSp. In contrast, women who were PCOSp only by having an AMH >10 ng/mL were similar to women without PCOSp, except for a borderline significantly younger age at onset of elevated blood pressure (Fig. 2). There was no statistically significant interaction between BMI and PCOSp on the age at onset of MetS or its components, except for some evidence that women with PCOSp and a higher BMI had an even younger age at onset of IFG/DM than women with PCOSp but a lower BMI [main effects of PCOSp: βPCOSp= −0.021 (P = 0.69); main effects of 38–54: βBMI = −0.015 (P < 0.0001); interaction term between PCOSp and 38–54: βinteraction = −0.012 (P = 0.06)].
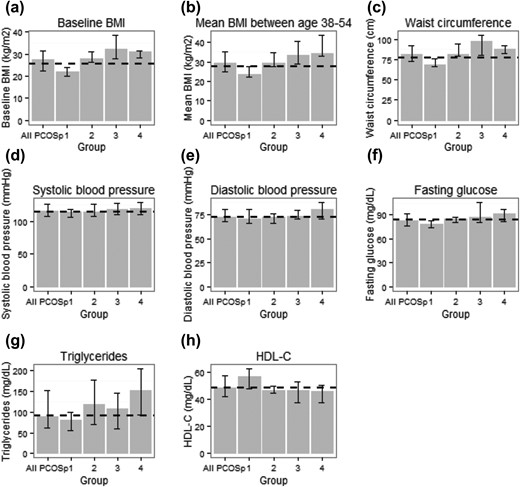
(a–h) Baseline metabolic profiles of women with different PCOS features. The metabolic profile of all women with PCOSp are also presented as a reference. The features of PCOS within each group were: group 1 (n = 21): extreme AMH; group 2 (n = 10): high FAI + high AMH; group 3 (n = 16): high FAI + irregular cycles; group 4 (n = 10): high FAI + irregular cycles + high AMH. One PCOSp woman characterized by irregular cycles and high AMH was excluded from this analysis. For each group, the median (Q1, Q3) of each metabolic measure was reported. Dashed line indicates the median of a metabolic measure in women without PCOSp.
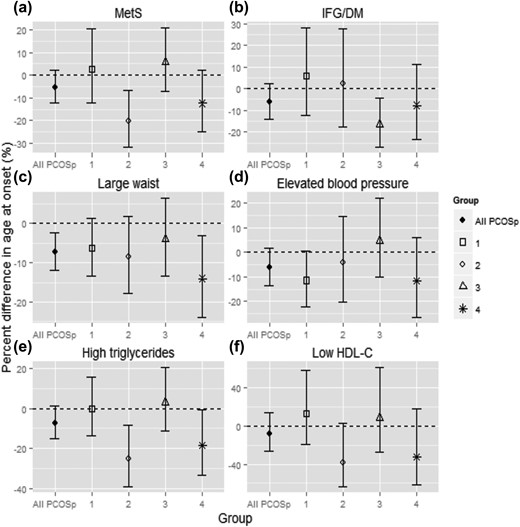
(a–f) Percent difference in the age at onset of MetS and its components, women with different PCOS features vs women without PCOSp. All models were fully adjusted. A more negative number indicates earlier onset compared with women without PCOSp. The data for all women with PCOSp are also presented as a reference. Features of PCOS within group 1 (n = 21): extreme AMH; group 2 (n = 10): high FAI + high AMH; group 3 (n = 16): high FAI + irregular cycles; group 4 (n = 10): high FAI + irregular cycles + high AMH. One PCOSp woman characterized by irregular cycles and high AMH was excluded from this analysis.
Discussion
To our knowledge, this is the first study to examine age at MetS incidence by PCOS-like status (PCOS proxy or PCOSp) in a community-based sample. In this population-based, prospective cohort study, we found that women with PCOSp may develop MetS earlier than women without PCOSp. Our model predicted a 5.4% difference in the age at MetS onset between women with and without PCOSp. Given that a typical woman without PCOSp in MBHMS developed MetS at age 51.5, this difference corresponds to 2.8 years earlier onset for comparable women with PCOSp. Overall, despite the small number of PCOSp cases and a lack of statistical significance, the absolute difference in the age at onset is not unimportant, suggesting a probable, elevated risk of earlier onset of MetS among women with PCOS compared with women without PCOS. We also observed an earlier age at onset for a majority of the MetS components in women with PCOSp compared with women without PCOSp, although these differences were attenuated after adjustment for covariates, leaving large waist circumference the only component where women with PCOSp had a significantly younger age at onset.
Previous studies were mostly cross-sectional. Studies conducted among clinical populations reported 50% to 2000% higher odds of prevalent MetS among women with PCOS (3, 7–9), whereas those conducted in population-based samples found comparable prevalence of MetS by PCOS status after adjusting for body size (22–24). Furthermore, a pair of population-based studies (25, 26) found that midlife women with a history of oligomenorrhea and hyperandrogenemia, who presumably had PCOS, had significantly higher odds of having MetS at baseline, but did not have a significantly higher hazard of developing MetS over the next 12 years of follow-up compared with those with neither condition. Our prospective results are not directly comparable to results from cross-sectional studies, but our primary finding—that women with PCOSp may develop MetS earlier—is consistent with a higher prevalence of MetS among women with PCOS. Although Polotsky et al. (26) did not report a statistically significant difference in the rate of MetS onset between women with and without presumed PCOS, the magnitude of the increased hazard (hazard risk = 1.40) among women with presumed PCOS was relatively high. In fact, if women with PCOS develop MetS earlier in life, as our data suggest, we would expect an increased prevalence of MetS among women with PCOS at certain ages, but not necessarily a faster rate of MetS onset thereafter, as the Polotsky studies found. Although the difference between women with and without PCOSp was modest, the finding of an earlier onset of MetS in the women with PCOSp adds support to the thinking that PCOS is an independent risk factor for the development of cardiovascular disease. Whereas numerous intermediate markers of cardiovascular risk are increased in women with PCOS, the relation between PCOS and actual cardiovascular events remains unclear (27). Earlier onset of MetS suggests that earlier screening of women with PCOS for intermediate markers of cardiovascular disease may facilitate earlier intervention to decrease or delay the incidence of expected cardiac events.
Considering the large odds ratios reported in a majority of previous studies, the difference in age at MetS onset we found is relatively small. Unlike studies that recruited PCOS patients from clinics, we identified women with PCOSp from a community-based sample. Recent research has shown that compared with women with PCOS in the community, PCOS patients in clinics are heavier and more likely to experience the full spectrum of PCOS symptoms (i.e., ovulatory dysfunction, hyperandrogenism, and polycystic ovarian morphologic features) (28). Because both obesity and hyperandrogenism are associated with higher metabolic risk in women with PCOS (29, 30), the difference in MetS prevalence previously reported in clinical populations may be larger than the true difference in nonclinical populations. By using a community-based sample, we likely included a broader spectrum of women with PCOS, leading to a smaller, but more representative, estimate of the difference between women with and without PCOS.
As expected, in our analysis adjusting for BMI attenuated the differences between women with and without PCOSp. Mean BMI between age 38 and 54 not only captured the long-term weight status of women during a period of rapid MetS onset, it also better reflected the BMI difference between women with and without PCOSp than baseline BMI because age at baseline varied greatly across women. Adjusting for baseline BMI would have led to residual confounding. This is perhaps why a meta-analysis on PCOS and MetS (3), which matched women with and without PCOS by BMI but ignored the age at which BMI was measured, reported a large difference in the odds of prevalent MetS by PCOS as opposed to our relatively modest finding.
Similar to MetS, the differences between women with and without PCOSp in the age at onset of MetS components were modest and statistically insignificant, except for large waist circumference. Accumulation of visceral fat is strongly associated with insulin resistance, metabolic dysfunction, and subsequent cardiovascular disease. A significantly earlier attainment of large waist circumference among women with PCOSp, even after adjusting for overall body size, suggests women with PCOS may enter a state of elevated metabolic risk at a younger age than women without PCOS, increasing the likelihood of future clinical diseases. Our analysis also suggests likely earlier onset of IFG/DM , increased blood pressure, and elevated triglycerides among women with PCOS. Obese women with PCOS have been found to develop diabetes at a higher rate (31); future prospective, population-based studies with adequate power are needed to confirm whether women with PCOS also develop elevated blood pressure and triglycerides faster than women without PCOS.
Finally, we observed that women characterized by high FAI, irregular cycles, and high AMH had the worst metabolic profile and consistently developed MetS and its components at a younger age, whereas women characterized by extremely high AMH alone had similar metabolic risk to women without PCOSp, with the exception of elevated blood pressure. This observation partially supports previous studies that found hyperandrogenism was associated with worse metabolic health in women with PCOS (30, 32). It may also suggest that women with extremely high AMH alone are a heterogenous group that may not all have PCOS. However, given the small sample sizes for these subgroups in our analyses, future studies are needed to evaluate whether women with different PCOS features differ in terms of MetS risk and how hyperandrogenism may contribute to this difference.
This study used elevated serum levels of AMH as a proxy for PCOM, diagnosis of which requires a relatively invasive and costly procedure rarely performed in most population-based studies, particularly longitudinal studies. Produced primarily by primary, secondary, and early antral ovarian follicles, AMH levels correlate with antral follicle counts used to determine PCOM and thus are a biochemical measure that approximates the categorization of women by PCOS status utilizing the Rotterdam criteria. However, until AMH is validated and accepted as a serum proxy for PCOM, a diagnosis of PCOS by the accepted criteria cannot be assigned to women who have not had a morphologic assessment, necessitating an alternative categorization here designated PCOS proxy (PCOSp). Because PCOS is a primarily clinical diagnosis that is rarely documented in most population-based studies, the assessment of AMH either prospectively or in stored serum samples provides a quantitative modality to more precisely categorize women with PCOSp and permit assessment for associations with terminal outcomes. It is intriguing that the women characterized by high FAI, irregular cycles, and high AMH, arguably most likely manifesting all three Rotterdam criteria, consistently developed MetS and its components at a younger age, supporting this approach as a practical application for clinical studies.
This study has several strengths. Its prospective, population-based design directly addressed two major limitations in prior cross-sectional studies. In addition, we used more than 20 years of detailed serial information on menstrual characteristics, AMH, and FAI to identify women with PCOSp, minimizing the possibility of misclassification. Nevertheless, given the lack of a clinical diagnosis and a standard cut-point of AMH to diagnose PCOS, we acknowledge that our diagnostic criteria could only identify women with PCOS-like characteristics, particularly for women classified as PCOSp based solely on having a high AMH level. However, for these women, we used a conservatively high AMH cutoff that exceeded levels (4.2 to 8.4 ng/mL) that have been shown to have 70% to 97% specificity in PCOS diagnosis (16). The two AMH cutoffs (7 ng/mL and 10 ng/mL) were also high regardless of age (33). Thus, we expect our classification to be highly specific. Misclassification of PCOSp is expected to be nondifferential with respect to MetS onset. This would have attenuated the association between PCOSp and MetS, suggesting an even greater difference in the age at MetS onset than reported. Similarly, even though we did not consider the effects of oral contraceptive/hormone therapy use on FAI, these exogeneous hormones would have increased SHBG and decreased testosterone, meaning our FAI criterium also had high specificity. Because high FAI was associated with greater metabolic risks, misclassification because of FAI would have led to underestimation of the association between PCOSp and MetS. Other limitations include potential residual confounding, small sample size, and racial/ethnic homogeneity. MBHMS recruited only white participants, but the prevalence of both PCOS and MetS vary considerably by race/ethnicity (34, 35). A recent study (9) found that young black women with PCOS had a more adverse cardiovascular profile and a higher prevalence of MetS compared with young white women with PCOS. How this early racial/ethnic disparity among women with PCOS may translate to differences in MetS onset during midlife and beyond requires further investigation.
Conclusion
Using prospective, population-based data, we found that women with PCOS-like status may develop MetS at a younger age. Early screening, weight loss, and other interventions to treat components of MetS in women with PCOS, particularly obese women with PCOS, may be warranted.
Abbreviations:
- AFT
accelerated failure time
- AMH
antimüllerian hormone
- CV
coefficient of variation
- DM
diabetes mellitus
- FAI
free androgen index
- IFG
impaired fasting glucose
- MetS
metabolic syndrome
- METS
metabolic equivalents
- PCOM
polycystic ovarian morphology
- PCOS
polycystic ovary syndrome
- SHBG
sex-hormone binding globulin
Acknowledgments
The authors acknowledge the contributions of Mary Crutchfield for MBHMS data collection and of Bharathi Ramachandran for assistance with the literature review. The authors also acknowledge the participation of the women in the Michigan Bone Health and Metabolism Study.
FinancialSupport: The Michigan Bone Health and Metabolism Study was funded by the National Institute of Arthritis and Musculoskeletal and Skin Diseases (R01-AR-40888 and R01-AR051384). Assay kits for the measurement of antimüllerian hormone in the Michigan Bone Health and Metabolism Study were provided at no charge by Beckman Coulter.
Disclosure Summary: The authors have nothing to disclose.
