


Abstract
BRAFV600E mutant thyroid cancers are often refractory to radioiodine (RAI).
To investigate the utility and molecular underpinnings of enhancing lesional iodide uptake with the BRAF inhibitor vemurafenib in patients with RAI-refractory (RAIR).
This was a pilot trial that enrolled from June 2014 to January 2016.
Academic cancer center.
Patients with RAIR, BRAF mutant thyroid cancer.
Patients underwent thyrotropin-stimulated iodine-124 (124I) positron emission tomography scans before and after ~4 weeks of vemurafenib. Those with increased RAI concentration exceeding a predefined lesional dosimetry threshold (124I responders) were treated with iodine-131 (131I). Response was evaluated with imaging and serum thyroglobulin. Three patients underwent research biopsies to evaluate the impact of vemurafenib on mitogen-activated protein kinase (MAPK) signaling and thyroid differentiation.
The proportion of patients in whom vemurafenib increased RAI incorporation to warrant 131I.
Twelve BRAF mutant patients were enrolled; 10 were evaluable. Four patients were 124I responders on vemurafenib and treated with 131I, resulting in tumor regressions at 6 months. Analysis of research tumor biopsies demonstrated that vemurafenib inhibition of the MAPK pathway was associated with increased thyroid gene expression and RAI uptake. The mean pretreatment serum thyroglobulin value was higher among 124I responders than among nonresponders (30.6 vs 1.0 ng/mL; P = 0.0048).
Vemurafenib restores RAI uptake and efficacy in a subset of BRAF mutant RAIR patients, probably by upregulating thyroid-specific gene expression via MAPK pathway inhibition. Higher baseline thyroglobulin values among responders suggest that tumor differentiation status may be a predictor of vemurafenib benefit.
Radioiodine-refractory (RAIR) thyroid cancers lose the ability to efficiently concentrate iodide, rendering RAI [iodine-131 (131I] ineffective. Although the tyrosine kinase inhibitors (TKIs) sorafenib and lenvatinib are standard treatments for patients with RAIR thyroid cancer (1–4), a limitation of these therapies is the need for continuous dosing and the accompanying drug toxicities (1, 4, 5).
A strategy to restore the capacity of RAIR tumors to trap and respond to a single administration of 131I (redifferentiation) without maintenance drug therapy could replace or defer the need for TKIs. Approximately 70% of papillary thyroid cancers possess mutually exclusive oncogenic mutations of genes encoding effectors of the mitogen-activated protein kinase (MAPK) pathway (6), the most common of which is BRAFV600E (∼60%) (7). Constitutive MAPK pathway activation promotes RAI refractoriness by suppressing the expression of genes that mediate iodide uptake and thyroid hormone biosynthesis [e.g., Na+/I− symporter (NIS), thyroid peroxidase (TPO), and thyroglobulin (TG)] (8–14). We previously demonstrated in genetically engineered mouse models of BRAF mutant thyroid cancer that MAPK pathway inhibition restores the expression of these genes to increase tumor RAI avidity (15, 16). We translated these findings into a clinical trial in which iodine-124 (124I) positron emission tomography (PET) CT lesional dosimetry demonstrated that the MEK 1/2 allosteric inhibitor selumetinib (AstraZeneca) could restore RAI efficacy in a subset of RAIR patients (17). The degree of benefit observed depended on the mutation present; whereas all five NRAS mutant patients benefited, only one of nine BRAF mutant patients achieved sufficient RAI tumor incorporation to justify 131I.
We hypothesized that improving outcomes in the BRAF mutant group would require more potent MAPK pathway inhibition. Vemurafenib is an ATP-competitive BRAF inhibitor that abrogates monomeric BRAFV600E signaling and paradoxically activates BRAF wild-type dimers in normal cells (18), resulting in a wide therapeutic window for robust MAPK inhibition in tumor cells. Notably, a pilot trial did report that a subset of BRAF mutant patients can develop new RAI enhancement in metastatic lesions with the BRAF inhibitor dabrafenib (Novartis) (19). We conducted a clinical trial to evaluate how effectively vemurafenib can mediate the clinical and molecular redifferentiation of BRAF mutant RAIR thyroid cancers. The insights from this trial not previously addressed in previous studies include the differential contribution of drug-induced regression vs increase in 131I efficacy, quantitative measurements of RAI-enhanced incorporation with 124I PET scans, investigation of the transcriptomic changes associated with BRAF inhibitor–mediated redifferentiation in serial research biopsies, and evidence that baseline TG level could be a predictor of benefit for this therapeutic approach.
Materials and Methods
Patient population
This was a single-center, 10-patient pilot study. The trial was approved by the Institutional Review Board at Memorial Sloan-Kettering Cancer Center. Subjects provided written informed consent. Eligible patients were required to have a thyroid carcinoma of follicular cell origin with a BRAF mutation at V600 detected in a Clinical Laboratory Improvement Amendments–certified or US Food and Drug Administration–approved assay. Patients with anaplastic and Hurthle cell cancers were excluded. One of the following criteria for RAI-refractory disease had to be met: a metastatic lesion lacking RAI avidity on a diagnostic scan performed ≤2 years before enrollment, an RAI-avid metastatic lesion that remained stable in size or progressed despite RAI therapy ≥6 months before study entry, or at least one 18F-fluorodeoxyglucose (FDG)-avid lesion with a maximum standardized uptake value (SUVmax) ≥5 (given the inverse relationship between FDG and RAI avidity) (20). Patients were not allowed treatment with 131I <6 months before study treatment or radiation, chemotherapy, or targeted therapy <4 weeks before. Two research biopsies were mandatory, except for patients with inaccessible tumors or those for whom a biopsy was deemed too risky (e.g., a platelet count <100,000/μL).
Study design
Figure 1 illustrates the study schema. Baseline RAI avidity was assessed with 124I PET/CT lesional dosimetry while patients were on a low-iodine diet (initiated 5 days before) (21). Patients were given 0.9 mg thyrotropin alfa (Thyrogen, Sanofi Genzyme) by intramuscular injection for 2 consecutive days, followed by 6 mCi (range: 4.8 to 7.2 mCi) of 124I (IBA Molecular, later Zevacor and now Sofie Biosciences) on the third day. PET/CT scan images were obtained on day 5. Patients then initiated vemurafenib 960 mg orally twice daily for ~4 weeks. During the fourth week of therapy, the 124I PET/CT lesional dosimetry was repeated. If at least one index tumor (≥5 mm in maximal diameter) was predicted to absorb ≥2000 cGy with a clinically administered 131I activity of ≤300 mCi, then the patient was categorized as an 124I responder. These patients continued vemurafenib and underwent Thyrogen-stimulated whole-body and blood dosimetry to determine the maximum tolerable activity (MTA) (the predicted maximal 131I activity that could be administered without bone marrow or pulmonary toxicity) (22–24). A therapeutic 131I activity under or at the MTA was then administered with Thyrogen stimulation (25). Vemurafenib was discontinued 2 days after 131I. Patients for whom the second 124I PET/CT did not show sufficient iodide uptake were designated 124I nonresponders and removed. Among 124I responders, imaging was performed after ~4 weeks of vemurafenib alone, and then 3 and 6 months after 131I.
![Study schema. After a baseline Thyrogen-stimulated 124I PET scan, patients were treated with ~4 wk of vemurafenib (960 mg orally twice daily), and then re-evaluated with a second 124I PET scan. If an index tumor met the lesional dosimetry criteria [≥2000 cGy achieved with ≤300 mCi of 131I (124I responder)], patients were continued on vemurafenib and treated with 131I. Vemurafenib was discontinued (D/C) 2 d after 131I. Efficacy was measured with imaging at baseline, after vemurafenib alone, and ~3 mo and 6 mo after 131I. In three patients, two research biopsies were performed before treatment and then 10 to 11 d on vemurafenib.](https://oup.silverchair-cdn.com/oup/backfile/Content_public/Journal/jcem/104/5/10.1210_jc.2018-01478/1/m_jc.2018-01478f1.jpeg?Expires=1750212221&Signature=KKaR6RyLObjz5sWZWV6vHCfwJ-Kq0gkmeDh9i7kQkPFfXWetNZRTPmTQ7ohZIzn8PCjTRhIz6Ka1i~TWlZ1ehp2IkM~8FD7qMj-HPhsJIpEfOtgBmqVe7-g1nw9ZITxrMcGE5UoF2mWGIbby3-o8LGnsdC88~H58YiwujWj6wVw04UuOm2ER8e3WFBpby-kY7D7PPcNjdWWhC9a4KKMgPfUeavJvdJfKA7c3GqwBVgGd1cXK4p3~urSWOxKUPmH~e3t4VPlFo2iK~RnO5-q7Ocv1w5rAwHrfJmq3WAsHs0TDMqVQ56o8Xc3ajBnbYpBe9CpaZJh2T1S6SpNxpVN5-g__&Key-Pair-Id=APKAIE5G5CRDK6RD3PGA)
Study schema. After a baseline Thyrogen-stimulated 124I PET scan, patients were treated with ~4 wk of vemurafenib (960 mg orally twice daily), and then re-evaluated with a second 124I PET scan. If an index tumor met the lesional dosimetry criteria [≥2000 cGy achieved with ≤300 mCi of 131I (124I responder)], patients were continued on vemurafenib and treated with 131I. Vemurafenib was discontinued (D/C) 2 d after 131I. Efficacy was measured with imaging at baseline, after vemurafenib alone, and ~3 mo and 6 mo after 131I. In three patients, two research biopsies were performed before treatment and then 10 to 11 d on vemurafenib.
For 124I nonresponders, scans were performed within 1.5 months of vemurafenib discontinuation. Serum TG levels were measured before treatment, after vemurafenib, and 1, 3, and 6 months after 131I. On 2 March 2015, the TG assay changed from the Brahms GmBH (ThermoFisher; used for patients 1 to 6) to the chemiluminescent assay on the Beckman Access (used for patients 6 to 12). The Brahms GmBH assay is a recovery assay that was developed before the international standardization of TG. The standard used was half the value of the international standard. Therefore, all TG values obtained on the Beckman Access assay that uses the international standard are reported here at one-half the calculated value to make them comparable to those obtained with the Brahms GmBH assay.
Molecular studies
Biopsies were performed before and during treatment (10 to 11 days of vemurafenib) on the same tumor in three patients for RNA sequencing (RNAseq). For RNA extraction, frozen tissue was homogenized in Trizol and RNA was extracted with chloroform. Isopropanol and linear acrylamide were added, and the RNA was precipitated with 75% ethanol. Samples were resuspended in RNase-free water. After RiboGreen quantification and quality control by Agilent BioAnalyzer, 0.59-1μg of total RNA with an RNA integrity number varying from 7.1 to 8.6 underwent ribosomal depletion and library preparation using the TruSeq Stranded Total RNA LT Kit (Illumina catalog # RS-122-1202) according to instructions provided by the manufacturer with 6 cycles of PCR. Samples were barcoded and run on a HiSeq 2500 in a 50 bp/50 bp paired end run, using the TruSeq SBS Kit v4 (Illumina). On average, 89 million paired reads were generated per sample and 25% of the data mapped to the transcriptome. Reads were aligned [Spliced Transcripts Alignment to a Reference (STAR)] and normalized (reads per kilobase per million) with Partek® Flow (Partek). The MAPK output gene set contained the 52 genes described by Pratilas et al. (26) and used by The Cancer Genome Atlas (TCGA) (7) to measure the transcriptional output of the MAPK pathway (Table 1). The BRAF/RAS score (BRS) gene set contained the 71 genes identified by TCGA (7) to distinguish BRAFV600E papillary thyroid carcinomas (PTCs) from those expressing oncogenic RAS mutations (Table 1). The thyroid differentiation score (TDS) gene list consisted of the 16 genes used by the TCGA (7) (Table 1). The enhanced thyroid differentiation score (eTDS) positive [eTDS(+)] and negative [eTDS(−)] scores consisted of the top 29 genes positively and 19 genes negatively associated with the TDS in the TCGA BRAFV600E cohort, respectively (Table 1). Also included in the eTDS were the top 10 mRNAs that positively and negatively associated with TDS over the entire TCGA cohort (all the positively correlated genes and six negatively correlated genes were also identified as part of the TCGA BRAFV600E cohort TDS analysis noted above). We expanded the eTDS(−) gene set to include four additional genes (SERPINA1, ELF3, EPHB3, and ATIC). The calculated MAPK output, BRAF/RAS, and TDS scores are the average fold change for all mRNAs in the gene set compared with the median of all research tissue samples. The expression changes for the eTDS gene set were scored with the following formula:
Gene Lists for BRAF-RAS, MAPK Output, TDS, and eTDS Scores
| BRAF-RAS Score | MAPK Output | TDS | eTDS(+) | eTDS(−) | ||
|---|---|---|---|---|---|---|
| ABTB2 | LGI3 | ARID5A | KIR3DL2 | DIO1 | BCL2 | ATIC |
| AHR | LLGL1 | B4GALT6 | LIF | DIO2 | CDH16 | BTG3 |
| ANKLE2 | LY6E | BRIX1 | MAFF | DUOX1 | CLCNKB | CBX3 |
| ANKRD46 | MDFIC | BYSL | MAP2K3 | DUOX2 | DLG2 | ELF3 |
| ANXA1 | MET | CCND1 | MYC | FOXE1 | DPP6 | EPHB3 |
| ANXA2P2 | MLEC | CD3EAP | NOP16 | GLIS3 | FAM167A | FN1 |
| ARNTL | NQO1 | CHSY1 | PHLDA2 | NKX2-1 | FHL1 | GALE |
| ASAP2 | PDE5A | CXCL8 | PLK3 | PAX8 | FLRT1 | ITGA3 |
| BID | PDLIM4 | DDX21 | POLR1C | SLC26A4 | GPM6A | KCNK1 |
| CDC42EP1 | PLCD3 | DUSP4 | POLR3G | SLC5A5 | GRIN2C | KCNN4 |
| COL8A2 | PLEKHA6 | DUSP6 | PPAN | SLC5A8 | HGD | MAPKAPK3 |
| CREB5 | PNPLA5 | EGR1 | PPAT | TG | KIT | PDLIM4 |
| CTSC | PPL | ELOVL6 | PYCRL | THRA | LMOD1 | PHF23 |
| CYB561 | PRICKLE1 | ETV1 | RRS1 | THRB | LOC286002 | PLP2 |
| CYP1B1 | PROS1 | ETV4 | SEMA6A | TPO | LRP2 | PRSS22 |
| DCSTAMP | PTPRE | ETV5 | SH2B3 | TSHR | MATN2 | PVRL4 |
| DTX4 | PVRL4 | FOS | SLC1A5 | MPPED2 | SERPINA1 | |
| DUSP5 | RASGEF1B | FOSL1 | SLC4A7 | MT1G | TMEM41A | |
| ETHE1 | RUNX1 | GEMIN4 | SPRED2 | PKHD1L1 | UBE2I | |
| EVA1A | RUNX2 | GNL3 | SPRY2 | PLA2R1 | ||
| FAM20C | SDC4 | GPR3 | SPRY4 | SLC26A7 | ||
| FCHO1 | SEL1L3 | GTF2A1L | TNC | SLC4A4 | ||
| FLJ23867 | SFTPB | GTPBP4 | TNFRSF12A | SORBS2 | ||
| FN1 | SFTPC | HMGA2 | TSR1 | STXBP5L | ||
| FSTL3 | SLC35F2 | HYDIN | WDR3 | TFCP2L1 | ||
| GABRB2 | SLC4A4 | IER3 | YRDC | TFF3 | ||
| GBP2 | SORBS2 | TPPP | ||||
| GNA14 | SOX4 | WSCD2 | ||||
| HGD | SPOCK2 | ZMAT4 | ||||
| ITGA3 | STK17B | |||||
| ITGB8 | SYT12 | |||||
| KATNAL2 | TACSTD2 | |||||
| KCNAB1 | TBC1D2 | |||||
| KCNIP3 | TGFBR1 | |||||
| KCNN4 | TMEM43 | |||||
| LAMB3 | ||||||
Statistical analysis
The primary endpoint was the proportion of patients with BRAF mutant RAIR thyroid cancer for whom vemurafenib increased iodide incorporation to a predicted lesional absorbed dose of 2000 cGy if ≤300 mCi of 131I was administered (124I responder). Assuming the true response rate with this approach is <5%, the probability of seeing two or more responses in 10 untreated patients is <10%. Therefore, two or more responses were considered indicative of a response rate being >5% at a 0.1 significance level. Patients who were removed from study before the second 124I PET were considered unevaluable and replaced. All 124I SUVmax values reported here were calculated with volume correction. Secondary endpoints included best overall response and progression-free survival [per Response Evaluation Criteria in Solid Tumors (RECIST) version 1.1] 6 months after 131I, quantification of serial TGs, and assessment of vemurafenib safety and tolerability. The Wilcoxon rank-sum test was applied for the comparison between serum TG values in the 124I responder and nonresponder groups. Toxicity with vemurafenib alone or in combination with 131I was assessed as per Common Terminology Criteria for Adverse Events version 4.0 from the start of vemurafenib until 30 days after the last dose of the drug.
Results
Baseline characteristics
Between June 2014 and January 2016, 12 BRAFV600E mutant patients were enrolled. The clinical characteristics of all enrolled patients are included in Table 2. All patients had received at least one RAI treatment. One patient was previously treated with a TKI (sorafenib). All 12 had RAI nonavid lesions on the baseline 124I PET/CT: eight lacked detectable 124I in all tumors, and four had modest 124I uptake in at least one tumor site (Table 3).
Demographic, Clinical, and Pathologic Characteristics of the 12 Enrolled Patients
| Patient/Tumor Characteristic | No. (%) |
|---|---|
| Age, y | |
| Median | 68 |
| Range | 43–72 |
| Sex | |
| Male | 7 |
| Female | 5 |
| Tumor histology, no./total no. (%) | |
| Classic papillary | 2/12 (17) |
| Tall-cell variant papillary | 5/12 (42) |
| Columnar cell papillary | 2/12 (17) |
| Poorly differentiated carcinoma | 3/12 (25) |
| Tumor genotype, no./total no. (%) | |
| BRAF V600E | 12/12 (100) |
| Prior radioiodine treatments per patient, no. | |
| Median | 1 |
| Range | 1–3 |
| Other treatments for thyroid cancer, no. of patients/total no. (%) | |
| External-beam radiation therapy | 5/12 (42) |
| Doxorubicin (concurrently with radiation therapy) | 2/12 (17) |
| Vascular endothelial growth factor receptor–targeted TKI | 1/12 (8) |
Summary of Study Outcomes for the 12 Enrolled Patients
| Patient No. | Thyroid Pathology | Metastatic Disease Sites | Lifetime RAI (mCi) Received Before Study (No. Given) | 124I Avidity at Baseline | Tumor Size Change With Vem Alone | Increased RAI Avidity With Vem? (Yes/No) | Received 131I? (Yes/No) | 131I Administered/MTA (mCi) (% MTA Administered) | RECIST version 1.1 Response 6 mo After 131I |
|---|---|---|---|---|---|---|---|---|---|
| 1 | PDTC (1° TCV) | L | 275 (2) | None | −27% | No | No | — | — |
| 2 | CC | B, L, NL | 265 (1) | None | −27% | Yes | Yes | 241/309 (78%) | PR (−53%) |
| 3 | TCV | L, NL, TB | 80 (1) | None | — | — | — | — | — |
| 4 | C | B, L | 75 (1) | None | +3% | No | No | — | — |
| 5 | PDTC (1° TCV) | HL, L, ML | 301 (2) | +HL, ML | — | — | — | — | — |
| 6 | TCV | ML, NL, TB | 201 (2) | +TB | −3% | Yes | Yes | 241/510 (47%) | SD (−10%) |
| 7 | PDTC (with TCF) | L, LV, HL, ML, TB | 667 (3) | None | −10% | Yes | Yes | 130/248 (52%) | SD (−5%) |
| 8 | CC | L, NL, TBa | 75 (1) | +TBa | −31% | Nob | No | — | — |
| 9 | C (with TCF) | HL, L, ML, NL | 101 (1) | None | −19% | Yes | No | — | — |
| 10 | TCV | L, NL | 163 (1) | None | — | No | No | — | — |
| 11 | TCV | HL, L, ML | 200 (1) | None | −60% | Yes | Yes | 401/433 (93%) | PR (−75%) |
| 12 | TCV | L, TBa | 196 (1) | +TB,a L | — | Yes | No | — | — |
| Totals | 6/10 | 4/10 | — | 2 PR, 2 SD |
“Totals” row summarizes the observed results among the 10 patients evaluable for the primary endpoint (patients 3 and 5 were removed before the second 124I PET evaluation and were not evaluable).
Abbreviations: B, bone; C, classic type; CC, columnar cell; HL, hilar lymph node; L, lung; LV, liver; ML, mediastinal lymph node; NL, neck lymph node; PDTC, poorly differentiated carcinoma; TB, thyroid bed; TCF, tall-cell features; TCV, tall-cell variant; Vem, vemurafenib. Underscore denotes sites of disease discovered only on 124I PET.
124I avidity visualized in the thyroid bed did not have a structural correlate visualized on CT.
Increased 124I avidity was visualized in the thyroid bed, but this was not counted as increased RAI avidity given the lack of visualized structural correlate on CT.
Efficacy
The protocol schema is depicted in Fig. 1. Two patients were removed before the second 124I PET/CT and were evaluable only for safety and tolerability: one for grade 3 palmar-plantar erythrodysesthesia (patient 3) and the other for dysphagia precluding continued drug treatment (patient 5). The remaining 10 patients underwent a second 124I PET/CT scan. For six (60%) patients, the second 124I PET revealed new or increased RAI avidity with vemurafenib in at least one tumor (Table 3). The degree of lesional RAI incorporation achieved among these patients was heterogeneous, including seven lesions demonstrating dramatic enhancement, with SUVmax values >50 (Fig. 2). Four (40%; 95% CI, 12% to 74%) patients met the lesional dosimetry threshold for 131I treatment (124I responders). The four 124I responders were treated with 131I and vemurafenib (Table 3). Tumor histologies for these patients included columnar cell PTC (1), poorly differentiated thyroid carcinoma with tall-cell features (1), and tall-cell variant PTC (2). The six 124I nonresponders discontinued vemurafenib and were removed from the study.
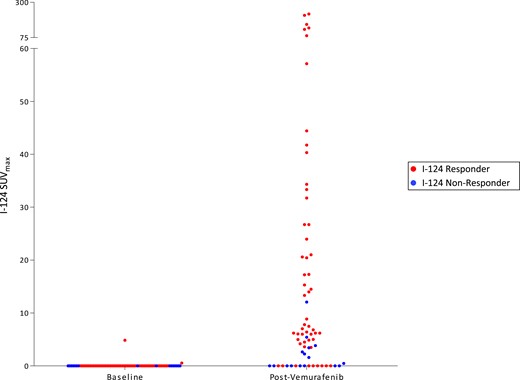
Lesional 124I SUVmax values in patients with vemurafenib-mediated RAI enhancement. Baseline and on therapy 124I SUVmax values among the six patients with vemurafenib-induced enhancement of tumor RAI avidity are shown. Each data point represents one tumor before and after vemurafenib therapy. 124I responders (red) are patients 2, 6, 7, and 11; 124I nonresponders (blue) are patients 9 and 12.
Eight of the 10 evaluable patients underwent radiographic assessments within ~6 weeks of completing vemurafenib (for the 124I responders, scans were done before 131I). Vemurafenib alone resulted in tumor regression for seven patients, including all four 124I responders (−3% to −60%) and three of the four nonresponders (+3% to −31%) [Fig. 3(a)]. Three of the four 124I responders experienced further tumor regression after 131I [Fig. 3(b)], which was associated with lower serum thyroglobulin values than baseline [Fig. 3(c)]. Six months after 131I, all four patients remained free of progression, with two confirmed partial responses (PRs; −53% and −75%) and two with stable disease (SD; −10% and −5%). In comparison, three 124I nonresponders who did not receive 131I continued to get serial imaging off protocol, which demonstrated tumor growth after vemurafenib was discontinued.
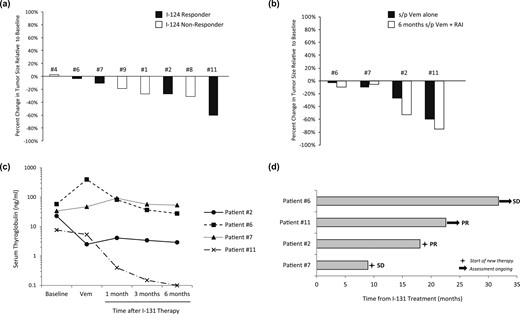
Efficacy of vemurafenib alone and in combination with 131I. (a) Changes in tumor size after vemurafenib alone. Eight of the 10 evaluable study patients (four 124I responders and four nonresponders) underwent imaging after ~4 wk of vemurafenib alone. Each bar represents the percentage change in tumor size relative to baseline observed. (b) Changes in tumor size observed among 124I responders after vemurafenib alone and ~6 mo after 131I, relative to baseline. (c) Serum thyroglobulin values measured in 124I responders. Serum thyroglobulins were measured at baseline, after vemurafenib alone, and 1 mo, 3 mos, and 6 mo after 131I. Patient 6 had detectable TG antibodies. (d) Outcomes of 124I responders. Each bar represents the time each 124I responder remained off therapy after vemurafenib plus 131I. Two patients continued to remain off therapy as of 1 November 2017. s/p, status post; Vem, vemurafenib.
All four 124I responders were followed beyond the protocol-mandated 6 months after 131I [Fig. 3(d)]. Two received additional treatment after the protocol: patient 7 (SD) underwent radiation for a pretracheal mass ~9 months after 131I, and patient 2 (PR) was observed for ~18 months after 131I before restarting treatment with vemurafenib (for 19+ months as of 1 November 2017). Patients 6 and 11 remained off therapy 31+ and 22+ months after 131I, respectively (as of 1 November 2017). Patient 11 has maintained an −85% regression of the RECIST right hilar lymph node target for >19 months after 131I (decreased from 20 mm to 3 mm with a TSH-suppressed TG of <0.1 ng/mL, 21 months after 131I). Although these parameters met criteria for complete response, this was designated clinically PR, given punctate pulmonary nodules of uncertain significance.
Safety
The most common vemurafenib toxicities observed included maculopapular rash (nine); fatigue (eight); palmar-plantar erythrodysesthesia (seven); nausea (six); arthralgia, increased bilirubin, or elevated alkaline phosphatase (five each); and alanine aminotransferase increase, diarrhea, benign neoplasm (warts), or alopecia (three each) (Table 4). Two patients had vemurafenib transiently held before completing therapy: one had a 17-day interruption for an unrelated adverse event before restarting on full dose, and the other held drug for ~4 days for grade 3 rash before restarting at 720 mg twice daily.
Vemurafenib-Related Adverse Events, All Grades
| Toxicity | Grade 1 | Grade 2 | Grade 3 | Grade 4 | Grade 5 | Total |
|---|---|---|---|---|---|---|
| Maculopapular rash | 5 | 2 | 2 | 9 | ||
| Fatigue | 8 | 8 | ||||
| Palmar-plantar erythrodysesthesia syndrome | 3 | 3 | 1 | 7 | ||
| Nausea | 6 | 6 | ||||
| Alkaline phosphatase increased | 5 | 5 | ||||
| Arthralgia | 5 | 5 | ||||
| Bilirubin increased | 4 | 1 | 5 | |||
| Alanine aminotransferase increased | 3 | 3 | ||||
| Diarrhea | 3 | 3 | ||||
| Neoplasm, benign (warts) | 1 | 2 | 3 | |||
| Alopecia | 3 | 3 | ||||
| Skin and subcutaneous tissue disordersa | 2 | 2 | ||||
| Creatinine increased | 2 | 2 | ||||
| Aspartate aminotransferase increased | 2 | 2 | ||||
| Myalgia | 2 | 2 | ||||
| Dysgeusia | 2 | 2 | ||||
| Pruritus | 1 | 1 | 2 | |||
| Anemia | 1 | 1 | ||||
| Constipation | 1 | 1 | ||||
| Cough | 1 | 1 | ||||
| Dry skin | 1 | 1 | ||||
| Hypocalcemia | 1 | 1 | ||||
| Hypophosphatemia | 1 | 1 | ||||
| Dehydration | 1 | 1 | ||||
| Dry mouth | 1 | 1 | ||||
| Eye disorders (other, specify) | 1 | 1 | ||||
| Headache | 1 | 1 | ||||
| Hoarseness | 1 | 1 | ||||
| Mucositis oral | 1 | 1 | ||||
| Oral pain | 1 | 1 | ||||
| Pain | 1 | 1 | ||||
| Skin hyperpigmentation | 1 | 1 | ||||
| Chest wall pain | 1 | 1 |
Seborrheic keratosis (1 case), keratosis pilaris-like reaction (1 case).
Analysis of clinical and molecular markers of tumor differentiation
We previously established in a BRAF mutant mouse model that inhibiting MAPK signaling increases RAI avidity by restoring expression of the thyroid differentiation genes responsible for iodide uptake (15, 16). To evaluate in patient tumors the biologic relationship of MAPK activity, thyroid differentiation, and RAI avidity, biopsies were performed before and during treatment (10 to 11 days on vemurafenib) in two 124I responders (patients 6 and 7) and one nonresponder (patient 9). RNAseq was performed to quantify transcripts regulated by the MAPK pathway (MAPK output), the BRS (a 71-gene signature that distinguishes BRAFV600E tumors from RAS mutant tumors) (7), and the eTDS (a gene signature of thyroid-specific differentiation developed from the TCGA TDS; see Table 1 for the gene lists of each signature and the Methods section for how the eTDS was developed from the TCGA TDS) (7). The two serial biopsies were performed on the same tumor for each patient, allowing correlation of drug-induced molecular changes with 124I dynamics evaluated by PET (Fig. 4). In all three patients, vemurafenib inhibited MAPK output and increased the BRS in the sampled tumors [Fig. 4(a)], consistent with a pharmacologic “reprogramming” of BRAF mutant expression signatures to those more similar to RAS mutant tumors, which have lower flux through the MAPK pathway (7). Concomitant with these signaling changes, vemurafenib increased the eTDS in all tumors [Fig. 4(a)]. The tumor from patient 6, with the highest eTDS on vemurafenib, also possessed the highest 124I uptake (SUVmax of 31.7) [Fig. 4(b)], consistent with the hypothesis that the degree of RAI avidity restored is linked to the extent to which drug therapy increases the expression of the thyroid-specific genes responsible for iodine uptake and retention (16).
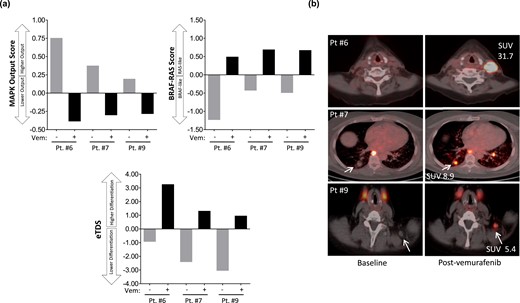
MAPK signaling, thyroid differentiation, and 124I avidity. Two serial biopsies were performed on the same tumor for each patient, allowing correlation of drug-induced molecular changes with 124I dynamics measured by PET/CT. (a) RNA was extracted from the two serial biopsies for RNAseq to quantify transcripts regulated by MAPK output, the BRS, and the eTDS. The MAPK output score, BRS, and eTDS values represent the average fold change for all mRNAs in the gene set compared with the median of all the samples. (b) Fused 124I PET/CT images of the serially sampled tumors analyzed in (a). Gray bars indicate scores calculated in tumors obtained before vemurafenib. Black bars indicate scores calculated from biopsies obtained from the same tumors after 10 to 11 d on vemurafenib. Vem, vemurafenib.
The TCGA analysis revealed that among BRAF mutant thyroid cancers there exists significant variability in the extent to which thyroid-specific gene expression is retained (7). The tumors molecularly profiled here also possessed notable differences in baseline eTDS [Fig. 4(a)], despite all initially having been RAI negative on 124I PET [Fig. 4(b)]. Because TG is encoded by a thyroid differentiation gene and is a major contributor to the eTDS, we hypothesized that pretreatment serum TG could serve as a quantifiable marker of differentiation. We found that the mean pretreatment serum TG value among 124I responders was significantly higher than those among nonresponders (mean: 30.6 vs 1.0 ng/mL; P = 0.0048) (Fig. 5). All nonresponders had TG values ≤2 ng/mL (range: <0.1 to 2.0 ng/mL), whereas responders had values >7 ng/mL (range: 7.7 to 58.0). This observation suggests that tumors with a higher degree of differentiation (higher serum TG) are better positioned to be successfully redifferentiated with vemurafenib therapy than less differentiated tumors at baseline.
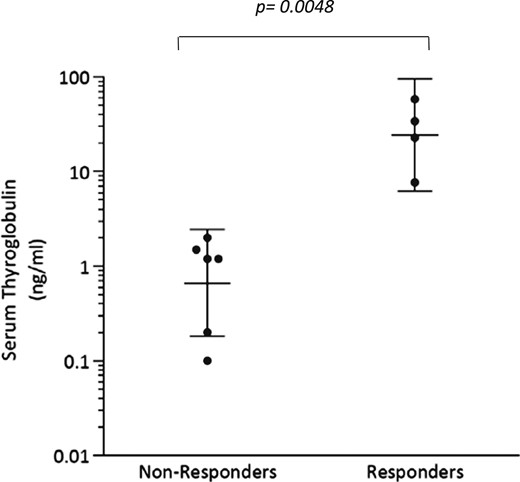
Baseline serum thyroglobulin values among the 124I nonresponders and responders. Patient 9 (nonresponder) had a TG value of <0.1 ng/mL, which is designated here as a value of 0.1 ng/mL. Patient 6 (responder) and 9 (nonresponder) had detectable TG antibodies. Bars indicate geometric means of the values with 95% CI.
Discussion
This study achieved the primary endpoint of demonstrating that vemurafenib increases iodide incorporation in RAIR BRAF mutant patients (six out of 10 with new RAI incorporation, four treated with 131I). These results are superior to those observed with the MEK inhibitor selumetinib (four out of nine with increased RAI; one received 131I) (17) and similar to data with the BRAF inhibitor dabrafenib (6 out of 10 patients with new or increased RAI) (27). Those treated with 131I experienced clinical benefit for >6 months after therapy, including one patient with near complete regression of the target lesion and an undetectable TSH-suppressed TG ~21 months after therapy. Disease control without the need for continuous drug administration and toxicity is the advantage of this redifferentiation approach over TKIs that currently constitute standard therapy for RAIR patients (1, 4, 28). Future trial designs will need novel study endpoints to capture the unique clinical benefits of this approach (e.g. proportion of patients for whom redifferentiation delays TKI initiation).
Beyond establishing that vemurafenib can increase RAI in BRAF mutant patients, this study investigated mechanistic questions of redifferentiation the previous selumetinib and dabrafenib trials did not address. Because response previously was assessed only after both drug and 131I were administered, neither trial delineated how much of the tumor regression achieved was attributable to the short course of drug alone vs 131I. This was a lesser consideration for selumetinib (17) because a separate phase II study determined that it possesses little single-agent activity in RAIR patients (29). For BRAF inhibitors, however, two trials have confirmed that vemurafenib and dabrafenib are both active agents against BRAF mutant RAIR disease (30, 31); vemurafenib is now a compendium-approved therapy for this indication (30). Not addressing how the direct antiproliferative activity of the drug contributed to study outcomes was raised as a confounding design element of the dabrafenib redifferentiation study (19, 32). With vemurafenib, we observed that seven of eight patients experienced tumor regression after 4 weeks of therapy, including all four of the patients who went on to receive 131I. 131I induced further tumor regression in three of those four patients, suggesting that the 6-month response outcomes largely represent the combined impact of vemurafenib directly on both tumor cell proliferation and redifferentiation. Importantly, three patients designated as 124I nonresponders also achieved regression with the 1-month course of vemurafenib [patients 8 (−31%), 1 (−27%), and 9 (−19%)], indicating that the reprogramming of cancer cell differentiation can be uncoupled from the growth-suppressive effects of MAPK blockade.
A critical aspect of this study was the use of investigational 124I PET/CT scans to quantify drug-induced changes in tumoral iodine incorporation, which predict the 131I radiation dosage that can be delivered to each individual tumor (lesional dosimetry) (33, 34). This provides an advantage over the traditional 131I whole body scintigraphy or 131I with single photon emission computed tomography/CT used in standard practice and the dabrafenib redifferentiation trial (27), methods that possess a more limited capacity for precisely quantifying RAI uptake in individual lesions. The 124I lesional dosimetry approach allowed us to identify two categories of 124I nonresponders: those whose tumors remained non-RAI avid on vemurafenib and those whose tumors achieved incremental RAI enhancement that was insufficient to justify treatment. Therefore, the failure to adequately redifferentiate with vemurafenib is not a singular entity and is probably modified by diverse biologic factors. Some tumors may harbor additional defects that render them irreversibly dedifferentiated, whereas others may be reprogrammable by targeting the appropriate signaling pathways. The lesion-to-lesion heterogeneity in RAI avidity within individual patients may reflect differential exposure to circulating RAI or vemurafenib, or more likely clonal biological differences between metastatic tumors. Lastly, the impact of vemurafenib on RAI uptake vs retention remains an unexplored yet important biologic question. Identifying what pathways in conjunction with MAPK activation may influence either or both of these parameters could lead to new pharmacologic approaches that could significantly increase RAI tumoral residence and efficacy.
Having observed that vemurafenib may restore the efficacy of 131I for a subset of patients, along with the previous phase II trial demonstrating single-agent vemurafenib activity against RAIR disease (30), we propose that biomarkers to delineate which of these uses of vemurafenib (continuously administered vs in combination with 131I) are best for an individual patient could be an important tool to personalize how BRAF inhibition is implemented. To this end, we observed that 124I responders had higher baseline serum TG values compared with nonresponders. Although TG is typically used in clinical practice as a marker of tumor burden, it is also an important biomarker of thyroid differentiation (7, 15), explaining why it may predict successful RAI enhancement with vemurafenib. Importantly, these statistically significant differences in TG values were quantified in RAIR patients whose tumors were generally RAI nonavid, suggesting the possibility that distinctions in tumor differentiation can be quantified beyond what can be inferred by RAI status alone. This initial observation certainly warrants further validation in a larger data set of BRAF mutant patients treated with redifferentiation strategies.
However, serum TG is influenced by TSH levels and interfering TG antibodies, making it an imperfect differentiation marker in some clinical contexts. Furthermore, because iodine incorporation requires the preserved function of a complex network of genes besides TG, we propose that molecular signatures may offer a more precise and comprehensive method for quantifying thyroid differentiation that may better predict the likelihood of response to RAI. This approach first requires clinical evidence of the long-assumed hypothesis that the RAI avidity of a tumor is indeed determined by the thyroid differentiation state, that is, the degree to which it expresses the genes that mediate iodide uptake and thyroid hormone biosynthesis (eg, NIS, TPO, and TG). The analysis of serial research biopsies in this trial provided the clinical construct needed to examine this hypothesis as quantitative changes in MAPK signaling and thyroid differentiation gene signatures were scored and compared with the changes in 124I PET uptake achieved within the same tumor.
As expected, we observed a direct link between the degree of molecular thyroid differentiation that was scored (eTDS) and the RAI avidity present in clinical specimens. Additionally, our data provide clinical evidence linking MAPK pathway inhibition with increased molecular differentiation (eTDS) in patients, consistent with the biologic hypothesis formulated in preclinical animal models that MAPK is a critical regulator of thyroid tumor differentiation (15, 16). However, inhibition of MAPK transcriptional output did not translate into sufficient redifferentiation in all the patients analyzed, suggesting either that more potent pathway inhibition may be needed or that biologic factors beyond MAPK inhibition may be critical. Ongoing clinical studies evaluating combinations with BRAF inhibitors to more effectively inhibit MAPK signaling should provide more insight into this question.
A clear limitation of these molecular studies is the small number of patients evaluated, primarily because of the challenge of obtaining multiple research biopsies from patients on therapy being evaluated with investigational 124I PET scans. The analysis here is certainly not conclusive, but it represents important clinical proof-of-concept observations that support biologic hypotheses that to date have been developed primarily in preclinical models. Efforts to more broadly study how these molecular scores correlate to RAI efficacy will not only validate these biologic models but also serve as a molecular classification of tumor differentiation that could influence clinical decision making for the standard use of RAI and the ways redifferentiation approaches are applied in the future.
Abbreviations:
- BRS
BRAF/RAS score
- eTDS
enhanced thyroid differentiation score
- FDG
18F-fluorodeoxyglucose
- MAPK
mitogen-activated protein kinase
- MTA
maximum tolerable activity
- NIS
Na+/I− symporter
- PET
positron emission tomography
- PR
partial response
- PTC
papillary thyroid carcinoma
- RAI
radioiodine
- RAIR
radioiodine refractory
- RECIST
Response Evaluation Criteria in Solid Tumors
- RNAseq
RNA sequencing
- SD
stable disease
- SUVmax
maximum standardized uptake value
- TCGA
The Cancer Genome Atlas
- TDS
thyroid differentiation score
- TG
thyroglobulin
- TKI
tyrosine kinase inhibitor
- TPO
thyroid peroxidase
Acknowledgments
The authors acknowledge the contributions of the Memorial Sloan-Kettering Cancer Center research staff from the medical oncology and nuclear medicine services that coordinated execution of this clinical trial.
Financial Support: This investigator-initiated trial was supported by Genentech (to L.A.D.). The study was also funded in part through the National Institutes of Health (NIH)/National Cancer Institute (NCI) Cancer Center Support Grant P30 CA008748, NIH/NCI R01 CA184724 (to A.L.H.), NIH/NCI 5 R01 CA201250 (to S.M.L.), and NIH/NCI SPORE in Thyroid Cancer Grant P50 CA172012 (to J.A.F.). Support was also provided by Geoffrey Beene Cancer Research Center and Cycle for Survival at Memorial Sloan-Kettering Cancer Center (to A.L.H.). The MSK Integrated Genomics Operation Core used here for the molecular analyses was funded by the NCI Cancer Center Support Grant (CCSG, P30 CA08748), Cycle for Survival, and the Marie-Josée and Henry R. Kravis Center for Molecular Oncology.
Clinical Trial Information: ClinicalTrials.gov no. NCT02145143 (registered 22 May 2014).
Disclosure Summary: A.L.H has served on advisory boards or performed consulting for Genentech, Sanofi Genzyme, Eisai, AstraZeneca, Regeneron, Merck, Sun Pharmaceuticals, Ayala Pharmaceuticals, Kura Oncology, Ignyta, TRM Oncology, and Novartis. S.S.B. is currently employed by Flatiron Health (Roche). R.M.T. has performed consulting for Sanofi Genzyme and Eisai. R.A.G. has performed consulting for Veracyte. J.A.F. has received research funding from Eisai. The remaining authors have nothing to disclose.
