


Abstract
The response to first-generation somatostatin receptor ligands (SRLs) treatment in acromegaly correlates with expression of somatostatin receptor subtype 2 (SSTR2). However, pasireotide shows the highest binding affinity for SSTR subtype 5 (SSTR5). It has been suggested that in acromegaly, SSTR5 expression is better at predicting the response to pasireotide long-acting release (PAS-LAR) treatment than SSTR2 expression.
To investigate in patients with active acromegaly whether response to SRL treatment correlates to PAS-LAR treatment and to what extent SSTR2 and SSTR5 expression are correlated to the response to PAS-LAR treatment.
We included 52 patients from a cohort that initially received SRL treatment, followed by SRL and pegvisomant combination treatment, and finally PAS-LAR treatment. The long-term response to PAS-LAR was evaluated using a PAS-LAR score. In 14 out of 52 patients, somatotroph adenoma tissue samples were available to evaluate SSTR2 and SSTR5 expression using a previously validated immunoreactivity score (IRS).
The percentage IGF-I (times the upper limit of normal) reduction, which was observed after SRL treatment, correlated with PAS-LAR response score during follow-up (r = 0.40; P = 0.003; n = 52). After exclusion of SRL-pretreated patients, SSTR2 IRS was positively correlated to PAS-LAR score (r = 0.58; P = 0.039; n = 9), whereas SSTR5 IRS showed no relation (r = 0.35; P = 0.36; n = 9).
In a cohort of patients partially responsive to SRLs, the IGF-I–lowering effects of PAS-LAR treatment correlated with the effect of SRL treatment and seemed to be mainly driven by SSTR2 expression instead of SSTR5.
Acromegaly is a severe systemic condition most commonly caused by a somatotroph adenoma that secretes excessive levels of GH and IGF-I, leading to increased mortality and morbidity (1). Treatment modalities that normalize GH and IGF-I levels restore normal life expectancy (2). This goal can be achieved pharmacologically by both inhibiting pituitary GH secretion and blocking peripheral GH action.
First-generation long-acting somatostatin receptor ligands (SRLs; octreotide and lanreotide) represent the cornerstone for medical treatment of acromegaly. The biochemical response to SRL treatment has been consistently shown to be positively correlated to somatostatin receptor subtype 2 (SSTR2) protein expression on the adenoma (3–7). These compounds inhibit pituitary GH secretion by preferential binding with high affinity to SSTR2. However, biochemical normalization of GH and IGF-I can only be achieved in ∼40% of patients. Therefore, the majority of patients are partially or even completely resistant to SRLs. An effective treatment option to normalize IGF-I levels in partially resistant patients is the addition of the GH receptor antagonist pegvisomant (PEGV) to SRLs. A recent study from our group showed that patients using SRLs and PEGV combination treatment had a lower SSTR2 expression at time of surgery compared with medically naive patients (8). The required PEGV dose to achieve IGF-I normalization was inversely correlated to SSTR2, but not to SSTR subtype 5 (SSTR5), expression (8).
Pasireotide long-acting release (PAS-LAR) is a novel multireceptor somatostatin analog, which binds with high affinity to all SSTR subtypes but SSTR subtype 4. In contrast to octreotide, pasireotide shows high subnanomolar affinity to SSTR5 (9). In vitro studies have shown that pasireotide modulates SSTR trafficking and phosphorylation in a distinct manner from octreotide (10, 11), inducing less SSTR2 internalization, phosphorylation, and β-arrestin recruitment than octreotide. In medically naive patients with acromegaly, PAS-LAR has demonstrated superior efficacy in reducing IGF-I levels over octreotide LAR, whereas the effect on GH reduction was superimposable (12). This latter observation was also recently confirmed in vitro (13). We recently reported the 24-week results of the Pasireotide LAR and Pegvisomant (PAPE) study (14). This prospective open-label conversion study assessed the efficacy and safety of PAS-LAR alone or in combination with PEGV in patients with acromegaly controlled with SRL and PEGV combination treatment (14). Switching to PAS-LAR resulted in a considerable PEGV dose reduction, but also a higher incidence of diabetes mellitus (14).
It is assumed that the efficacy of a given SRL is directly correlated to the SSTR subtype binding profile and the pattern of SSTR expression in the somatotroph adenoma (5, 6). However, although guidelines do not report specific recommendations so far, it is generally assumed that octreotide and lanreotide are more effective when SSTR2 is highly and predominantly expressed, whereas pasireotide is more effective when SSTR5 is the predominant subtype and SSTR2 is absent or poorly expressed (15). The aims of the current study were therefore: 1) to investigate whether the IGF-I response after SRL treatment correlates to the IGF-I response after PAS-LAR treatment; and 2) to investigate to what extent SSTR2 and SSTR5 immunoreactivity are correlated to responsiveness to PAS-LAR treatment in somatotroph adenomas.
Materials and Methods
Patients and somatotroph adenoma tissue selection
Data collection of patients with acromegaly was performed at the Erasmus MC Pituitary Center in Rotterdam, Netherlands. We initially started with a cohort of 61 patients with acromegaly who received PAS-LAR treatment during their participation in the PAPE study (Fig. 1) (14). All of these patients have previously been treated with SRLs, followed by SRL and PEGV combination therapy. Cabergoline was used in seven patients in combination with SRLs and in two patients during the PAPE study (14). After exclusion of patients who received postoperative radiotherapy (n = 7) and patients who received SRL treatment for <4 months (n = 2), 52 patients remained and were finally included in the study cohort. In total, 19 out of these 52 patients previously underwent neurosurgery. Reasons for surgery included adenomas with reasonable chance for cure, such as (intrasellar) microadenomas or macroadenomas with risk of visual impairment.
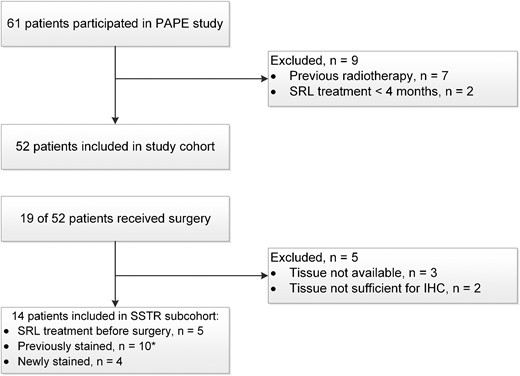
Flow chart of the selection procedure for the study cohort and the somatotroph adenoma tissue samples included in the SSTR subcohort. All patients eventually received SRL and PEGV combination treatment and were switched to PAS-LAR treatment during the PAPE study (14).
We selected only those patients with sufficient adenoma tissue available to perform immunohistochemistry (IHC). One patient underwent a second surgery during follow-up. For clarity, in this latter case, we analyzed only the tissue sample of the first surgery. From the 14 remaining somatotroph adenoma tissue samples included for IHC analysis (SSTR subcohort), 10 tissue samples have been stained previously (8), whereas 4 cases were newly stained (Fig. 1). We retrospectively collected data on medical history and clinical response to first-generation SRLs. Prospective data on the PEGV dose and IGF-I levels were used from the PAPE study (14). The PAPE study was registered with ClinicalTrials.gov, number NCT02668172. All patients were included after written informed consent.
Outcomes
Response to SRL treatment was defined as IGF-I times the age-adjusted upper limit of normal (IGF-I × ULN) and as the percentage of IGF-I suppression after at least 4 months of SRL treatment. In patients who underwent surgery, postoperative IGF-I levels after at least 3 months were considered. Response to PAS-LAR during the PAPE study was divided into short-term and long-term response. Short-term treatment response was defined as IGF-I levels (× ULN) at 24 weeks (i.e., after three injections of PAS-LAR 60 mg). During the extension phase from 24 until 48 weeks, both the PAS-LAR dose and PEGV dose were titrated according to a protocol to achieve IGF-I levels within the normal range. Therefore, the long-term response to PAS-LAR was based on a composite “PAS-LAR treatment response score” (PAS-LAR score) to fully capture the effect of PAS-LAR taking into account PEGV dose reduction, discontinuation, and eventually PAS-LAR dose reduction. The PAS-LAR score comprised five categories representing the difference in PEGV dose and PAS-LAR dose at week 48 vs baseline (week number 0): 0 is PEGV dose reduction 0% to 33% (in combination with PAS-LAR 60 mg), 1 is PEGV dose reduction 33% to 66% (plus PAS-LAR 60 mg), 2 is PEGV dose reduction 66% to 100% (plus PAS-LAR 60 mg), 3 is PEGV treatment discontinued and PAS-LAR dose reduced to 40 mg, and 4 is PEGV treatment discontinued and PAS-LAR dose reduced to 20 mg every 4 weeks. A 100% PEGV dose reduction corresponds to PAS-LAR 60-mg monotherapy. A higher PAS-LAR score corresponds to a better response to PAS-LAR treatment.
IGF-I assays
Total IGF-I serum concentrations during the PAPE study were measured by the immunometric IDS-iSYS assay [Immunodiagnostic Systems Limited, Boldon, United Kingdom; intra-assay coefficient of variation (CV) 8.1% and interassay CV 2.1%] (16). Total IGF-I serum concentrations before and after SRL treatment were measured using different assays: Immulite 2000 assay, a solid-phase, validated enzyme-labeled chemiluminescent immunometric assay (DPC Biermann GmbH/Siemens, Fernwald, Germany; intra-assay variability of 2% to 5% and interassay variability of 3% to 7%), the immunometric IDS-iSYS assay (Immunodiagnostic Systems Limited; intra-assay CV 8.1% and interassay CV 2.1%), and two different RIAs (Diagnostic Systems Laboratories, Webster, TX; intra-assay CV 3.9% and interassay CV 4.2%; and Medgenix Diagnostics, Fleurus, Belgium; intra-assay CV 6.1% and interassay CV 9.9%). Total IGF-I was interpreted according to the sex- and age-dependent ranges used in accordance with previous reports (17, 18). Because different IGF-I assays were used over time, IGF-I levels were expressed as ULNs and not as the absolute values.
IHC
Somatotroph adenoma tissues were stained for hematoxylin and immunostained for SSTR2 and SSTR5.
Formalin-fixed paraffin-embedded tumor samples were cut into sequential 4-μm–thick sections, deparaffinized, and stained using a fully automated Ventana BenchMark ULTRA stainer (790-2208; Ventana, Tucson, AZ) according to the manufacturer’s instructions at the Pathology Department. Binding of peroxidase-coupled antibodies was detected using 3,39-diaminobenzidine as a substrate, and the sections were counterstained with hematoxylin. The rabbit monoclonal anti-SSTR2 antibody clone UMB-1 (SS-8000; BioTrend, Köln, Germany) was used at a dilution of 1:50 and the rabbit monoclonal anti-SSTR5 antibody clone UMB-4 at a dilution of 1:400 (ab109495; Abcam, Cambridge, United Kingdom). Normal pancreatic tissue served as a positive control for both SSTR2 and SSTR5 staining. For negative controls, the primary antibody was omitted. Immunostaining of the adenomas was scored semiquantitatively based on an immunoreactivity scoring (IRS) system. The IRS is calculated by the product of the percentage of positive-stained cells (0 is 0%; 1 is <10%; 2 is 10% to 50%; 3 is 51% to 80%; and 4 is 80%) and the staining intensity (0 is no staining; 1 is weak staining; 2 is moderate staining; and 3 is strong staining) (19). The IRS ranges between 0 and 12. The newly stained somatotroph adenoma tissue samples were scored by two independent investigators (A.M. and E.C.C.) based on the histopathological description of the sample provided by the pathologist. Both investigators were blinded to each other’s findings and the patients’ characteristics. Figure 2 shows two representative cases.
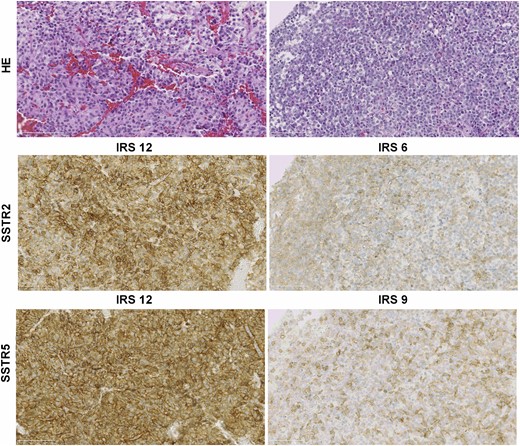
SSTR2 and SSTR5 protein expression of somatotroph adenomas scored by the IRS. HE, hematoxylin and eosin.
Statistical methods
Categorical data were represented as observed frequencies and percentages. Continuous data were represented as mean and 95% CI or median and range. The Kolmogorov-Smirnov and Shapiro-Wilk tests were used to test normality of variables. If assumption of normal data distribution was met, the paired t test was used. For nonnormally distributed variables, the Wilcoxon signed-rank test was used. Results of correlation analyses were represented as Spearman rank correlation coefficients (r). We considered P values <0.05 (two-tailed) to be statistically significant. Statistical analyses were performed with SPSS version 24 (IBM SPSS Statistics for Windows, Armonk, NY), and graphs were drawn using GraphPad Prism version 6 for Windows (GraphPad Software, San Diego, CA).
Results
Patient characteristics and treatment modalities
Characteristics of the 52 patients included in the study cohort are presented in Table 1. After initial treatment with SRLs, most patients (84.6%) had IGF-I levels >1.2 × ULN. All patients continued to receive SRL and PEGV combination treatment with a median PEGV dose of 100 mg/wk [interquartile range (IQR) 60 to 160].
Patient Characteristics for the Entire Cohort
| Characteristics | Patients (n = 52) |
|---|---|
| Age, median (range) | 53.5 (26–80) |
| Female patients, n (%) | 22 (42.3) |
| Macroadenomas, n (%) | 44 (84.6) |
| Previous surgery, n (%) | 19 (34.6) |
| SRL treatment prior to surgery, n (%) | 5 (9.6) |
| SRL treatment duration, mo, mean (95% CI) | 11.2 (8.2–14.2) |
| IGF-I before SRL therapy, × ULN, mean (95% CI) | 3.14 (2.80–3.49) |
| IGF-I after SRL therapy, × ULN, mean (95% CI) | 2.13 (1.82–2.45) |
| IGF-I ≤1.2 × ULN after SRL monotherapy, n (%) | 13 (27.1% |
| Weekly PEGV dose, mg, mean (95% CI) | 137 (101–172) |
IGF-I levels are shown before initiation of SRL monotherapy and after ≥4 months SRL monotherapy. PEGV dose is the dose during SRL and PEGV combination therapy at baseline of the PAPE study.
Table 2 reports the characteristics of patients who were included in the SSTR subcohort (n = 14). All of these patients harbored a macroadenoma. Five out of 14 patients had received SRL treatment prior to surgery [4 achieved initial IGF-I normalization (<1.2 × ULN)], and the remaining 9 patients were drug naive before surgery. During follow-up, all 14 patients received SRL and PEGV combination therapy [median PEGV dose 100 mg/wk (IQR 80 to 145)]. After 24 weeks, the median PEGV dose was 45 mg/wk (IQR 23 to 75) and decreased to 0 mg/wk (IQR 0 to 70) after 48 weeks. Three out of 14 (21.4%) patients were on PAS-LAR monotherapy after 24 weeks, increasing to 8 patients (57.1%) after 48 weeks. More in detail, in two patients, PAS-LAR dose was reduced to 40 mg and in two other patients to 20 mg monotherapy every 4 weeks. In the study cohort (n = 52), at 24 weeks, the median PEGV dose was 45 mg/wk (IQR 30 to 80), and 10 out of 52 (19.2%) patients were on PAS-LAR monotherapy. At 48 weeks, the median PEGV dose decreased to 40 mg/wk (IQR 0 to 90), and 25 out of 52 (48.1%) patients were on PAS-LAR monotherapy.
Patient Characteristics of the SSTR Subcohort
| Patient Number | Sex, Age (y) | SRL Pretreatment | IGF-I (ULN) After SRL | Percentage of IGF-I Reduction After SRL | IGF-I (ULN) After PAS-LAR 24 wk | Baseline PEGV Dose (mg/wk) | 48-wk PEGV Dose (mg/wk) | 48-wk Percentage of PEGV Dose Reduction | 48-wk PAS-LAR Dose (mg) | 48-wk PAS-LAR Score | SSTR2 (IRS) | SSTR5 (IRS) |
|---|---|---|---|---|---|---|---|---|---|---|---|---|
| 1 | M, 80 | No | 0.72 | 65.9 | 0.90 | 80 | 0 | 100 | 40 | 3 | 6 | 12 |
| 2 | F, 37 | No | 1.67 | 48.5 | 1.05 | 80 | 0 | 100 | 60 | 2 | 12 | 12 |
| 3 | M, 57 | No | 1.48 | 42.7 | 1.28 | 80 | 50 | 37.5 | 60 | 1 | 8 | 1 |
| 4 | M, 38 | No | 1.77 | 18.2 | 1.78 | 700 | 540 | 22.9 | 60 | 0 | 1 | 12 |
| 5 | F, 36 | Yes | 3.83 | 15.5 | 1.11 | 100 | 50 | 50 | 60 | 1 | 1 | 0 |
| 6 | F, 36 | No | 3.17 | 7.1 | 2.91 | 400 | 400 | 0 | 60 | 0 | 6 | 9 |
| 7 | M, 61 | Yes | 1.51 | 54.2 | 0.79 | 80 | 0 | 100 | 60 | 2 | 12 | 12 |
| 8 | F, 71 | No | 2.21 | 5.5 | 1.24 | 120 | 60 | 50 | 60 | 1 | 2 | 12 |
| 9 | M, 51 | No | 3.14 | 21.2 | 1.16 | 120 | 0 | 100 | 60 | 2 | 9 | 12 |
| 10 | M, 53 | Yes | 1.89 | 44.9 | 1.14 | 100 | 100 | 0 | 60 | 0 | 12 | 12 |
| 11 | F, 56 | No | 0.76 | 74.6 | 0.39 | 20 | 0 | 100 | 20 | 4 | 12 | 8 |
| 12 | F, 46 | Yes | 1.00 | 62.6 | 0.49 | 100 | 0 | 100 | 20 | 4 | 9 | 4 |
| 13 | M, 46 | Yes | 1.85 | 19.4 | 0.49 | 70 | 0 | 100 | 60 | 2 | 12 | 6 |
| 14 | F, 69 | No | 0.61 | 60.0 | 0.72 | 220 | 0 | 100 | 40 | 3 | 9 | 12 |
Detailed description of patients’ general characteristics, IGF-I levels after SRL and PAS-LAR treatment, and the SSTR2 and SSTR5 IRS. In addition, PEGV doses are shown during SRL and PEGV combination treatment at baseline and after switching to PAS-LAR treatment at 48 weeks. The PAS-LAR score takes into account both the achieved PEGV dose reduction and PAS-LAR dose reduction at 48 weeks compared with baseline.
Abbreviations: F, female; M, male.
Protein expression of SSTR2 and SSTR5
The median SSTR2 IRS was 9 (IQR 5 to 12), the median SSTR5 IRS was 12 (IQR 5.5 to 12), and the median SSTR2/SSTR5 ratio was 1.0 (IQR 0.6 to 1.8). We did not find a statistically significant difference in SSTR2 and SSTR5 expression between medically naive (n = 9) and SRL-pretreated (n = 5) patients (P = 0.31 and P = 0.25, respectively). More in detail, median SSTR2 IRS was 12 (IQR 5 to 12) in pretreated patients and 8 (4 to 10.5) in the naive patients, whereas median SSTR5 IRS was, respectively, 6 (2 to 12) and 12 (8.5 to 12) in SRL-pretreated and naive patients.
The relation between SSTR immunoreactivity and response to SRL treatment is shown in the supplemental data (20). In line with previous findings, the percentage of IGF-I reduction after SRL treatment was positively correlated to SSTR2 IRS, whereas an inverse trend was observed between SSTR2 IRS and IGF-I (× ULN) levels after SRL treatment. The PEGV dose at baseline during the PAPE study was inversely correlated to the SSTR2 IRS.
Relationship between response to SRL treatment and PAS-LAR treatment in study cohort
We observed a significant positive correlation between IGF-I (× ULN) levels after SRL treatment and IGF-I levels after 24 weeks of PAS-LAR treatment (r = 0.50; P = 0.0002; n = 52; Fig. 3A). However, no relation was observed between the percentage of IGF-I reduction after SRL treatment and after 24 weeks of PAS-LAR treatment (r = 0.026; P = 0.85; n = 52) (20). With respect to response to PAS-LAR after 48 weeks, IGF-I (× ULN) levels after SRL treatment showed a strong inverse correlation with the PAS-LAR score (r = −0.53; P = 0.0006; n = 52; Fig. 3B). Moreover, the percentage of IGF-I (× ULN) reduction after SRL treatment was positively correlated to the PAS-LAR score (r = 0.40, P = 0.003, n = 52, Fig. 3C) as well. We also observed a significant relationship between IGF-I (× ULN) levels after SRL treatment and after 48 weeks of PAS-LAR treatment (r = 0.30; P = 0.028; n = 52) (20).
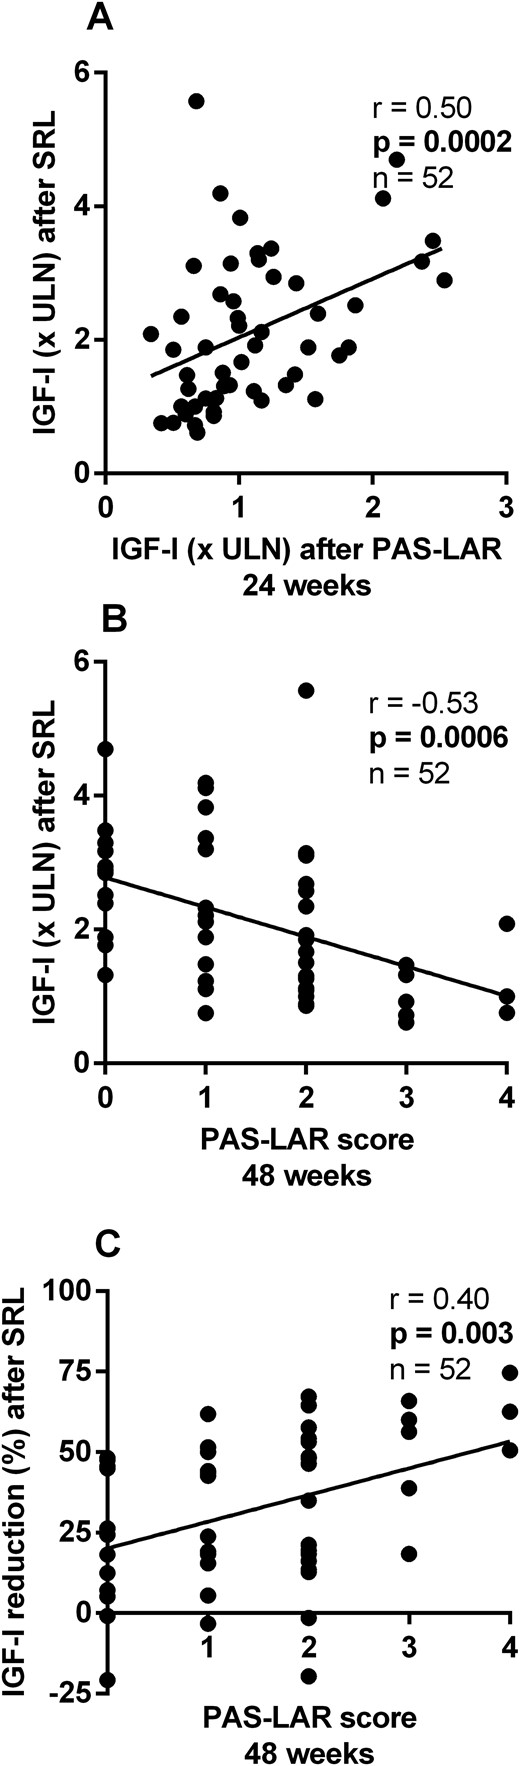
Relation between response to SRL treatment and response to PAS-LAR treatment in the study cohort. (A) IGF-I (× ULN) levels after SRL treatment were correlated to IGF-I (× ULN) levels after PAS-LAR treatment at 24 weeks and (B) inversely correlated to the PAS-LAR score at 48 weeks. (C) The percentage of IGF-I (× ULN) reduction after SRL treatment was positively correlated to the PAS-LAR score at 48 weeks.
Relationship between response to SRL treatment and PAS-LAR treatment in SSTR subcohort
In the SSTR subcohort, we observed a positive correlation between IGF-I (× ULN) levels after SRL treatment and after 24 weeks of PAS-LAR treatment (r = 0.58; P = 0.029; n = 14; Fig. 4A), whereas no correlation was observed with the percentage of IGF-I reduction (20). Higher SSTR2 IRS was correlated with lower IGF-I levels (× ULN) after 24 weeks of PAS-LAR treatment (r = −0.61; P = 0.020; n = 14; Fig. 4B), whereas SSTR5 IRS did not show any relation to IGF-I levels (r = 0.16; P = 0.58; n = 14; Fig. 4C).
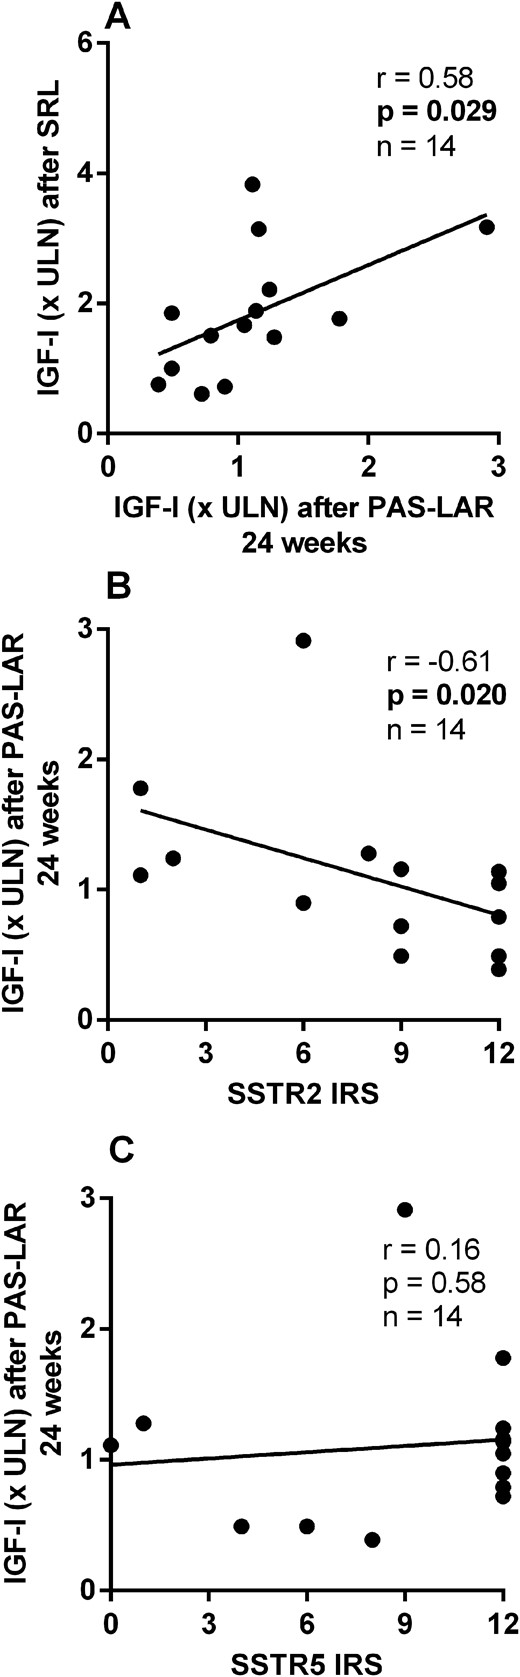
Relation between response to SRL treatment and the response to PAS-LAR treatment at 24 weeks in the SSTR subcohort. (A) IGF-I (× ULN) levels after PAS-LAR treatment at 24 weeks were correlated to IGF-I levels after SRL treatment and (B) inversely correlated to SSTR2 expression, (C) but not to SSTR5 expression.
With respect to the 48-week PAS-LAR response, the PAS-LAR score at 48 weeks was inversely correlated to IGF-I (× ULN) levels after SRL treatment (r = −0.71; P = 0.005; n = 14; Fig. 5A) and positively correlated to the percentage of IGF-I reduction after SRL treatment (r = 0.80; P = 0.001; n = 14; Fig. 5B). Furthermore, IGF-I (× ULN) levels after SRL treatment were correlated to IGF-I (× ULN) levels after PAS-LAR treatment at 48 weeks (r = 0.58; P = 0.031; n = 14) (20).
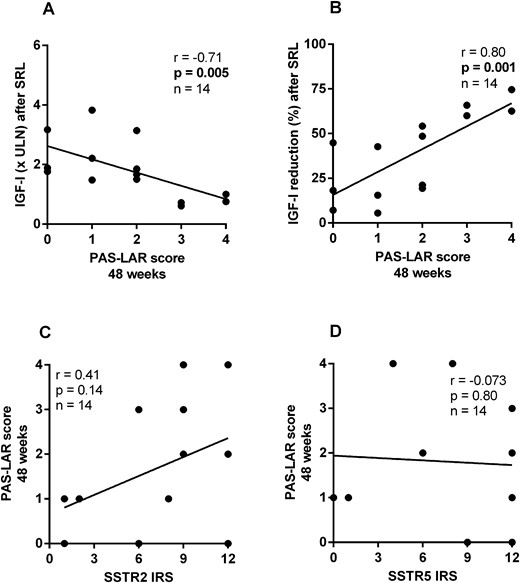
Relation between response to SRL treatment and the response to PAS-LAR treatment at 48 weeks in the SSTR subcohort. (A) The PAS-LAR score at 48 weeks was inversely correlated to IGF-I (× ULN) levels after SRL treatment and (B) positively correlated to the percentage of IGF-I reduction after SRL treatment. (C) The PAS-LAR score showed a trend for a relation with SSTR2 expression, but (D) SSTR5 expression did not show any relation.
We observed a trend, although not statistically relevant, for a direct correlation between SSTR2 IRS and the PAS-LAR score (r = 0.41; P = 0.14; n = 14; Fig. 5C), and no relation was found between SSTR5 IRS and PAS-LAR score (r = −0.073; P = 0.80; n = 14; Fig. 5D). Interestingly, considering only those patients naive to SRL treatment before surgery (n = 9), the correlation between SSTR2 IRS and the PAS-LAR score (r = 0.69; P = 0.039; n = 9) was statistically significant, whereas this was not the case for SSTR5 IRS.
Discussion
Our results suggest that in patients with acromegaly, the responsiveness to PAS-LAR treatment is mainly correlated to SSTR2 expression and not to SSTR5. This observation is further supported by the finding that after 48 weeks’ treatment, the percentage of IGF-I reduction after SRL treatment was correlated to the PAS-LAR treatment response score. Our study provides the finding that the in vivo response to PAS-LAR is directly correlated to both the clinical response to first-generation SRL treatment and SSTR2 expression on adenoma tissue.
However, these results are not unexpected. Indeed, our data confirm previous in vitro studies, carried out in primary cultures of GH-secreting adenomas, showing that the efficacy of naive somatostatin (SRIF-14), octreotide, and pasireotide in the reduction of GH secretion was positively correlated with SSTR2 mRNA expression, but not with SSTR5 (13, 21, 22). According to these findings, our group and other authors (12, 13, 23) have reported that the effect of octreotide and pasireotide on GH suppression is almost superimposable both in vitro and in vivo.
The observed positive relation between SSTR2 protein expression and the percentage of IGF-I reduction after SRL treatment is in line with previous studies (5, 6). Furthermore, an inverse relation between the PEGV dose and SSTR2 expression was recently reported, suggesting that the required PEGV dose to normalize IGF-I levels in patients with partial response to SRLs is a surrogate marker for the degree of SRL resistance (8). In our cohort, the SRL-pretreated patients had a trend for a higher SSTR2 expression than medically naive patients. This finding is in contrast to previous studies (5, 6), and it is probably correlated to a lack of statistical power in our study (five vs nine adenoma samples).
Our results show that IGF-I levels after PAS-LAR treatment were directly correlated to SSTR2 expression and not to SSTR5 expression. After exclusion of SRL-pretreated patients, SSTR2 IRS was also significantly correlated to the PAS-LAR score, a tool designed to uncover the impact of switching to PAS-LAR treatment in patients using SRLs and PEGV combination treatment. Although there is no evidence that SSTR5 expression is affected by SRL presurgical treatment, it has been widely demonstrated that patients receiving SRL treatment prior to neurosurgery show significantly lower SSTR2 protein expression compared with medically naive patients (4–6, 13). Although this is not evident in our cohort, a pooled analysis of SRL-pretreated and medically naive patients can introduce bias. Exclusion of the SRL-pretreated patients from our analysis (n = 5) resulted in a stronger relationship between SSTR2 IRS and the response to PAS-LAR treatment.
A strength of our study lies in the relatively large number of patients in which the clinical efficacy of SRLs, SRL/PEGV combination treatment and PAS-LAR treatment were systematically investigated in combination with data on SSTR expression of somatotroph adenomas in a well-characterized subgroup of patients. The main limitation of our study lies in the retrospective collection of data on IGF-I levels during SRL treatment and the use of different IGF-I assays during follow-up. The IGF-I levels measured after 24 weeks of PAS-LAR treatment may be partly influenced by the carryover effect of withdrawal of SRLs after 12 weeks. Although the carryover effect of SRLs may have influenced the short-term response to PAS-LAR after 24 weeks, the response to PAS-LAR treatment after 48 weeks is probably not affected. In our cohort, the PAS-LAR score at 48 weeks might therefore be the most informative marker for responsiveness to PAS-LAR treatment.
Two studies have previously investigated the relationship between the immunohistochemical expression of SSTR2 and SSTR5 in somatotroph adenomas and the clinical response to first-generation SRL and PAS-LAR treatment in acromegaly (24). Iacovazzo et al. (24) suggested that SSTR5 expression drives the responsiveness to PAS-LAR treatment in patients resistant to first-generation SRLs. These authors investigated a cohort of 39 patients with acromegaly requiring postoperative SRL treatment, of whom 11 patients were resistant to SRL and switched to PAS-LAR treatment. They observed that none of the patients lacking SSTR5 expression was responsive to PAS-LAR, whereas five out of seven patients with membranous expression of SSTR5 were responsive to PAS-LAR. Furthermore, patients with a higher SSTR5 score had a greater reduction in IGF-I levels. However, they found no difference in SSTR2 expression between pasireotide responders and nonresponders.
These results are in contrast with our findings, which suggest that SSTR2 expression, and not SSTR5 expression, is more important for the clinical response to PAS-LAR. The main difference between our study and the study from Iacovazzo et al. (24) is that we included mainly patients who were partially responsive to SRLs, whereas Iacovazzo et al. (24) included only SRL-resistant patients. Secondly, the patients in our cohort all received PEGV treatment before switching to PAS-LAR during the PAPE study, whereas the patients in the study by Iacovazzo et al. (24) did not receive PEGV treatment and were directly switched to PAS-LAR (Table 2). In addition, these differences are unlikely to be explained by the use of a different SSTR expression scoring system. Although the other authors used a scoring method proposed by Volante et al. (25), which takes into account both subcellular localization and extent of staining, the method we used from Remmele and Stegner (19) is a semiquantitative score that takes into account both intensity and percentage of positive cells. Interestingly, both scoring systems have been recently found to show high interlaboratory and interobserver agreement for SSTR expression in neuroendocrine tumors (26).
Furthermore, in our cohort, we cannot rule out a direct effect of PEGV treatment on SSTR expression (8). PEGV is known to increase serum GH levels (27), which could result in reduced hypothalamic GHRH secretion, which in turn may lead to a downregulation of SSTR expression. Although the impact of PEGV on SSTR expression is plausible (28), there is no evidence that PEGV treatment plays a major role in the modulation of SSTR expression via the activation of the GH-IGF-I axis.
Although our study suggests that pasireotide acts mainly via SSTR2 in somatotroph adenomas, in corticotroph adenomas, SSTR5 seems to be more important. Several in vitro studies have demonstrated that pasireotide is more effective than octreotide in reducing ACTH secretion and/or intracellular cAMP levels in AtT20 cells or corticotroph adenoma primary cultures (29–32). In contrast, preclinical studies have indicated that pasireotide and octreotide are equally effective (in vitro) in lowering GH levels (13, 21, 23, 33). This suggests a predominant role of SSTR2 in mediating the inhibitory effect of pasireotide on GH secretion in somatotroph adenomas.
In conclusion, our results suggest that SSTR2 expression of somatotroph adenomas is more important than SSTR5 in driving the responsiveness to PAS-LAR treatment in a peculiar subset of patients with acromegaly (e.g., partial responders). It is plausible that the enhanced efficacy of PAS-LAR compared with first-generation SRLs is mediated by its stronger inhibition of insulin secretion, rendering the liver less sensitive to GH action (34). The enhanced efficacy of PAS-LAR could also be the consequence of a differential activation of SSTR2 by the different compounds (e.g., reduced activation of SSTR2 internalization and faster recycling on the cell membrane) (35, 36) rather than by the higher binding affinity of PAS-LAR for SSTR5. Future studies should investigate whether this is indeed the case.
Abbreviations:
- CV
coefficient of variation
- IHC
immunohistochemistry
- IQR
interquartile range
- IRS
immunoreactivity score
- PAPE
Pasireotide LAR and Pegvisomant
- PAS-LAR
pasireotide long-acting release
- PEGV
pegvisomant
- SRL
somatostatin receptor ligand
- SSTR2
somatostatin receptor subtype 2
- SSTR5
somatostatin receptor subtype 5
- ULN
upper limit of normal
Acknowledgments
We thank Hans Stoop from the Pathology Department of Erasmus University Medical Center for the IHC, the study nurses who contributed to the study, and the patients for participation in the PAPE study.
Author Contributions: A.M., L.J.H., and S.J.C.M.M.N. conceived and designed the study. A.M. was responsible for data management and statistical analyses after discussion with all authors. A.M., E.C.C., F.G., S.E.F., J.A.M.J.L.J., A.J.v.d.L., L.J.H., and S.J.C.M.M.N. participated in data interpretation and writing of the report.
Disclosure Summary: A.M. received a speaker’s fee from Novartis Pharma. A.J.v.d.L. is a consultant for Novartis Pharmaceuticals and Pfizer International and received grants from Novartis Pharmaceutials, Ipsen Pharma International, and Pfizer International. L.J.H. received investigator-initiated research grants from Ipsen Pharma International and Novartis Pharmaceuticals. S.J.C.M.M.N. received research and speaker’s fee grants from Ipsen Pharma International, Novartis Pharmaceuticals, and Pfizer International and consulting fees from Ipsen Pharma International. The remaining authors have nothing to disclose.
