


Abstract
Thyroid cancer incidence increased with the greatest change in adults aged ≥65 years.
To determine the relationship between area-level use of imaging and thyroid cancer incidence over time.
Longitudinal imaging patterns in Medicare patients aged ≥65 years residing in Surveillance, Epidemiology, and End Results (SEER) regions were assessed in relationship to differentiated thyroid cancer diagnosis in patients aged ≥65 years included in SEER-Medicare. Linear mixed-effects modeling was used to determine factors associated with thyroid cancer incidence over time. Multivariable logistic regression was used to determine patient characteristics associated with receipt of thyroid ultrasound as initial imaging.
Thyroid cancer incidence.
Between 2002 and 2013, thyroid ultrasound use as initial imaging increased (P < 0.001). Controlling for time and demographics, use of thyroid ultrasound was associated with thyroid cancer incidence (P < 0.001). Findings persisted when cohort was restricted to papillary thyroid cancer (P < 0.001), localized papillary thyroid cancer (P = 0.004), and localized papillary thyroid cancer with tumor size ≤1 cm (P = 0.01). Based on our model, from 2003 to 2013, at least 6594 patients aged ≥65 years were diagnosed with thyroid cancer in the United States due to increased use of thyroid ultrasound. Thyroid ultrasound as initial imaging was associated with female sex and comorbidities.
Greater thyroid ultrasound use led to increased diagnosis of low-risk thyroid cancer, emphasizing the need to reduce harms through reduction in inappropriate ultrasound use and adoption of nodule risk stratification tools.
Since 2000 in the United States, the incidence of thyroid cancer has nearly doubled, with thyroid cancer now the 11th most common cancer and the 5th most common cancer in women (1–4). This rise in thyroid cancer incidence has a large impact on the older adult population, as adults aged ≥65 years have had the greatest increase in thyroid cancer incidence, the most variability in cancer prognosis, and the most risks from thyroid cancer treatments including increased morbidity and mortality after thyroid surgery, increased likelihood of overtreatment with radioactive iodine due to lower renal clearance, and greater risks of arrhythmia and bone loss with suppressive doses of thyroid hormone replacement (3, 5–17).
The etiology of the rise in thyroid cancer incidence, both in older and younger adults, remains controversial, with many concerned about overdiagnosis and some worried about the role of understudied environmental risk factors (1, 18, 19). Supportive of overdiagnosis is a study describing the predominant rise of small papillary thyroid cancers, as well as a recent perspective illustrating the change in thyroid cancer incidence after the advent of ultrasound (1, 18).
In an effort to further understand the role of imaging, specifically whether thyroid cancers are detected when thyroid ultrasound is the initial imaging test vs if thyroid cancers are discovered as an incidental finding with other imaging tests, we used two complementary databases, Medicare and Surveillance, Epidemiology and End Results (SEER-Medicare), to evaluate the relationship between area-level use of imaging and thyroid cancer incidence after controlling for regional demographics and time. We hypothesized that patients in regions with high use of imaging, especially thyroid ultrasound, are more likely to be diagnosed with thyroid cancer. We exploited the vast changes in imaging by region and over time to explore this issue. We further hypothesized that subgroups of patients susceptible to cancer detection with thyroid ultrasound as initial imaging could be identified with Medicare data.
Materials and Methods
Data source and study population
To determine the relationship between imaging and thyroid cancer incidence, we used two different data sets: Medicare claims data to measure imaging and Medicare data linked with the SEER registry (SEER-Medicare) to measure cancer incidence. Medicare includes claims for covered health services, including imaging tests, and represents ∼97% of patients aged ≥65 years (20, 21). SEER-Medicare is a linkage of SEER data to Medicare claims and is a key source of information on cancer statistics (22). For this study, we used a 20% Medicare sample from 2002 to 2013 to select patients in Medicare who resided within counties identified by the SEER population. To focus on older adults and increase the likelihood of performed imaging tests being captured by Medicare data, we then restricted this Medicare cohort to patients aged ≥65 years and who were enrolled in Medicare Part A and B and non–Health Maintenance Organization (HMO) for at least 11 months throughout the year. This cohort included 2,407,440 participants over the entire 12-year time span with an average of 1,219,614 participants per year. Because we were interested in imaging sequence in this cohort, we used data from 2001 to 2014, a year before and after the years of cancer diagnosis, to identify and classify the order in which imaging tests were performed. In parallel, we similarly restricted the SEER-Medicare cohort to patients aged ≥65 years, with differentiated thyroid cancer (i.e., papillary, follicular, or Hürthle cell cancer), diagnosed from 2002 to 2013, and enrolled in Medicare Part A and B and non-HMO for at least 11 months during the time span including the month of diagnosis and the year following diagnosis. The SEER-Medicare cohort included 12,540 patients over the entire 12-year time span with an average of 1045 patients per year.
To determine the relationship between area-level imaging and area-level incidence of thyroid cancer, we defined regional subgroups based on the hospital referral region, as previously described by the Dartmouth Atlas (23), and the rural-urban continuum. Data were assessed at a population level. We combined counties if they were in the same hospital referral region and if they had the same rural-urban category [metropolitan (metro), adjacent to metro, or nonadjacent to metro] (24). Therefore, our unit of analysis was larger than a county but smaller than a hospital referral region. We used both hospital referral regions and rural-urban continuum to define regional subgroups because these are two important factors in explaining geographic variation. Both the Medicare and SEER-Medicare cohort had 154 regional subgroups. One regional subgroup was subsequently excluded because it only contained one county, the hospital referral region did not reside within a SEER county, and the population of the county was small. The final analytic sample for both Medicare and SEER-Medicare included 153 identical regional subgroups.
Institutional Review Board approval was not required because this study involves research using publically available data and cannot be tracked to human subjects.
Measures
Patient demographics and imaging sequence were measured in the Medicare cohort. Age, sex, race, and Charlson-Deyo comorbidity index were measured at the individual level. Rural-urban continuum, education, and income were measured at the county level. Individual imaging sequence was documented from 2001, a year prior to the year thyroid cancer incidence was first evaluated, to 2014, a year after the latest year in which thyroid cancer incidence was evaluated. Imaging was divided into three categories: none, other imaging, and thyroid ultrasound. The category “thyroid ultrasound” included patients who had a thyroid ultrasound as initial imaging (i.e., thyroid ultrasound was not preceded by another imaging test that would capture the thyroid). Because thyroid nodules can be detected by other imaging tests, the category “other imaging” included other imaging tests that would capture the thyroid, such as CT of neck, chest, or C-spine, MRI of neck, chest, or C-spine, carotid duplex, maxillofacial CT, or body positron emission tomography/CT. If a patient had a thyroid ultrasound but it was preceded by an “other imaging” test, then it was assumed that a nodule would first be detected on the other imaging and that the thyroid ultrasound was a follow-up evaluation. Therefore, these patients were also classified as receiving “other imaging.” The category “none” included patients who did not receive thyroid ultrasound or other imaging. Imaging sequence was evaluated over the course of the patient’s enrollment in Medicare and was reported in the last year of imaging or definitive treatment. All variables, including demographics and imaging, were aggregated within regional subgroups for analytic purposes. For example, for purposes of analysis, sex was defined as the proportion of females within each regional subgroup. Other variables were treated similarly.
SEER-Medicare data were used to obtain details on thyroid cancer incidence, cancer type, stage, and tumor size in patients aged ≥65 years. Similar to the Medicare data, variables were measured at the individual level and for purposes of analysis were aggregated in the regional subgroups. Because there were different populations in different regional subgroups, it was expected that incidence would differ within these regional subgroups. Therefore, we standardized incidence by dividing thyroid cancer incidence within each regional subgroup by the Medicare population within the corresponding regional subgroup. Because the resultant ratios were small, we multiplied all ratios by 1000.
Statistical analysis
We performed a time-trend analysis of use of thyroid ultrasound from 2002 to 2013. To assess temporal trends in use of thyroid ultrasound as initial imaging, we estimated the rate of growth of an exponential model fitted to the mean of the annual values as a function of time (year).
Linear mixed-effects regression was used to determine the relationship between imaging (i.e., none, thyroid ultrasound, and other imaging) and incidence of thyroid cancer. We adjusted for time and demographic characteristics of the regional subgroups in the model, including age, sex, race, Charlson-Deyo comorbidity index, rural-urban continuum, education, and median household income. Our model also included a random regional subgroup-specific intercept to account for the correlation in the measurements over time. The population-averaged estimate of the imaging coefficient was obtained after adjusting for the aforementioned covariates and ORs and 95% CIs derived to assess clinical significance. We performed subgroup analysis in patients with papillary thyroid cancer, localized papillary thyroid cancer, and localized papillary thyroid cancer with tumor size ≤1 cm.
Based on our fitted model, we estimated the incidence of thyroid cancer from 2002 through 2013 that would have occurred if the rate of thyroid ultrasound use remained steady at 2002 levels instead of rising to 2013 levels. We then compared the projected incidence with stable use of thyroid ultrasound per year to the modeled actual incidence of thyroid cancer with rising use of thyroid ultrasound per year. The difference between these two quantities is the estimated number of thyroid cancer cases diagnosed in adults aged ≥65 years enrolled in Medicare Part A and B and non-HMO as a result of an increase in the use of thyroid ultrasound over time.
Next, to understand if certain patients are more likely to undergo thyroid ultrasound,we performed multivariable logistic regression using individual-level Medicare data to determine the characteristics of patients who received a thyroid ultrasound as initial imaging anytime in the 12-year time span as compared with patients who received no imaging during the 12-year time span.
All statistical analyses were performed using SAS 9.4 software. Two-sided tests were used, with P < 0.05 considered statistically significant.
Results
As shown in Fig. 1, thyroid ultrasound as initial imaging per 100,000 people enrolled in Medicare has increased over time at a rate of 20.9% per year from 2002 through 2013 (P < 0.001).
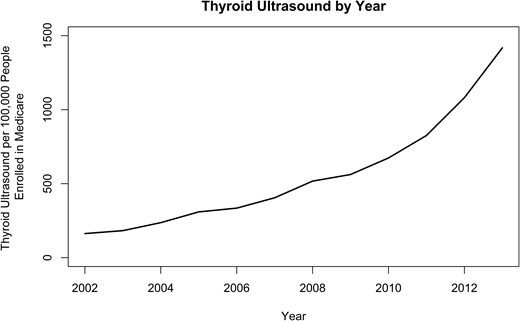
Thyroid ultrasound as initial imaging per 100,000 people enrolled in Medicare has increased at a rate of 20.9% per year from 2002 to 2013 (P < 0.001).
Table 1 shows area-level imaging and demographics with Medicare claims data. Data at the patient-level were described by determining the aggregated mean per year of all 12 years. The mean patient age of the Medicare cohort was 76 years when measured at the patient-year level. Most patients were female (58.3%), white (82.9%), and resided in a metro region (84.2%). The majority of the patients in Medicare (89.9%) had no imaging in a 1-year time span, 9.5% had other imaging, and 0.6% had thyroid ultrasound. Table 2 demonstrates thyroid cancer incidence and demographics with SEER-Medicare data. SEER-Medicare data at the patient-level were similarly described by determining the aggregated mean per year of all 12 years. When measured at the patient-level and determining the aggregated mean per year of all 12 years, the majority of the patients with differentiated thyroid cancer had papillary thyroid cancer (85.7%) and localized disease (69.9%). Over one-third (35.6%) of the patients had tumor size ≤1 cm.
Sociodemographic and Imaging Characteristics of Patients in Medicare
| Characteristics | Mean per Year, a n (%) | Range (Minimum–Maximum) |
|---|---|---|
| Medicareb | 1,219,614 | 1,174,633–1,274,441 |
| Age, y | 76 | 75–76 |
| Sex | ||
| Male | 508,825 (41.7) | 477,532–544,438 |
| Female | 710,789 (58.3) | 689,931–730,003 |
| Race | ||
| White | 1,010,493 (82.9) | 984,320–1,039,693 |
| Black | 95,587 (7.8) | 91,007–99,830 |
| Other | 113,534 (9.3) | 90,448–138,101 |
| Charlson-Deyo comorbidity index | 1.6 | 1.43–1.75 |
| Rural-urban continuumc | ||
| Metro | 1,026,731 (84.2) | 983,019–1,078,506 |
| Adjacent to metro | 107,770 (8.8) | 104,317–110,129 |
| Not adjacent to metro | 85,113 (7.0) | 82,503–86,000 |
| Education high school or abovec | 85.4 | 85.3–85.4 |
| Median household income, $c | 57,283 | 56,951–57,682 |
| Imaging | ||
| None | 1,095,294 (89.9) | 1,041,326–1,144,333 |
| Other imaging | 116,440 (9.5) | 65,344–211,632 |
| Thyroid ultrasound | 7,880 (0.6) | 1,967–21,483 |
Mean per year is the aggregate of the means of all 12 years at the patient level.
The cohort includes the 20% Medicare sample residing in the regional subgroups that correspond with SEER-Medicare counties.
Data are measured at the zip code level. All other variables are measured at the individual level.
Tumor Characteristics of Patients in SEER-Medicare
| Characteristics | Mean per Year,a n (%) | Range (Minimum–Maximum) |
|---|---|---|
| SEER-Medicare | 1045 | 707–1279 |
| Cancer type | ||
| Papillary | 899 (85.7) | 596–1146 |
| Follicular | 89 (8.7) | 72–104 |
| Hürthle cell | 57 (5.6) | 39–79 |
| SEER stage | ||
| Localized | 734 (69.9) | 471–921 |
| Regional | 225 (21.4) | 140–293 |
| Distant | 65 (6.6) | 49–81 |
| Unknown | 20 (2.1) | 12–36 |
| Tumor size | ||
| ≤1 cm | 378 (35.7) | 223–530 |
| >1 and ≤2 cm | 238 (22.4) | 137–314 |
| >2 and ≤4 cm | 214 (20.6) | 140–257 |
| ≥4 cm | 145 (14.1) | 110–171 |
| Unknown | 70 (7.2) | 44–103 |
Mean per year is the aggregate of the means of all 12 years at the patient level.
Table 3 shows the aggregated population means per year of the 153 regional subgroups and the results of the linear mixed-effects model evaluating factors associated with thyroid cancer incidence. In multivariable analysis, use of thyroid ultrasound was significantly associated with thyroid cancer incidence (P < 0.001). As shown in Table 4, the relationship between use of thyroid ultrasound and incidence remained significant when subgroup analyses were performed with papillary thyroid cancer (P < 0.001), localized papillary thyroid cancer (P = 0.004), and then localized papillary thyroid cancer ≤1 cm (P = 0.01).
The Relationship Between Imaging and Thyroid Cancer Incidence: Analysis at the Regional Subgroup Level
| Linear Mixed-Effects and Model Estimates | Regional Subgroup Mean per Year a | Estimate (SE) | P Value |
|---|---|---|---|
| Intercept | −4.18 (2.53) | 0.10 | |
| Imaging | |||
| None | 90.2% | Reference | |
| Other imaging | 9.2% | −1.88 (1.15) | 0.10 |
| Thyroid ultrasound | 0.6% | 26.19 (6.37) | <0.001 |
| Time, y | 0.01 (0.01) | 0.14 | |
| Age | 76 | 0.08 (0.04) | 0.04 |
| Sex | |||
| Male | 42.3% | Reference | |
| Female | 57.7% | −1.53 (1.14) | 0.18 |
| Race | |||
| White | 87.2% | Reference | |
| Black | 7.7% | 0.02 (0.29) | 0.95 |
| Other | 5.1% | −0.32 (0.27) | 0.23 |
| Charlson-Deyo comorbidity index | 1.5 | 0.19 (0.12) | 0.13 |
| Rural-urban continuum | |||
| Metro | 47.1% | Reference | |
| Adjacent to metro | 30.7% | −0.02 (0.06) | 0.68 |
| Not adjacent to metro | 22.2% | 0.00 (0.06) | 0.98 |
| Education high school or above | 84.6% | −0.58 (0.49) | 0.24 |
| Median household income | $48,381 | 0.03 (0.03) | 0.23 |
The regional subgroup mean per year is the aggregate of the means from the 153 regional subgroups.
The Relationship Between Imaging and Papillary Thyroid Cancer, Localized Papillary Thyroid Cancer, and Localized Papillary Thyroid Cancer With Tumor Size ≤1 cm
| Model Estimates | Papillary Thyroid Cancer | Localized Papillary Thyroid Cancer | Localized Papillary Thyroid Cancer With Tumor Size ≤1 cm | |||
|---|---|---|---|---|---|---|
| Estimate (SE) | P Value | Estimate (SE) | P Value | Estimate (SE) | P Value | |
| Intercept | −3.02 (2.44) | 0.22 | 0.06 (2.16) | 0.98 | 1.95 (1.39) | 0.16 |
| Time, y | 0.01 (0.01) | 0.15 | 0.02 (0.01) | 0.03 | 0.01 (0.01) | 0.02 |
| Age | 0.05 (0.04) | 0.13 | 0.01 (0.03) | 0.75 | −0.03 (0.02) | 0.21 |
| Sex | ||||||
| Male | Reference | Reference | Reference | |||
| Female | −0.75 (1.10) | 0.49 | −0.46 (0.97) | 0.64 | 0.45 (0.63) | 0.47 |
| Race | ||||||
| White | Reference | Reference | Reference | |||
| Black | −0.25 (0.28) | 0.38 | −0.03 (0.25) | 0.89 | −0.12 (0.15) | 0.44 |
| Other | −0.17 (0.26) | 0.52 | −0.25 (0.23) | 0.28 | −0.18 (0.14) | 0.21 |
| Charlson-Deyo comorbidity index | 0.15 (0.12) | 0.21 | 0.12 (0.11) | 0.27 | 0.09 (0.07) | 0.19 |
| Rural-urban continuum | ||||||
| Metro | Reference | Reference | Reference | |||
| Adjacent to metro | −0.01 (0.06) | 0.85 | −0.02 (0.05) | 0.74 | −0.05 (0.03) | 0.14 |
| Not adjacent to metro | 0.02 (0.06) | 0.79 | 0.01 (0.06) | 0.89 | −0.01 (0.03) | 0.85 |
| Education high school or above | −0.53 (0.48) | 0.27 | −0.44 (0.43) | 0.30 | −0.23 (0.26) | 0.39 |
| Median household income ($10,000) | 0.03 (0.03) | 0.23 | 0.02 (0.02) | 0.45 | 0.00 (0.02) | 0.76 |
| Imaging | ||||||
| None | Reference | Reference | Reference | |||
| Other imaging | −1.19 (1.08) | 0.27 | −1.45 (0.96) | 0.13 | −1.07 (0.66) | 0.10 |
| Thyroid ultrasound | 22.45 (5.95) | <0.001 | 15.23 (5.28) | 0.004 | 9.10 (3.65) | 0.01 |
Figure 2 compares the projected thyroid cancer incidence based on actual rates of thyroid ultrasound use between 2002 to 2013 vs incidence with thyroid ultrasound use set at 2002 levels from 2003 to 2013. Based on our fitted model, between 2003 and 2013 in patients aged ≥65 years enrolled in Medicare Part A and B and non-HMO, there were 1833 patients who would not have been diagnosed with thyroid cancer if thyroid ultrasound use remained stable at 2002 levels. Because the largest geographic coverage available with SEER-Medicare is ∼27.8% of the population, we estimate that in the United States, at least 6594 adults aged ≥65 years were diagnosed with thyroid cancer from 2003 to 2013 because of an increase in the use of thyroid ultrasound as initial imaging. Because this estimate only includes patients enrolled in Medicare Part A and B and non-HMO, actual numbers would be even larger.
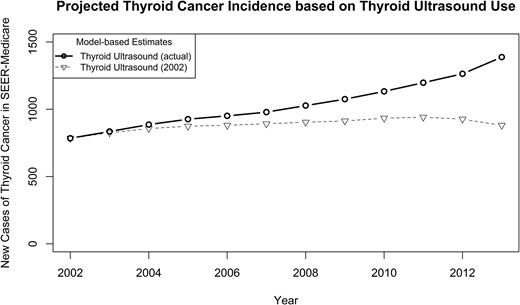
Based on our fitted model, the projected thyroid cancer incidence with thyroid ultrasound use set at 2002 levels between 2003 to 2013 as compared with thyroid cancer incidence with actual thyroid ultrasound use between 2003 and 2013.
As expected, female patients and patients with more comorbidities were more likely to have a thyroid ultrasound as initial imaging. Of the patients who underwent a thyroid ultrasound as initial imaging at any time during the 12-year time span, 72,738 out of 99,085 (73.4%) were female as compared with 563,051 out of 1,008,430 (55.8%) female in the cohort who never underwent imaging. In addition, 20,789 out of 99,085 (21.0%) and 30,909 out of 99,085 (31.2%) of the patients who underwent thyroid ultrasound as initial imaging had one and two or more comorbidities, respectively, as compared with 171,566 out of 1,008,430(17.0%) with one comorbidity and 178,860 out of 1,008,430 (17.7%) with two or more comorbidities in the cohort who never underwent imaging. The multivariable logistic model confirmed the descriptive results. When controlling for age, race, rural-urban continuum, education, and income, female sex [OR 2.28 (95% CI, 2.24 to 2.31)] and one comorbidity [OR 1.78 (95% CI, 1.75 to 1.81)] or two or more comorbidities [OR 2.75 (95% CI, 2.70 to 2.79)] explained large patient-level differences in the use of thyroid ultrasound as initial imaging.
Discussion
In this study, we evaluated the sequences of area-level imaging and found that from 2002 to 2013, the use of thyroid ultrasound as initial imaging increased. In multivariable analysis, there was a considerable relationship between area-level thyroid ultrasound use and area-level thyroid cancer incidence even when we restricted the diagnosis to papillary thyroid cancer, localized papillary thyroid cancer, and then localized papillary thyroid cancer with tumor size ≤1 cm. Between 2003 to 2013, the increase in use of thyroid ultrasound in the United States resulted in at least 6594 adults aged ≥65 years being diagnosed with thyroid cancer. Females and patients with comorbidities were especially vulnerable to receipt of thyroid ultrasound as initial imaging.
Although cross-sectional studies and small studies using chart abstraction have attempted to evaluate the role of imaging in the rise in thyroid cancer incidence (25–28), our population-based cohort uses two complementary databases, Medicare and SEER-Medicare, to evaluate the relationship between area-level use of imaging tests and thyroid cancer incidence over time. Specifically, we identified the type of imaging study associated with thyroid cancer diagnosis (i.e., thyroid ultrasound) and estimated the number of thyroid cancer diagnoses accounted for by increased use of thyroid ultrasound over time.
In the debate over whether there has been a true rise in thyroid cancer incidence vs overdiagnosis, our work supports overdiagnosis as the primary culprit. Cancer overdiagnosis occurs when a cancer fulfills pathologic criteria for cancer but does not go on to cause symptoms or death (29). Prior autopsy studies revealing incidental small thyroid cancers in up to 36% of adults who die of another cause along with studies demonstrating a near-zero mortality rate for low-risk thyroid cancer, especially if localized and ≤1 cm, suggest overdiagnosis (1, 7, 30). Because the diagnostic pathway for thyroid cancer typically starts with identification of a thyroid nodule by palpation or imaging test, followed by fine-needle aspiration/biopsy of the nodule, and then, if the nodule is diagnostic or suspicious for cancer, often followed by thyroid surgery, our study suggests that increased use of thyroid ultrasound as initial imaging is responsible for increasing the number of patients who start down the thyroid cancer diagnostic pathway. This subsequently increases the number of patients with a thyroid cancer diagnosis.
Our ability to identify patient characteristics associated with increased use of thyroid ultrasound will allow for targeted interventions to reduce thyroid cancer overdiagnosis. For adults aged ≥70 years, only 1.5% of all nodules undergoing fine-needle aspiration are high-risk cancers that will result in death, with comorbid conditions more likely to cause patient mortality (31). Thus, greater use of thyroid ultrasound in older patients with comorbid conditions is unlikely to improve thyroid cancer–specific survival or benefit patients in a meaningful way, emphasizing the need to reduce unnecessary fine-needle aspirations and downstream thyroid surgeries in this subgroup of patients. For older patients with multiple comorbidities, there may be a role for nodule surveillance without initial intervention. However, the relationship between ultrasound use and female sex is more complex. Thyroid nodules are more common in older women, and thyroid cancer incidence is threefold higher in women than in men (32). Therefore, our finding of greater thyroid ultrasound use in women suggests screening bias, but it remains difficult to disentangle screening bias from physiologic risk for thyroid cancer.
We studied the use of thyroid ultrasound in older adults because older adults have both the largest change in thyroid cancer incidence and the greatest risks from downstream treatments (3, 9–17). Because similar trends in thyroid cancer incidence have occurred in younger adults in the United States, it is plausible that the findings from this study are generalizable to adults <65 years of age. In addition, although SEER-Medicare and Medicare data are specific to the United States, in the past 30 years thyroid cancer incidence has increased in many well-developed countries (18), suggesting that the findings of this study may apply to other countries as well.
Limitations to this study are similar to limitations of other studies using claims data and include risks for coding errors and reporting bias. To reduce these risks, we restricted the cohort to patients enrolled in Medicare and SEER-Medicare at least 85% of the time throughout a 1-year period. An additional limitation is the fact that our study only captures billed imaging studies. This study would not capture when bedside thyroid ultrasound is performed but not billed. Therefore, because a small proportion of thyroid ultrasounds are performed at bedside as an extension of the physical examination, it is possible that the actual rise in use of thyroid ultrasound is even more marked than shown with this study. Finally, we do not know the indications for the thyroid ultrasounds. However, the U.S. Preventive Services Task Force has recommended against screening for thyroid cancer with palpation or ultrasound in asymptomatic adults, and only ∼5% of adults have nodules causing compressive symptoms (32–34).
A better understanding of the relationship between increased use of thyroid ultrasound and the rise in thyroid cancer incidence has implications for shifting the current clinical practice paradigm away from blindly identifying disease and toward focused investigation and appropriate diagnoses. Our data suggest the need to universally reduce thyroid ultrasound use, as recently advocated in Korea (35), to apply nodule risk stratification more broadly, as advocated by the American Thyroid Association and Thyroid Imaging, Reporting and Data System (36, 37), or to specifically target interventions to reduce unnecessary thyroid ultrasound and fine-needle aspirations in older adults with comorbidities.
Abbreviations:
- HMO
Health Maintenance Organization
- metro
metropolitan
- SEER
Surveillance, Epidemiology, and End Results
- SEER-Medicare
Medicare data linked with the Surveillance, Epidemiology, and End Results registry
Acknowledgments
We thank Ms. Brittany Gay for assistance with the tables and figures.
Financial Support: This work was supported by Agency for Healthcare Research and Quality Grant R01 HS024512.
Disclosure Summary: The authors have nothing to disclose.
References
National Cancer Institute at the National Institutes of Health. Common Cancer Types. Available at: www.cancer.gov/cancertopics/types/commoncancers. Accessed 5 January 2018.
U.S. Centers for Medicare & Medicaid Services. The Official U.S. Government Site for Medicare. Available at: www.medicare.gov. Accessed 1 February 2018.
Healthcare Delivery Research Program, National Cancer Institute, Division of Cancer Control and Population Sciences. SEER-Medicare Linked Database. Available at: https://healthcaredelivery.cancer.gov/seermedicare. Accessed 9 March 2018.
The Dartmouth Atlas of Health Care. Available at: www.dartmouthatlas.org/. Accessed 9 March 2018.
United States Department of Agriculture. Economic Research Service. Rural-Urban Continuum Codes. Available at: www.ers.usda.gov/data-products/rural-urban-continuum-codes/. Accessed 9 March 2018.
U.S. Preventive Services Task Force. Thyroid Cancer: Screening. Available at: www.uspreventiveservicestaskforce.org/Page/Document/UpdateSummaryFinal/thyroid-cancer-screening1. Accessed 9 March 2018.
