


Abstract
The natural histories of obesity subphenotypes are incompletely delineated.
To investigate dynamic changes in obesity subphenotypes and associations with outcomes.
Framingham Offspring Cohort participants (n = 4291) who attended the examination cycles 2 (1979 to 1983) to 7 (1998 to 2001), which included 26,508 participant observations. Obesity subphenotypes [metabolically healthy nonobese (MHNO), metabolically healthy obese (MHO), metabolically unhealthy nonobese (MUNO), and metabolically unhealthy obese (MUO)] were ascertained based on metabolic health (<2 Adult Treatment Panel III criteria). The outcomes were subclinical cardiovascular disease (CVD), incident diseases [diabetes, hypertension, chronic kidney disease (CKD), CVD], and all-cause mortality.
At baseline, 4% and 31% of participants exhibited the MHO and MUNO subphenotypes, respectively. Four-year probability of MHO participants becoming MUO was 43% in women and 46% in men. Compared with MHNO, MHO participants had 1.28-fold (95% CI, 0.85 to 1.93) and 1.92-fold (95% CI, 1.38 to 2.68) higher odds of subclinical CVD and coronary artery calcification, respectively; corresponding values for MUNO were 1.95 (1.54 to 2.47) and 1.92 (1.38 to 2.68). During follow-up (median of 14 years), 231 participants developed diabetes, 784 hypertension, 423 CKD, 639 CVD, and 1296 died. Compared with MHNO, MHO conferred higher risks of diabetes [hazard ratio (HR), 4.69; 95% CI, 2.21 to 9.96] and hypertension (HR, 2.21; 95% CI, 1.66 to 2.94). Compared with MUO, MHO conferred lower risks of diabetes (0.21; 0.12 to 0.39), CVD (0.64; 0.43 to 0.95), and CKD (0.44; 0.27 to 0.73), but similar hypertension, cardiovascular mortality, and overall mortality risks.
Over time, most MHO participants developed metabolic abnormalities and clinical disease. The MHO subphenotype is a harbinger of future risk.
Obesity (body mass index [BMI] ≥30 kg/m2) is common and frequently coexists with metabolic abnormalities (1, 2). Obesity has been associated with adverse health outcomes; however, there is variability in the presence of metabolic disturbances among obese individuals, which may affect the obesity-related disease risk (3). Obese individuals with a low burden of metabolic abnormalities have been termed “metabolically healthy obese” (MHO) (4), a phenotype that may represent up to 40% of obese individuals (5, 6).
An increasing number of studies have examined the putative clinical and public health significance of the MHO phenotype. However, it remains unclear whether the MHO subphenotype is protective against obesity-related metabolic complications in comparison with other at-risk obesity subphenotypes (6–14). Indeed, prior reports on the relationships of MHO and clinical outcomes have yielded inconsistent results and have several limitations. These previous studies examined a limited spectrum of clinical outcomes (mainly focusing on diabetes and cardiovascular events), and they did not account for intraindividual changes over time in metabolic health and obesity status. Moreover, the potential variability of the MHO phenotype over time (15, 16) has not been examined comprehensively, and such variability may have contributed to the controversy on the clinical significance of the MHO concept (17). Studies examining the change of obesity subphenotypes over time have included extended transition periods (>4 years) over short observation periods (less than two decades) (15, 16, 18, 19), thus not always capturing all aspects of changes over the adult life course. In some cases, the variability of obesity subphenotypes was examined in women only (19).
In view of the aforementioned gaps in the literature, we evaluated participants in the Framingham Offspring study during two decades to characterize dynamic short- and long-term changes in obesity subphenotypes [defined using the Adult Treatment Panel III criteria (20)]. We also assessed the association of these subphenotypes with the prevalence of subclinical atherosclerotic disease cross-sectionally, and with the incidence of a wide range of disease outcomes prospectively.
Methods
Study sample
The design of the Framingham Offspring Study has been described elsewhere (21). The present investigation includes participants who attended at least one of the following examination cycles of the Framingham Offspring Study: 2 (1979 to 1983), 3 (1983 to 1987), 4 (1987 to 1991), 5 (1991 to 1995), 6 (1995 to 1998), and 7 (1998 to 2001). These cycles had available data on variables used to define metabolic health, and they allowed follow-up time for clinical outcomes after the last examination cycle attended. Figure 1 shows the design of the current investigation.
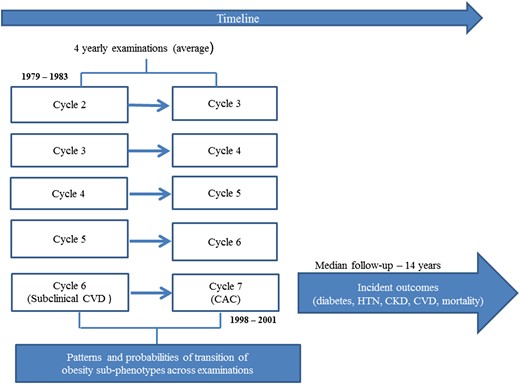
Study design. HTN, hypertension.
The Institutional Review Board of the Boston Medical Center approved the study protocol, and all participants provided written informed consent.
Definition of obesity subphenotypes
At each examination, investigators used a standardized protocol to measure height (to the nearest 0.25 inch) and weight (to the nearest pound). BMI was defined as weight (in kg) divided by height squared (m2). BMI was categorized into two subgroups: <30 kg/m2 (nonobese) and ≥30 kg/m2 (obese) (22).
We defined metabolic status using criteria proposed by the National Cholesterol Education Program—Adult Treatment Panel III (20). On the basis of previous literature (14), the absence of metabolic health was defined as the presence of two or more of the following conditions: high triglycerides [≥1.69 mmol/L (150 mg/dL)] or use of lipid-lowering drugs, elevated systolic blood pressure (≥130 mm Hg) or diastolic blood pressure (≥85 mm Hg) or use of antihypertensive drugs, elevated blood glucose [≥5.6 mmol/L (100 mg/dL)] or any use of medications for diabetes (insulin or oral glucose-lowering medications), and low high-density lipoprotein (HDL)–cholesterol [<1.03 mmol/L (40 mg/dL) in men and <1.29 mmol/L (50 mg/dL) in women]. The waist circumference (WC) criterion was not used because of collinearity with BMI (at examination cycle 7, the Pearson correlation coefficient between WC and BMI was 0.89, P < 0.0001) and lack of data availability on WC at earlier Framingham examination cycles. The performance of WC is comparable to that of BMI for predicting vascular risk (23) and cancer mortality (24, 25).
We combined the metabolic status and the BMI subgroups to create the following four subphenotypes (Table 1): metabolically healthy nonobese (MHNO), MHO, metabolically unhealthy nonobese (MUNO), and metabolically unhealthy obese (MUO). We defined a combined metabolic health status/BMI score at each examination (i.e., scoring 1 for MHNO, 2 for MHO, 3 for MUNO, and 4 for MUO). To account for the potential effect of the dynamic changes in obesity subphenotypes on outcomes, we also derived a summary averaged score for each participant during the entire follow-up period (sum of scores from the examinations attended, divided by the number of examinations attended), with a minimum overall score of 1 and a maximum score of 4.
Definition of Obesity Subphenotypes
| Metabolic Health | Obesity Status | |
|---|---|---|
| Nonobese: BMI <30 kg/m2 | Obese: BMI ≥30 kg/m2 | |
| Metabolically healthy | MHNO | MHO |
| Metabolically unhealthy | MUNO | MUO |
| Metabolic Health | Obesity Status | |
|---|---|---|
| Nonobese: BMI <30 kg/m2 | Obese: BMI ≥30 kg/m2 | |
| Metabolically healthy | MHNO | MHO |
| Metabolically unhealthy | MUNO | MUO |
Measurements
At each examination, self-administered questionnaires were used to collect information on lifestyle and medical history, including use of medications. Two blood pressure measurements were obtained 10 minutes apart while participants were seated, and the average of the two such measurements was used in the analysis. Fasting blood glucose, total cholesterol, HDL-cholesterol, low-density lipoprotein (LDL)–cholesterol, triglycerides, serum creatinine, and urinary albumin and creatinine were measured using standardized assays. The chronic kidney disease (CKD)–epidemiology collaboration equation was used to calculate the estimated glomerular filtration rate (26). Urinary albumin was indexed to urinary creatinine to account for differences in urine concentrations to derive the urinary albumin creatinine ratio (UACR; mg/g).
Subclinical cardiovascular disease
Subclinical cardiovascular disease (CVD) was assessed at the sixth examination cycle (1995 to 1998) and defined by use of a previously validated index (27) that included presence of at least one of the following: left ventricular systolic dysfunction (by echocardiography), left ventricular hypertrophy (by ECG or echocardiography), increased carotid intima–media thickness or stenosis, a reduced ankle–brachial index, and microalbuminuria. Coronary artery calcium (CAC) was assessed on participants at examination cycle 7 (1998 to 2001) (28). The presence of CAC was defined as calcification along the course of the coronary arteries with an Agatston score >100 (28).
Clinical outcomes
Framingham Heart Study participants are under continuous surveillance for the incidence of various disease outcomes. The present investigation assessed the following outcomes: diabetes, hypertension, CKD, CVD, cardiovascular mortality, cancer-related mortality, and all-cause mortality. Incidence of each disease outcome was assessed in individuals who were free of prevalent disease at the last examination they attended among cycles 2 (1979 to 1983) and 7 (1998 to 2001) with the follow-up accruing until the end of 2014. Incident CVD included fatal and nonfatal coronary heart, cerebrovascular disease, peripheral arterial disease, and heart failure (29). Incident diabetes, hypertension, and CKD were assessed on those free of disease at cycle 7 (1998 to 2001) with follow-up accruing for up to two examination cycles afterward.
Incident diabetes was defined as the development of a fasting blood glucose level ≥7.0 mmol/L (126 mg/dL) or the new use of glucose-lowering medications during follow-up (30). Hypertension during follow-up was defined using two different sets of criteria: using the Eighth Joint National Committee 2014 diagnostic criteria (31), as a systolic blood pressure ≥140 mm Hg or a diastolic blood pressure ≥90 mm Hg, or the use of antihypertensive medication; using the American College of Cardiology/American Heart Association 2017 diagnosis criteria (32), as a systolic blood pressure ≥130 mm Hg or a diastolic blood pressure ≥80 mm Hg, or the use of an antihypertensive. Incident CKD was defined as the presence of an estimated glomerular filtration rate <60 mL/min/1.73 m2 and/or microalbuminuria (26). Microalbuminuria was defined as a UACR of ≥25 mg/g in men and UACR ≥35 mg/g in women (33).
Statistical analysis
For the present investigation, 4657 eligible participants contributed 27,282 person-examinations. We excluded examinations lacking information on metabolic components (i.e., systolic blood pressure, diastolic blood pressure, use of antihypertensive drugs, fasting glucose, diabetes medications, blood triglyceride levels, HDL-cholesterol concentrations, use of lipid-lowering drugs, and BMI) used for defining the subphenotypes. Additionally, we excluded participants who attended only one examination cycle. For the analyses of incidence of various disease outcomes, we excluded participants with missing information on current smoking status or with that prevalent disease condition. Figure 2 shows the sample size used for each analysis.
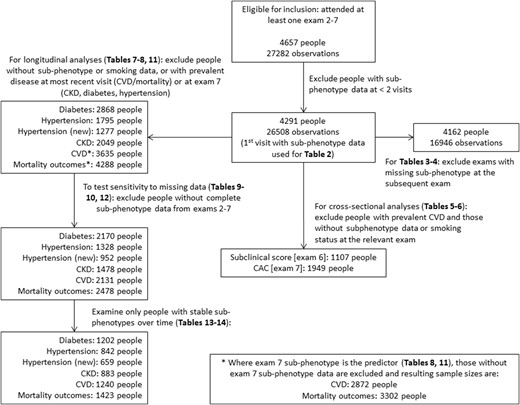
Summary of inclusions, exclusions, and sample sizes for each analysis. Hypertension is defined using the Eighth Joint National Committee (JNC-8) 2014 diagnostic criteria, and hypertension (new) is defined using the 2017 American College of Cardiology/American Heart Association criteria.
We evaluated the baseline characteristics (demographic and clinical) of 4291 participants across the obesity subphenotypes (MHO, MUO, MUNO, and MHNO). To assess the natural history of obesity subphenotypes, we constructed transition matrices to cross-classify these subphenotypes (MHNO, MHO, MUNO, and MUO) at baseline and the next examination attended (pairs of cycles 2/3, 3/4, 4/5, 5/6, and 6/7; pairs of examinations were included in the analysis when data on obesity subphenotypes were available at the earlier and immediately subsequent examination). We modeled the probability of transitioning from one subphenotype to any of the three remaining subphenotypes at each examination cycle using a multivariable regression model with baseline subphenotype as the independent variable and follow-up subphenotype as the dependent variable. We included age at baseline and the baseline examination cycle number (as a categorical variable) in the model as covariates. The probabilities were estimated using the mean of all ages at baseline (respective baseline for each participant 51.4 years) and the mode of baseline examination (examination 4) across all baseline follow-up pairs. We treated the pairs of visits as independent, even though participants could contribute multiple pairs to the analysis, to preserve model stability. However, previous studies have also modeled transition probabilities with similar assumptions of independence between visit pairs (19, 34). Such an approach was only used to assess the transition probabilities.
We tested cross-sectional associations of obesity subphenotypes with subclinical CVD at examination cycle 6, and with CAC at examination cycle 7, using multivariable logistic regression models. To estimate the association of obesity subphenotypes and incident outcomes, we used the latest of the attended examinations of cycles 2 to 7, and follow-up extended until examinations 8 or 9 (for diabetes, hypertension, or CKD outcomes that are defined at examinations), or until last contact (for CVD or death, which are captured with exact date of occurrence) up to 2014. We used multivariable Cox proportional hazard models with discrete time intervals to predict time to diabetes, hypertension, and CKD, because these were assessed at each examination cycle. To predict time to CVD or mortality, we fitted multivariable Cox proportional hazards regression models, after confirming that the assumption of proportionality of hazards was met for both outcomes.
For all models (logistic or Cox proportional hazard), predictors were: (1) metabolic-BMI status score up to examination cycle 7 (examination cycle 6 for the subclinical CVD outcome), adjusting for age, sex, and current smoking status; (2) dichotomous high (above median for pooled sexes) vs low (at or below median) metabolic-BMI status score, adjusting for age, sex, and current smoking status; and (3) obesity subphenotype (categorical) at examination cycle 7 (examination cycle 6 for the subclinical CVD outcome), adjusting for age, sex, and current smoking status.
We conducted an analysis restricting our assessment of the association between obesity subphenotypes and outcomes to participants with complete data at all the examination cycles from 2 to 7. Models with subphenotypes as the independent variable used MHNO as the referent group. We additionally compared outcomes between the MHO to MUO subphenotypes by repeating these regression models with MUO as the reference group, and reporting the relevant ORs (for cross-sectional analyses) or hazard ratios (HRs) (for prospective analyses).
All analyses were performed using SAS version 9.4 (SAS Institute, Cary, NR). All P values were based on two-sided tests. Because we ran models to test the association of obesity subphenotypes with seven outcomes, we used a Bonferroni correction and considered P values for the primary outcomes analyses to be statistically significant at <0.05/7 = 0.007.
Results
Sample characteristics
The baseline characteristics of our samples at their first visit (n = 4291 participants; mean age, 44.7 years; 52.1% women) are shown in Table 2 according to obesity subphenotypes. Overall, 54.7% of observation participants (n = 2349) were MHNO whereas the MHO and MUNO phenotypes represented 4.4% (n = 187) and 30.8% (n = 1323) of the sample, respectively, at the first visit. Participants with MUNO were more often men, smokers, and had a higher prevalence of diabetes, hypertension, and CVD compared with MHNO and MHO participants, and they were more commonly on medications for these conditions (antihypertensive medications, and lipid-lowering medications).
Baseline Characteristics at First Visit With Obesity Subphenotype Data Available (Examinations 2 to 7, From 1979–1983 to 1998–2001), by Obesity Subphenotypes
| Characteristics (N = 4291 Participants) | Nonobese | Obese | ||
|---|---|---|---|---|
| Metabolically Healthya (2349, 54.7%) | Metabolically Unhealthya (1323, 30.8%) | Metabolically Healthya (187, 4.4%) | Metabolically Unhealthya (432, 10.1%) | |
| Age, y | 42 (10) | 48 (10) | 45 (10) | 48 (9) |
| Women | 1480 (63) | 470 (36) | 108 (58) | 177 (41) |
| Current smoking | 806 (34) | 511 (39) | 48 (26) | 158 (37) |
| BMI, kg/m2 | 23.4 (21.4, 25.7) | 26.0 (24.0, 27.7) | 32.5 (31.4, 35.2) | 32.8 (31.4, 35.7) |
| Systolic blood pressure, mm Hg | 115 (14) | 131 (16) | 125 (16) | 134 (16) |
| Diastolic blood pressure, mm Hg | 74 (8) | 82 (9) | 80 (9) | 85 (9) |
| Hypertension (2014 JNC-8 definition) | 192 (8.2) | 560 (42.3) | 49 (26.2) | 236 (54.8) |
| Hypertension (2017 ACC/AHA definition) | 657 (28.0) | 1011 (76.4) | 107 (57.2) | 366 (84.7) |
| Use of antihypertensive medications | 65 (2.8) | 261 (19.7) | 22 (11.8) | 113 (26.2) |
| Total cholesterol, mmol/L | 5.1 (0.9) | 5.7 (1.1) | 5.1 (0.9) | 5.7 (1.0) |
| HDL-cholesterol, mmol/L | 1.4 (0.4) | 1.1 (0.3) | 1.3 (0.3) | 1.0 (0.3) |
| LDL-cholesterol, mmol/L | 3.3 (0.9) | 3.8 (1.0) | 3.4 (0.8) | 3.8 (0.9) |
| Triglycerides, mmol/L | 0.8 (0.6, 1.1) | 1.5 (1.0, 2.1) | 0.9 (0.7, 1.2) | 1.7 (1.3, 2.3) |
| Use of lipid-lowering drugs | 3 (0.1) | 30 (2.3) | 0 (0.0) | 8 (1.9) |
| Diabetes | 11 (0.5) | 94 (7.2) | 1 (0.6) | 58 (13.7) |
| Fasting glucose, mmol/L | 5.0 (4.8, 5.3) | 5.7 (5.3, 6.0) | 5.2 (5.0, 5.4) | 5.8 (5.3, 6.2) |
| History of CVD | 43 (1.8) | 95 (7.2) | 7 (3.7) | 30 (6.9) |
Data are mean (SD) or median (quartile 1, quartile 3) for continuous variables, and number (%) for categorical variables.
Abbreviations: ACC, American College of Cardiology; AHA, American Heart Association; JNC-8, Eighth Joint National Committee.
Definitions are provided in the Methods section.
Natural history of obesity subphenotypes over time
For each obesity subphenotype, >50% of individuals in these categories remained in the same category from one examination cycle to the next (4-year period), that is, 77.6% of those with the MHNO phenotype, 67.9% for MUNO, 51.1% MHO, and 76.8% for the MUO phenotype (diagonal cells in Table 3). One-fourth or more participants changed their phenotypes (“off-diagonal” cells in Table 3). The MHO phenotype appeared to be the obesity subphenotype most subject to change over time.
Frequency and Proportion of Transitions Between Obesity Subphenotypes During the Following Pairs of Examination Cycles: 2/3, 3/4, 4/5, 5/6, and 6/7
| Obesity Subphenotype at Baseline | Obesity Subphenotype at Follow-Up Examinationa | Total | |||
|---|---|---|---|---|---|
| MHNO | MUNO | MHO | MUO | ||
| MHNO | 6668 (77.6) | 1416 (16.5) | 301 (3.5) | 202 (2.3) | 8587 |
| Men | 2328 (71.2) | 713 (21.8) | 127 (3.9) | 100 (3.1) | 3268 |
| Women | 4340 (81.6) | 703 (13.2) | 174 (3.2) | 102 (1.9) | 5319 |
| MUNO | 1050 (21.8) | 3266 (67.9) | 61 (1.3) | 435 (9.0) | 4812 |
| Men | 570 (19.6) | 2051 (70.6) | 34 (1.2) | 251 (8.6) | 2906 |
| Women | 480 (25.2) | 1215 (63.8) | 27 (1.4) | 184 (9.7) | 1906 |
| MHO | 99 (9.0) | 26 (2.4) | 564 (51.1) | 415 (37.6) | 1104 |
| Men | 46 (8.7) | 8 (1.5) | 272 (51.5) | 202 (38.3) | 528 |
| Women | 53 (9.2) | 18 (3.1) | 292 (50.7) | 213 (37.0) | 576 |
| MUO | 81 (3.3) | 222 (9.1) | 263 (10.8) | 1877 (76.8) | 2443 |
| Men | 47 (3.4) | 134 (9.8) | 140 (10.2) | 1047 (76.5) | 1368 |
| Women | 34 (3.2) | 88 (8.2) | 123 (11.4) | 830 (77.2) | 1075 |
The data represent the number (%) of people in the baseline state at a given examination to transition to the follow-up state at the subsequent examination. Individuals may contribute up to five pairs of baseline follow-up observations.
The 4-year predicted transition probabilities are presented in Table 4. Among men and women who were MHO, the 4-year probability of transitioning to the MUO phenotype was similar to the probability of staying in the MHO phenotype. For the MHNO, MUNO, and MUO phenotypes, the 4-year probability of remaining in the same phenotype was higher than the probabilities of transitioning to any other phenotype, in both men and women.
Transition Probabilities of Obesity Subphenotype Status From Baseline (Start of the Observation Period) to Follow-Up Adjusted for Baseline Age, Baseline Examination, and Sex
| Obesity Subphenotype at Baseline | Obesity Subphenotype at Follow-Up Examinationa | |||
|---|---|---|---|---|
| MHNO | MUNO | MHO | MUO | |
| MHNO | ||||
| Men (n = 3268) | 0.66 (0.64–0.68) | 0.27 (0.25–0.29) | 0.03 (0.03–0.04) | 0.03 (0.03–0.04) |
| Women (n = 5319) | 0.77 (0.75–0.78) | 0.17 (0.16–0.19) | 0.03 (0.02–0.04) | 0.03 (0.02–0.03) |
| MUNO | ||||
| Men (n = 2906) | 0.15 (0.13–0.16) | 0.74 (0.72–0.76) | 0.01 (0.01–0.01) | 0.10 (0.09–0.12) |
| Women (n = 1906) | 0.23 (0.21–0.25) | 0.64 (0.62–0.67) | 0.01 (0.01–0.02) | 0.11 (0.09–0.13) |
| MHO | ||||
| Men (n = 528) | 0.07 (0.05–0.09) | 0.03 (0.02–0.04) | 0.44 (0.39–0.49) | 0.46 (0.42–0.51) |
| Women (n = 576) | 0.09 (0.07–0.11) | 0.02 (0.01–0.03) | 0.45 (0.41–0.50) | 0.43 (0.39–0.48) |
| MUO | ||||
| Men (n = 1368) | 0.02 (0.02–0.03) | 0.09 (0.08–0.11) | 0.08 (0.07–0.10) | 0.80 (0.78–0.83) |
| Women (n = 1075) | 0.03 (0.02–0.04) | 0.07 (0.06–0.09) | 0.09 (0.07–0.11) | 0.81 (0.78–0.83) |
Data are expected proportion (95% CI).
The data used to model these transition probabilities are the pooled transition data capturing the potential change of obesity subphenotype status from each examination to the subsequent examination from 1979–1983 to 1998–2001 (total of six examinations).
Obesity subphenotypes and subclinical disease
The associations of obesity subphenotypes and subclinical CVD are shown in Table 5. Compared with the MHNO phenotype, MHO was associated with a 28% (statistically nonsignificant) and a 94% (statistically significant) higher odds of subclinical CVD and CAC, respectively. MUNO was associated with 95% and 92% relatively higher odds of subclinical CVD and CAC, respectively. A unit change in the metabolic status–BMI score and a high score were both associated with increased odds of subclinical CVD and CAC (Table 5).
Cross-Sectional Association of Obesity Subphenotypes and Subclinical Outcomes
| Outcomes | Events/n | Unadjusted OR (95% CI) | Adjusted OR (95% CI)a |
|---|---|---|---|
| Subclinical CVD score: examination 6 (1995–1998) | |||
| Metabolic status–BMI scoreb | 687/1949 | 1.77 (1.59–1.97) | 1.55 (1.38–1.75) |
| Dichotomized metabolic status–BMI score | |||
| High | 2.50 (2.06–3.03) | 1.98 (1.61–2.44) | |
| Low | 1.00 (reference) | 1.00 (reference) | |
| Obesity subphenotypes at examination 6 | |||
| MHNO | 227/893 | 1.00 (reference) | 1.00 (reference) |
| MHO | 42/149 | 1.15 (0.78–1.70) | 1.28 (0.85–1.93) |
| MUNO | 286/616 | 2.54 (2.04–3.16) | 1.95 (1.54–2.47) |
| MUO | 132/291 | 2.44 (1.85–3.21) | 2.26 (1.69–3.03) |
| CAC: examination 7 (1998–2001) | |||
| Metabolic status–BMI scoreb | 487/1107 | 2.61 (2.24–3.04) | 2.15 (1.82–2.53) |
| Dichotomized metabolic status–BMI score | |||
| High | 4.32 (3.32–5.61) | 3.24 (2.43–4.31) | |
| Low | 1.00 (reference) | 1.00 (reference) | |
| Obesity subphenotypes at examination 7 | |||
| MHNO | 146/504 | 1.00 (reference) | 1.00 (reference) |
| MHO | 41/95 | 1.86 (1.19–2.92) | 1.94 (1.18–3.19) |
| MUNO | 162/295 | 2.99 (2.21–4.03) | 1.92 (1.38–2.68) |
| MUO | 138/213 | 4.51 (3.21–6.34) | 3.81 (2.62–5.54) |
Adjusted for age, sex, and current smoking.
Metabolic status–BMI score is an average score calculated as the sum of scores corresponding to each metabolic–BMI status at each examination (MHNO = 1, MHO = 2, MUNO = 3, and MUO = 4) divided by the number of attended examinations. A high score is a score above the median.
Compared with the MUO phenotype, MHO was associated with 43% and 49% lower odds of subclinical CVD and CAC, respectively, which was statistically significant (Table 6).
Cross-Sectional Comparison of Subclinical Outcomes Between the MHO and MUO Phenotypes
| Outcomes | Events/n in MHO Group | Unadjusted OR (95% CI) | Adjusted OR (95% CI)a |
|---|---|---|---|
| Subclinical CVD score: examination 6 (1995–1998) | |||
| Obesity subphenotypes at examination 6 | |||
| MHO vs MUO | 42/149 | 0.47 (0.31–0.72) | 0.57 (0.36–0.89) |
| CAC: examination 7 (1998–2001) | |||
| Obesity subphenotypes at examination 7 | |||
| MHO vs MUO | 41/95 | 0.41 (0.25–0.68) | 0.51 (0.29–0.88) |
ORs are from the models in Table 5 relating all obesity phenotypes to subclinical outcomes but with MUO as the reference group; only the MHO vs MUO comparisons are shown.
Adjusted for age, sex, and current smoking.
Obesity subphenotypes and clinical outcomes
The median follow-up was 13.8 and 14.4 years for analyses of CVD and all-cause mortality, respectively. Table 7 shows the associations between the derived metabolic status–BMI score and incident outcomes. After adjustment for age, sex, and current smoking, each unit change in the metabolic status–BMI score and a higher score (dichotomized) were associated with at least a fourfold higher risk of incident diabetes, as well as significantly higher relative risks of hypertension, CKD, CVD, cardiovascular mortality, and all-cause mortality, as well as a statistically nonsignificant increase in cancer mortality. Table 8 presents the associations of obesity subphenotypes (at the relevant baseline examination) and other incident outcomes. Compared with MHNO, MHO individuals had fivefold and twofold higher risks of diabetes and hypertension, respectively, as well as statistically nonsignificant higher relative risks of CVD, cancer mortality, cardiovascular mortality, and all-cause mortality, and such individuals were not associated with increased CKD risk. In comparison with MHNO, those with MUNO had eightfold and twofold higher risks of diabetes and hypertension, respectively, as well as statistically nonsignificant higher relative risks of CKD, CVD, cancer mortality, cardiovascular mortality, and all-cause mortality.
Association of the Summary Score of Obesity Subphenotypes Across Attended Examinations and Outcomes During Follow-Up (From 1998–2001 to 2014)
| Outcomes | Obesity Subphenotypes Over Adulthood (From 1979–1983 to 1998–2001) | ||
|---|---|---|---|
| Events/n | Unadjusted HR (95% CI) | Adjusted HR (95% CI)a | |
| Type 2 diabetes | 231/2868 | ||
| Metabolic status–BMI scoreb | 3.85 (3.26–4.54)c | 3.85 (3.24–4.57)c | |
| Dichotomized metabolic status–BMI score | |||
| High | 10.38 (7.31–14.75)c | 9.87 (6.87–14.17)c | |
| Low | 1.00 (reference) | 1.00 (reference) | |
| Hypertension (2014 JNC-8 criteria) | |||
| Metabolic status–BMI scoreb | 784/1795 | 2.00 (1.79–2.24)c | 1.90 (1.69–2.14)c |
| Dichotomized metabolic status–BMI score | |||
| High | 2.91 (2.38–3.55)c | 2.64 (2.15–3.26)c | |
| Low | 1.00 (reference) | 1.00 (reference) | |
| Hypertension (2017 ACC/AHA criteria) | |||
| Metabolic status–BMI scoreb | 673/1277 | 1.75 (1.51–2.02)c | 1.61 (1.38–1.89)c |
| Dichotomized metabolic status–BMI score | |||
| High | 2.32 (1.78–3.02)c | 2.00 (1.51–2.63)c | |
| Low | 1.00 (reference) | 1.00 (reference) | |
| CKD/microalbuminuria | 423/2049 | ||
| Metabolic status–BMI scoreb | 1.60 (1.43–1.78)c | 1.41 (1.25–1.58)c | |
| Dichotomized metabolic status–BMI score | |||
| High | 2.28 (1.85–2.81)c | 1.83 (1.46–2.28)c | |
| Low | 1.00 (reference) | 1.00 (reference) | |
| CVD | 639/3635 | ||
| Metabolic status–BMI scoreb | 1.74 (1.61–1.89)c | 1.51 (1.39–1.65)c | |
| Dichotomized metabolic status–BMI score | |||
| High | 2.80 (2.38–3.28)c | 2.10 (1.78–2.48)c | |
| Low | 1.00 (reference) | 1.00 (reference) | |
| Cancer mortality | 461/4288 | ||
| Metabolic status–BMI scoreb | 1.39 (1.27–1.52)c | 1.14 (1.03–1.26) | |
| Dichotomized metabolic status–BMI score | |||
| High | 1.71 (1.42–2.05)c | 1.19 (0.99–1.44) | |
| Low | 1.00 (reference) | 1.00 (reference) | |
| Cardiovascular mortality | 299/4288 | ||
| Metabolic status–BMI scoreb | 2.02 (1.79–2.27)c | 1.62 (1.43–1.84)c | |
| Dichotomized metabolic status–BMI score | |||
| High | 3.61 (2.80–4.66)c | 2.23 (1.72–2.89)c | |
| Low | 1.00 (reference) | 1.00 (reference) | |
| All-cause mortality | 1296/4288 | ||
| Metabolic status–BMI scoreb | 1.54 (1.46–1.63)c | 1.27 (1.20–1.35)c | |
| Dichotomized metabolic status–BMI score | |||
| High | 2.16 (1.93–2.42)c | 1.47 (1.31–1.65)c | |
| Low | 1.00 (reference) | 1.00 (reference) | |
Abbreviations: ACC, American College of Cardiology; AHA, American Heart Association; JNC-8, Eighth Joint National Committee.
Adjusted for age, sex, and current smoking;
Metabolic status–BMI score is the sum of scores corresponding to each metabolic–BMI status at each examination (MHNO = 1, MHO = 2, MUNO = 3, and MUO = 4) divided by the number of attended examinations. A high score is defined as a score above the median.
Association was significant at the Bonferroni-adjusted α level (P < 0.007).
Association of Obesity Subphenotypes and Outcomes During Follow-Up (From 1998–2001 to 2014)
| Outcomes | Obesity Subphenotypes at Examination 7 (in 1998–2001) | ||
|---|---|---|---|
| Events/n | Unadjusted HR (95% CI) | Adjusted HR (95% CI)a | |
| Type 2 diabetes | |||
| MHNO | 15/1191 | 1.00 (reference) | 1.00 (reference) |
| MHO | 13/220 | 4.77 (2.25–10.11)b | 4.69 (2.21–9.96)b |
| MUNO | 81/903 | 8.98 (5.15–15.66)b | 7.86 (4.47–13.82)b |
| MUO | 122/554 | 23.86 (13.85–41.11)b | 21.93 (12.68–37.94)b |
| Hypertension (2014 JNC-8 criteria) | |||
| MHNO | 364/1022 | 1.00 (reference) | 1.00 (reference) |
| MHO | 98/189 | 2.04 (1.54–2.70)b | 2.21 (1.66–2.94)b |
| MUNO | 203/374 | 2.58 (2.08–3.22)b | 2.30 (1.83–2.90)b |
| MUO | 119/210 | 2.84 (2.16–3.73)b | 2.85 (2.15–3.78)b |
| Hypertension (2017 ACC/AHA criteria) | |||
| MHNO | 419/847 | 1.00 (reference) | 1.00 (reference) |
| MHO | 86/133 | 1.97 (1.42–2.73)b | 1.98 (1.42–2.77)b |
| MUNO | 111/196 | 1.84 (1.38–2.46)b | 1.63 (1.20–2.20)b |
| MUO | 57/101 | 1.91 (1.29–2.83)b | 1.81 (1.21–2.71)b |
| CKD/microalbuminuria | |||
| MHNO | 129/848 | 1.00 (reference) | 1.00 (reference) |
| MHO | 22/162 | 0.86 (0.54–1.38) | 0.97 (0.60–1.58) |
| MUNO | 145/608 | 1.98 (1.53–2.55)b | 1.44 (1.10–1.89) |
| MUO | 127/431 | 2.59 (1.98–3.38)b | 2.19 (1.65–2.90)b |
| CVD | |||
| MHNO | 125/1169 | 1.00 (reference) | 1.00 (reference) |
| MHO | 29/227 | 1.22 (0.82–1.83) | 1.38 (0.92–2.07) |
| MUNO | 180/859 | 2.19 (1.75–2.76)b | 1.58 (1.25–2.00)b |
| MUO | 153/617 | 2.60 (2.05–3.29)b | 2.17 (1.71–2.76)b |
| Cancer mortality | |||
| MHNO | 67/1234 | 1.00 (reference) | 1.00 (reference) |
| MHO | 16/243 | 1.21 (0.70–2.09) | 1.26 (0.73–2.17) |
| MUNO | 109/1073 | 2.15 (1.59–2.92)b | 1.31 (0.96–1.79) |
| MUO | 67/752 | 1.80 (1.29–2.53)b | 1.36 (0.97–1.92) |
| Cardiovascular mortality | |||
| MHNO | 32/1234 | 1.00 (reference) | 1.00 (reference) |
| MHO | 6/243 | 0.96 (0.40–2.28) | 1.17 (0.49–2.81) |
| MUNO | 79/1073 | 3.28 (2.17–4.94)b | 1.63 (1.07–2.49) |
| MUO | 44/752 | 2.50 (1.58–3.94)b | 1.74 (1.10–2.75) |
| All-cause mortality | |||
| MHNO | 172/1234 | 1.00 (reference) | 1.00 (reference) |
| MHO | 34/243 | 1.01 (0.70–1.46) | 1.20 (0.83–1.73) |
| MUNO | 319/1073 | 2.37 (1.97–2.85)b | 1.37 (1.13–1.66)b |
| MUO | 184/752 | 1.88 (1.53–2.32)b | 1.40 (1.14–1.73)b |
Abbreviations: ACC, American College of Cardiology; AHA, American Heart Association; JNC-8, Eighth Joint National Committee.
Adjusted for age, sex, and current smoking.
Association was significant at the Bonferroni-adjusted α level (P < 0.007).
A sensitivity analysis with restriction of our sample to participants with complete data at all examination cycles (from 2 to 7) showed similar associations between the metabolic status–BMI score and outcomes and between each of the obesity subphenotypes assessed at the last follow-up examination and outcomes (Tables 9 and10).
Association of the Summary Score for Obesity Subphenotypes During Attended Examinations and Outcomes During Follow-Up (1998–2001 to 2011–2014) Among Participants With Complete Data From Baseline to Last Examination (1987–1991 to 1998–2001)
| Outcomes | Obesity Subphenotypes During Adulthood (From 1979–1983 to 1998–2001) | ||
|---|---|---|---|
| Events/n | Unadjusted HR (95% CI) | Adjusted HR (95% CI)a | |
| Type 2 diabetes | |||
| Metabolic status–BMI scoreb | 186/2170 | 3.78 (3.15–4.53)c | 3.80 (3.14–4.59)c |
| Dichotomized metabolic status–BMI score | |||
| High | 10.59 (7.18–15.61)c | 10.32 (6.91–15.41)c | |
| Low | 1.00 (reference) | 1.00 (reference) | |
| Hypertension (2014 JNC-8 criteria) | |||
| Metabolic status–BMI scoreb | 614/1328 | 1.93 (1.69–2.20)c | 1.86 (1.62–2.14)c |
| Dichotomized metabolic status–BMI score | |||
| High | 2.74 (2.16–3.46)c | 2.54 (1.99–3.25)c | |
| Low | 1.00 (reference) | 1.00 (reference) | |
| Hypertension (2017 ACC/AHA criteria) | |||
| Metabolic status–BMI scoreb | 519/952 | 1.84 (1.54–2.18)c | 1.75 (1.46–2.11)c |
| Dichotomized metabolic status–BMI score | |||
| High | 2.52 (1.84–3.45)c | 2.30 (1.65–3.20)c | |
| Low | 1.00 (reference) | 1.00 (reference) | |
| CKD/microalbuminuria | |||
| Metabolic status–BMI scoreb | 329/1478 | 1.58 (1.39–1.79)c | 1.42 (1.24–1.62)c |
| Dichotomized metabolic status–BMI score | |||
| High | 2.22 (1.75–2.81)c | 1.84 (1.43–2.38)c | |
| Low | 1.00 (reference) | 1.00 (reference) | |
| CVD | |||
| Metabolic status–BMI scoreb | 380/2131 | 1.77 (1.59–1.96)c | 1.55 (1.39–1.72)c |
| Dichotomized metabolic status–BMI score | |||
| High | 2.71 (2.20–3.33)c | 2.13 (1.72–2.63)c | |
| Low | 1.00 (reference) | 1.00 (reference) | |
| Cancer mortality | |||
| Metabolic status–BMI scoreb | 204/2478 | 1.40 (1.21–1.61)c | 1.13 (0.97–1.31) |
| Dichotomized metabolic status–BMI score | |||
| High | 1.69 (1.29–2.23)c | 1.18 (0.89–1.57) | |
| Low | 1.00 (reference) | 1.00 (reference) | |
| Cardiovascular mortality | |||
| Metabolic status–BMI scoreb | 124/2478 | 1.95 (1.63–2.35)c | 1.55 (1.28–1.89)c |
| Dichotomized metabolic status–BMI score | |||
| High | 3.06 (2.10–4.46)c | 1.94 (1.33–2.84)c | |
| Low | 1.00 (reference) | 1.00 (reference) | |
| All-cause mortality | |||
| Metabolic status–BMI scoreb | 555/2478 | 1.61 (1.48–1.76)c | 1.30 (1.19–1.42)c |
| Dichotomized metabolic status–BMI score | |||
| High | 2.32 (1.96–2.76)c | 1.55 (1.30–1.85)c | |
| Low | 1.00 (reference) | 1.00 (reference) | |
Abbreviations: ACC, American College of Cardiology; AHA, American Heart Association; JNC-8: Eighth Joint National Committee.
Adjusted for age, sex, and current smoking.
Metabolic status–BMI score is an average score calculated as the sum of scores corresponding to each metabolic–BMI status at each examination (MHNO = 1, MHO = 2, MUNO = 3, and MUO = 4) divided by the number of attended examinations. A high score is a score above the median.
Association was significant at the Bonferroni-adjusted α level (P < 0.007).
Association of Obesity Subphenotypes and Outcomes During Follow-Up (1998–2001 to 2011–2014) Among Participants With Complete Data From Baseline to Last Examination (1987–1991 to 1998–2001)
| Outcomes | Obesity Subphenotypes at Examination 7 (in 1998–2001) | ||
|---|---|---|---|
| Events/n | Unadjusted HR (95% CI) | Adjusted HR (95% CI)a | |
| Type 2 diabetes | |||
| MHNO | 9/884 | 1.00 (reference) | 1.00 (reference) |
| MHO | 9/156 | 5.58 (2.19–14.18)b | 5.54 (2.17–14.10)b |
| MUNO | 68/710 | 11.55 (5.73–23.26)b | 10.36 (5.11–21.02)b |
| MUO | 100/420 | 31.80 (15.95–63.40)b | 30.02 (14.99–60.13)b |
| Hypertension (2014 JNC-8 criteria) | |||
| MHNO | 288/757 | 1.00 (reference) | 1.00 (reference) |
| MHO | 77/135 | 2.14 (1.55–2.95)b | 2.36 (1.70–3.28)b |
| MUNO | 162/279 | 2.57 (2.00–3.30)b | 2.34 (1.80–3.03)b |
| MUO | 87/157 | 2.48 (1.81–3.40)b | 2.62 (1.89–3.63)b |
| Hypertension (2017 ACC/AHA criteria) | |||
| MHNO | 318/628 | 1.00 (reference) | 1.00 (reference) |
| MHO | 67/96 | 2.16 (1.47–3.16)b | 2.26 (1.53–3.34)b |
| MUNO | 91/151 | 2.08 (1.49–2.91)b | 1.93 (1.37–2.73)b |
| MUO | 43/77 | 1.79 (1.14–2.81) | 1.80 (1.13–2.85) |
| CKD/microalbuminuria | |||
| MHNO | 96/601 | 1.00 (reference) | 1.00 (reference) |
| MHO | 17/112 | 0.91 (0.53–1.56) | 1.01 (0.58–1.77) |
| MUNO | 121/459 | 2.03 (1.52–2.71)b | 1.52 (1.12–2.06) |
| MUO | 95/306 | 2.60 (1.91–3.55)b | 2.35 (1.69–3.27)b |
| CVD | |||
| MHNO | 98/862 | 1.00 (reference) | 1.00 (reference) |
| MHO | 20/159 | 1.11 (0.68–1.79) | 1.26 (0.78–2.04) |
| MUNO | 137/659 | 2.01 (1.55–2.61)b | 1.51 (1.16–1.97)b |
| MUO | 125/451 | 2.74 (2.10–3.57)b | 2.37 (1.81–3.09)b |
| Cancer mortality | |||
| MHNO | 55/913 | 1.00 (reference) | 1.00 (reference) |
| MHO | 13/172 | 1.23 (0.67–2.25) | 1.33 (0.72–2.44) |
| MUNO | 84/832 | 1.90 (1.35–2.67)b | 1.21 (0.86–1.72) |
| MUO | 52/561 | 1.69 (1.15–2.46)b | 1.32 (0.90–1.94) |
| Cardiovascular mortality | |||
| MHNO | 28/913 | 1.00 (reference) | 1.00 (reference) |
| MHO | 3/172 | 0.56 (0.17–1.86) | 0.78 (0.24–2.59) |
| MUNO | 59/832 | 2.63 (1.68–4.12)b | 1.43 (0.90–2.26) |
| MUO | 34/561 | 2.19 (1.33–3.61)b | 1.62 (0.98–2.68) |
| All-cause mortality | |||
| MHNO | 138/913 | 1.00 (reference) | 1.00 (reference) |
| MHO | 24/172 | 0.92 (0.59–1.41) | 1.17 (0.76–1.81) |
| MUNO | 245/832 | 2.14 (1.74–2.64)b | 1.31 (1.06–1.62) |
| MUO | 148/561 | 1.86 (1.48–2.35)b | 1.44 (1.14–1.82)b |
Abbreviations: ACC, American College of Cardiology; AHA, American Heart Association; JNC-8, Eighth Joint National Committee.
Adjusted for age, sex, and current smoking.
Association was significant at the Bonferroni-adjusted α level (P < 0.007).
The use of an alternative definition of hypertension (based on the most recent 2017 American College of Cardiology/American Heart Association) led to a slight attenuation of the magnitude of the associations between the metabolic status–BMI score or the obesity subphenotypes and incident hypertension. However, this did not generally affect the statistical significance of these associations (Tables 7–10).
Compared with the MUO subphenotype, MHO individuals had statistically significant 79%, 56%, and 36% lower risks of diabetes, CKD, and CVD, respectively; however, they had similar risks of hypertension, cancer mortality, cardiovascular mortality, and all-cause mortality (Table 11). A similar pattern was observed when we restricted the analyses to participants with complete data at all examination cycles from 2 to 7 (Table 12).
Comparison of Outcomes During Follow-Up (from 1998–2001 to 2014) Between the MHO and MUO Subphenotypes
| Outcomes | Obesity Subphenotypes at Examination 7 (in 1998–2001) | ||
|---|---|---|---|
| Events/n in MHO Group | Unadjusted HR (95% CI) | Adjusted HR (95% CI)a | |
| Type 2 diabetes | 13/220 | 0.20 (0.11–0.36) | 0.21 (0.12–0.39) |
| Hypertension (2014 JNC-8 criteria) | 98/189 | 0.72 (0.51–1.02) | 0.77 (0.54–1.11) |
| Hypertension (2017 ACC/AHA criteria) | 86/133 | 1.03 (0.64–1.67) | 1.09 (0.67–1.78) |
| CKD/microalbuminuria | 22/162 | 0.33 (0.21–0.54) | 0.44 (0.27–0.73) |
| CVD | 29/227 | 0.47 (0.32–0.70) | 0.64 (0.43–0.95) |
| Cancer mortality | 16/243 | 0.67 (0.39–1.16) | 0.92 (0.53–1.59) |
| Cardiovascular mortality | 6/243 | 0.38 (0.16–0.90) | 0.67 (0.29–1.59) |
| All-cause mortality | 34/243 | 0.54 (0.37–0.78) | 0.86 (0.59–1.24) |
HRs are from the models in Table 7 relating all obesity phenotypes to subclinical outcomes but with MUO as the reference group; only the MHO vs MUO comparisons are shown.
Abbreviations: ACC, American College of Cardiology; AHA, American Heart Association; JNC-8: Eighth Joint National Committee.
Adjusted for age, sex, and current smoking.
Comparison of Outcomes During Follow-Up (From 1998–2001 To 2014) Between the MHO and MUO Subphenotypes, Among Participants With Complete Data From Baseline to Last Examination (1987–1991 to 1998–2001)
| Outcomes | Obesity Subphenotypes at Examination 7 (in 1998–2001) | ||
|---|---|---|---|
| Events/n in MHO Group | Unadjusted HR (95% CI) | Adjusted HR (95% CI)a | |
| Type 2 diabetes | 9/156 | 0.18 (0.09–0.35) | 0.18 (0.09–0.37) |
| Hypertension (2014 JNC-8 criteria) | 77/135 | 0.86 (0.57–1.30) | 0.90 (0.59–1.37) |
| Hypertension (2017 ACC/AHA criteria) | 67/96 | 1.20 (0.69–2.10) | 1.26 (0.72–2.22) |
| CKD/microalbuminuria | 17/112 | 0.35 (0.20–0.60) | 0.43 (0.24–0.76) |
| CVD | 20/159 | 0.40 (0.25–0.65) | 0.53 (0.33–0.86) |
| Cancer mortality | 13/172 | 0.73 (0.40–1.34) | 1.00 (0.54–1.85) |
| Cardiovascular mortality | 3/172 | 0.26 (0.08–0.84) | 0.48 (0.15–1.58) |
| All-cause mortality | 24/172 | 0.49 (0.32–0.76) | 0.81 (0.53–1.25) |
HRs are from the models in Table 8 relating all obesity phenotypes to subclinical outcomes but with MUO as the reference group; only the MHO vs MUO comparisons are shown.
Abbreviations: ACC, American College of Cardiology; AHA, American Heart Association; JNC-8: Eighth Joint National Committee.
Adjusted for age, sex, and current smoking.
Analyses of the risks of various conditions using a restricted sample of participants with stable phenotypes (from examination 2 to 7) are shown in Tables 13 and 14. Compared with MHNO, MHO individuals had higher risk of hypertension (2.4-fold) and CVD events (2.2-fold), but they were not different in terms of CKD, cancer mortality, cardiovascular mortality, and all-cause mortality (Table 13). In comparison with MHNO, those with MUNO had higher risks of diabetes and hypertension, CVD events, CVD mortality, and all-cause mortality, as well as similar risks of CKD and cancer mortality (Table 13). In the subgroup of individuals with stable phenotypes, those with the MHO subphenotype did not significantly differ from MUO individuals in terms of diabetes, hypertension, CKD and CVD, cancer mortality, cardiovascular mortality, and all-cause mortality (Table 14).
Association of Obesity Subphenotypes and Outcomes During Follow-Up (From 1998–2001 to 2014) Among Participants With Stable Phenotype Over Time
| Outcomes | Obesity Subphenotypes at Examination 7 (in 1998–2001) | ||
|---|---|---|---|
| Events/n | Unadjusted HR (95% CI) | Adjusted HR (95% CI)a | |
| Type 2 diabetes | |||
| MHNO | 5/759 | 1.00 (reference) | 1.00 (reference) |
| MHO | 0/41 | – | – |
| MUNO | 37/275 | 29.36 (11.44–75.36) | 21.92 (8.18–58.77) |
| MUO | 37/127 | 66.50 (25.67–172.23) | 55.57 (20.89–147.80) |
| Hypertension (2014 JNC-8 criteria) | |||
| MHNO | 232/680 | 1.00 (reference) | 1.00 (reference) |
| MHO | 18/35 | 2.40 (1.30–4.42) | 2.42 (1.29–4.53) |
| MUNO | 50/82 | 4.07 (2.65–6.26) | 3.16 (1.99–5.02) |
| MUO | 27/45 | 5.13 (2.80–9.41) | 4.71 (2.50–8.87) |
| Hypertension (2017 ACC/AHA criteria) | |||
| MHNO | 269/567 | 1.00 (reference) | 1.00 (reference) |
| MHO | 14/23 | 2.04 (0.97–4.28) | 1.90 (0.89–4.05) |
| MUNO | 31/48 | 3.48 (1.93–6.28) | 2.73 (1.47–5.07) |
| MUO | 9/21 | 1.92 (0.77–4.79) | 1.49 (0.58–3.82) |
| CKD/microalbuminuria | |||
| MHNO | 83/533 | 1.00 (reference) | 1.00 (reference) |
| MHO | 8/36 | 1.58 (0.72–3.44) | 1.48 (0.65–3.37) |
| MUNO | 51/192 | 2.60 (1.77–3.82) | 1.49 (0.97–2.31) |
| MUO | 41/122 | 3.41 (2.24–5.20) | 2.45 (1.54–3.89) |
| CVD | |||
| MHNO | 68/748 | 1.00 (reference) | 1.00 (reference) |
| MHO | 7/41 | 2.05 (0.94–4.46) | 2.24 (1.02–4.89) |
| MUNO | 74/272 | 3.66 (2.63–5.08) | 2.09 (1.45–3.00) |
| MUO | 56/179 | 4.05 (2.84–5.77) | 2.76 (1.92–3.98) |
| Cancer mortality | |||
| MHNO | 37/776 | 1.00 (reference) | 1.00 (reference) |
| MHO | 1/43 | 0.49 (0.07–3.59) | 0.48 (0.07–3.48) |
| MUNO | 43/372 | 3.06 (1.97–4.75) | 1.41 (0.87–2.28) |
| MUO | 25/232 | 2.69 (1.62–4.47) | 1.57 (0.93–2.65) |
| Cardiovascular mortality | |||
| MHNO | 15/776 | 1.00 (reference) | 1.00 (reference) |
| MHO | 1/43 | 1.23 (0.16–9.29) | 1.50 (0.20–11.49) |
| MUNO | 34/372 | 5.98 (3.26–10.98) | 1.98 (1.04–3.76) |
| MUO | 24/232 | 6.33 (3.32–12.06) | 3.09 (1.60–5.96) |
| All-cause mortality | |||
| MHNO | 85/776 | 1.00 (reference) | 1.00 (reference) |
| MHO | 5/43 | 1.07 (0.43–2.63) | 1.17 (0.48–2.90) |
| MUNO | 131/372 | 3.84 (2.92–5.04) | 1.63 (1.22–2.20) |
| MUO | 70/232 | 3.13 (2.28–4.29) | 1.76 (1.27–2.43) |
Abbreviations: ACC, American College of Cardiology; AHA, American Heart Association; JNC-8: Eighth Joint National Committee.
Adjusted for age, sex, and current smoking.
Comparison of Outcomes During Follow-Up (From 1998–2001 To 2014) Between the MHO and MUO Subphenotypes Among Participants With Stable Phenotype Over Times
| Outcomes | Obesity Subphenotypes at Examination 7 (in 1998–2001) | ||
|---|---|---|---|
| Events/n in MHO Group | Unadjusted HR (95% CI) | Adjusted HR (95% CI)a | |
| Type 2 diabetes | 0/41 | — | — |
| Hypertension (2014 JNC-8 criteria) | 18/35 | 0.47 (0.20–1.08) | 0.51 (0.22–1.22) |
| Hypertension (2017 ACC/AHA criteria) | 14/23 | 1.06 (0.33–3.38) | 1.27 (0.39–4.16) |
| CKD/microalbuminuria | 8/36 | 0.46 (0.20–1.06) | 0.60 (0.25–1.45) |
| CVD | 7/41 | 0.51 (0.23–1.11) | 0.81 (0.37–1.79) |
| Cancer mortality | 1/43 | 0.18 (0.03–1.35) | 0.30 (0.04–2.25) |
| Cardiovascular mortality | 1/43 | 0.19 (0.03–1.43) | 0.49 (0.07–3.63) |
| All-cause mortality | 5/43 | 0.34 (0.14–0.85) | 0.67 (0.27–1.66) |
HRs are from the models in Table 11 relating all obesity phenotypes to subclinical outcomes but with MUO as the reference group; only the MHO vs MUO comparisons are shown.
Abbreviations: ACC, American College of Cardiology; AHA, American Heart Association; JNC-8, Eighth Joint National Committee.
Adjusted for age, sex, and current smoking.
Discussion
In our community-based sample, we observed that the obesity subphenotypes changed over time, and a higher combined metabolic–BMI status over time was associated with a greater hazard of a range of clinical outcomes. The obesity subphenotypes exhibited a significant degree of fluctuation over time, with one-fourth or more participants changing their state within 4 years (Table 3). The MHO trait was the phenotype that changed most in the short-term. Compared with MHNO individuals, those with the MUNO and MHO phenotypes had higher prevalence of subclinical CVD cross-sectionally, as well as greater risk of clinical outcomes prospectively (diabetes, hypertension, cardiovascular events, and death). An integrated measure accounting for the changes in obesity subphenotypes status over time was strongly associated with prevalent subclinical CVD and incidence of clinical outcomes.
A limited number of studies have assessed the stability of obesity subphenotypes over time (15, 16, 18, 19). These studies have generally indicated a tendency toward metabolic deterioration in healthy obesity subphenotypes over time, which is consistent with our findings. Our results on the transition probability of MHO are closer to the observations in the Whitehall study where approximately one-half of MHO adults became MUO after 20 years (5-yearly assessment), and MHO participants were about eightfold more likely to progress to an unhealthy obese state (16). Another study investigated 3-year transition probabilities during a 6-year period, but it only included postmenopausal women (19). It showed a higher degree of stability in phenotypes, but this may relate to differences in the frequency of assessment (<4 years in prior studies) and a much shorter follow-up (6 years vs 22 years in the present investigation) (19).
Regarding the prognostic value of the various obesity subphenotypes (14, 17, 35–37), prior studies have reported an increased risk of diabetes, CVD, or mortality associated with MHO or MUNO, with a tendency toward a greater risk associated with the latter. The findings regarding CVD risk associated with MHO have not always been consistent (17), but our estimate of the CVD risk related to the MHO subphenotype aligns with those reported in that observed in the largest studies on the topic (36, 37). Our findings indicated significantly high risks of developing hypertension and diabetes over time among those with the MHO subphenotype, which suggests that a longer follow-up may have uncovered a significantly higher risks of CVD and mortality in the MHO group, as shown in previous studies (11). The degree of the purported “protection” conferred by the MHO is probably limited, and thus there is a need to pay medical attention to the MHO phenotype, especially as those with this phenotype can have many other obesity-related complications (e.g., altered physical and/or physiological functional status, sleep disorders, and articulation and postural problems) in addition to CVD or mortality outcomes (38). Overall, the main limitations of prior studies is that they examined a limited range of outcomes (39, 40), a shorter duration of follow-up for outcomes assessment (less than the median of 14 years in our investigation), and did not account for the dynamic nature of the obesity subphenotypes in relating these states to adverse outcomes (41).
The strengths of our investigation include the availability of a large number of observations across multiple examinations during two decades, the community-based nature of the sample, and the prospective design with assessment of the obesity subphenotypes at a 4-year frequency during the observation period. We also assessed an array of outcomes in relationship to obesity subphenotypes. A unique feature of our study is the development of an integrated BMI–metabolic health score to account for changes in obesity subphenotypes in estimating the associations with disease outcomes, thus offering a more comprehensive characterization of the natural history of obesity subphenotypes.
There are a few limitations of our study. First, we did not use WC in our definition of metabolic status because it was not available at the earlier Framingham examination cycles, but this measure is well correlated with BMI (23). Second, we did not include data on impaired glucose tolerance, which is an important component of metabolic dysfunction. Thus, the current study might have overestimated the prevalence of metabolically healthy states. Third, for each obesity subphenotype, the number of participants who remained stable across all the study examinations was small, and thus we had a limited statistical power to detect meaningful differences between MHO and any other subphenotype. Fourth, our sample was restricted to white individuals of European ancestry, which limits its generalizability to other racial groups that may exhibit differences in terms of the distribution of obesity subphenotypes or their relationships to outcomes (42). We did not include information on cardiorespiratory fitness (8), behavioral/lifestyle factors such as physical activity, and on nutritional intake, which may influence prognostic value of the various obesity subphenotypes.
Conclusions
Our analysis provides important information on short-term transition of obesity subphenotypes during two decades and highlights the importance of accounting for changes over time in the metabolic profile while assessing the prognostic significance of obesity subphenotypes. We observed dynamic change in obesity subphenotypes. There was a tendency for metabolic deterioration over time among those with the MHO phenotype, which was associated with higher rates of incident disease compared with the MHNO phenotype.
Abbreviations:
- BMI
body mass index
- CAC
coronary artery calcium
- CKD
chronic kidney disease
- CVD
cardiovascular disease
- HDL
high-density lipoprotein
- HR
hazard ratio
- LDL
low-density lipoprotein
- MHNO
metabolically healthy nonobese
- MHO
metabolically healthy obese
- MUNO
metabolically unhealthy nonobese
- MUO
metabolically unhealthy obese
- UACR
urinary albumin creatinine ratio
- WC
waist circumference
Acknowledgments
We are grateful to the participants of the Framingham Heart Study for their invaluable contributions to this work.
Financial Support: This work was supported by National Heart, Lung, and Blood Institute Grants T32 HL125232 (to J.B.E.-T.), R01HL093328 (to R.S.V.), R01HL107385 (to R.S.V.), and R01HL126136 (to R.S.V.). The Framingham Heart Study acknowledges the support of Contracts NO1-HC-25195 and HHSN268201500001I from the National Heart, Lung and Blood Institute.
Current Affiliation: J. B. Echouffo-Tcheugui’s current affiliation is the Division of Endocrinology, Diabetes & Metabolism, Johns Hopkins University School of Medicine, Baltimore, Maryland 21224.
Disclosure Summary: The authors have nothing to disclose.
