


Abstract
Bariatric surgery results in reduced muscle mass as weight is lost, but postoperative changes in muscle strength and performance are incompletely understood.
To examine changes in body composition, strength, physical activity, and physical performance following Roux-en-Y gastric bypass (RYGB).
In a prospective cohort of 47 adults (37 women, 10 men) aged 45 ± 12 years (mean ± SD) with body mass index (BMI) 44 ± 8 kg/m2, we measured body composition by dual-energy X-ray absorptiometry, handgrip strength, physical activity, and physical performance (chair stand time, gait speed, 400-m walk time) before and 6 and 12 months after RYGB. Relative strength was calculated as absolute handgrip strength/BMI and as absolute strength/appendicular lean mass (ALM).
Participants experienced substantial 12-month decreases in weight (−37 ± 10 kg or 30% ± 7%), fat mass (−48% ± 12%), and total lean mass (−13% ± 6%). Mean absolute strength declined by 9% ± 17% (P < 0.01). In contrast, relative strength increased by 32% ± 25% (strength/BMI) and 9% ± 20% (strength/ALM) (P < 0.01 for both). There were clinically significant postoperative improvements in all physical performance measures, including mean improvement in gait speed of >0.1 m/s (P < 0.01) and decrease in 400-m walk time of nearly a full minute.
In the setting of dramatic weight loss, lean mass and absolute grip strength declined after RYGB. However, relative muscle strength and physical function improved meaningfully and are thus noteworthy positive outcomes of gastric bypass.
Obesity is a chronic multifactorial disease caused by genetic, environmental, and behavioral factors, with serious health consequences (1). Unfortunately, the prevalence of obesity is rising rapidly worldwide, affecting roughly one-third of adults in the United States (2). Because few patients with morbid obesity achieve substantial weight loss with lifestyle modifications alone, many undergo bariatric surgery (3). Roux-en-Y gastric bypass (RYGB), the most common bariatric procedure in recent years, is accepted as an effective short- and long-term weight loss intervention for morbid obesity, leading to a reduction in all-cause mortality and improvement in obesity-related comorbidities, including type 2 diabetes mellitus, dyslipidemia, and obstructive sleep apnea (4–6).
In addition to the metabolic and cardiovascular risks incurred by obesity, there are well-established associations between obesity and impaired skeletal muscle quality, poor physical performance, and higher risk of functional decline (7–11), suggesting that bariatric surgery‒induced weight loss could potentially lead to improvements in these parameters. However, despite profound loss of fat mass after bariatric surgery, there is also substantial loss of lean mass, including muscle mass (12–16), raising the possibility of a negative effect on muscle strength and physical performance. Some studies have reported postoperative declines in absolute muscle strength, an important contributor to physical function (17–19); however, little is known about the effect of bariatric surgery on objective measures of physical performance. A recent review suggested that physical performance improves after bariatric surgery, but it is unclear whether the improvements are the direct results of surgery-induced body composition changes or the indirect results of increased physical activity or other factors (20). In addition, the published literature is limited by inconsistent methodologies for assessing physical performance, by very short postoperative follow-up durations, and often by small sample sizes. Furthermore, studies addressing the effects of bariatric surgery on body composition or physical performance generally have not concurrently assessed muscle strength, physical activity, and a wide range of hormonal and dietary factors that may influence performance.
Therefore, we aimed to characterize the effects of RYGB on lean mass, muscle strength, and objective measures of physical performance. We also examined potential predictors of these outcomes, including hormonal changes and changes in physical activity and dietary protein intake. We hypothesized that despite the loss of lean mass after RYGB, muscle strength relative to body mass would increase, as would physical performance.
Materials and Methods
Study design
This prospective cohort study enrolled adult women and men before RYGB surgery at the University of California, San Francisco or the San Francisco Veterans Affairs Medical Center. Participants underwent study measurements preoperatively and at 6 and 12 months postoperatively. The primary study (21) was designed to address calcium metabolism and skeletal health outcomes. The research protocol included attention to vitamin D status, with vitamin D supplements supplied throughout the study. At enrollment, low 25-hydroxyvitamin D [25(OH)D] levels were repleted to a target level ≥30 ng/mL, and postoperatively, supplement doses were adjusted to maintain this goal.
Study population
Women and men 25 to 70 years of age were eligible if they were scheduled for an upcoming RYGB procedure. Eligibility for RYGB was based on 1991 National Institutes of Health (NIH) consensus body mass index (BMI) guidelines (BMI >40 kg/m2 or BMI >35 kg/m2 with obesity-related comorbidities) and failure to lose weight with medical management. Exclusion criteria have been described elsewhere (21) and included prior bariatric surgery, estimated glomerular filtration rate <30 mL/min/1.73 m2, and weight >350 pounds [the weight limit of the dual-energy X-ray absorptiometry (DXA) scanner]. Perimenopausal women (defined as last menses >3 months but <5 years ago) were excluded from the study to minimize changes in hormone levels and skeletal health unrelated to surgery. Premenopausal women receiving stable hormonal contraception, postmenopausal women receiving stable menopausal hormone therapy, and men receiving stable testosterone therapy were eligible. Because of the primary skeletal focus of the study, exclusion criteria included use of medications known to affect bone metabolism. The institutional review board approved the study protocol. All participants provided written informed consent. Participants were included in this analysis if they underwent both preoperative and postoperative body composition assessments.
Anthropometric measurements and body composition
Preoperatively and at 6 and 12 months postoperatively, height and weight were measured by standard procedures. BMI was calculated as weight/height2 (kg/m2). Mean excess body weight was calculated as body weight in excess of the calculated ideal body weight (22). Waist and hip circumferences were measured using a flexible measuring tape in the midaxillary line at the level of the lowest rib and at the maximum extension of the buttocks viewed from the side, respectively. The means of two repeated measurements at each site were used.
Body composition was estimated by DXA using a Hologic Discovery Wi scanner (Bedford, MA). Modified half-body scans were used when a participant’s body dimensions exceeded the width of the scanning area (23). All scans were analyzed by a single technologist.
Absolute and relative muscle strength
Handgrip strength, which has been shown to predict functional decline as well as all-cause and cardiovascular disease mortality (24–27), was measured using a Jamar hand dynamometer (Sammons Preston, Rolyon, Bolingbrook, IL). Strength was measured using the dominant hand when possible; the nondominant hand was used in six participants because of placement of an IV line in the dominant arm, and follow-up measurements were performed using the same hand for these individuals. Each participant was in a seated position with the arm flexed at 90 degrees. Participants were asked to squeeze the dynamometer at maximum strength for 3 seconds, and they were allowed to rest for 15 seconds between measurements. The maximum effort expended (kg) was referred to as absolute muscle strength. As in other reports in the literature, relative muscle strength was defined as the force a person could exert relative to his or her body mass (28, 29). Relative strength was expressed as the ratio of absolute handgrip strength by BMI (strength/BMI) and as the ratio of absolute handgrip strength by appendicular lean mass (strength/ALM).
Physical performance
All participants underwent measurement of gait speed and time to rise from a chair five times, both validated measures of physical performance (30–32). For the gait speed test, participants were asked to walk a distance of 4 m at their normal pace. Two measurements were made, and the faster of the two was used to compute gait speed (m/s). For the five-chair-stand test, the participants started out seated with arms folded across the chest, and they were asked to stand quickly five times from a sitting position without stopping or using their arms.
A subset of participants (n = 15) completed a 400-m walk test after the test was added as a procedure partway through the study. The 400-m walk test is a standardized test of functional performance that predicts mortality and incident cardiovascular disease as well as mobility limitation in older adults (33). Participants were instructed to walk as quickly as possible at a steady pace, without running.
Physical activity
Preoperatively and postoperatively at 6 and 12 months, participants completed the International Physical Activity Questionnaire (IPAQ) short form. The IPAQ-short form assesses sitting, walking, and activities of moderate and vigorous intensity that are performed continuously for at least 10 minutes. This questionnaire has demonstrated reliability in comparison with established self-report physical activity measures and has shown moderate associations with accelerometer measurements (34, 35). Data were processed and analyzed following the 2004 IPAQ Research Committee Guidelines, with volume of activity reported as a score in metabolic equivalent of task (MET) minutes per week (35). The most current Physical Activity Guidelines for Americans recommends that adults engage in 500 to 1000 MET minutes per week for health benefits (36). No specific exercise training program was prescribed at either of the two bariatric centers after surgery.
Laboratory and dietary data
Blood samples were collected preoperatively and at 6 and 12 months postoperatively after an overnight fast. Basic chemistries and hemoglobin A1c level were measured, 25(OH)D level was determined by liquid chromatography-tandem mass spectrometry, and then serum was stored at −70°C until batch analysis for other analytes in a central laboratory (Maine Medical Center Research Institute, Scarborough, ME). IGF-1 level was measured by automated immunoassay (iSYS; Immunodiagnostic Systems, Scottsdale, AZ), with interassay and intra-assay coefficients of variation of 5.1% and 2.2%, respectively. In men only, total testosterone level was measured by ELISA (Alpco Diagnostics, Salem, NH), with interassay and intra-assay coefficients of variation of 7.3% and 8.0%, respectively.
At each time point, usual dietary intake was assessed with the 2005 version of the comprehensive Block Food Frequency Questionnaire (37). This questionnaire allows for estimates such as average daily intake of energy (kcal/d) and macronutrients.
Surgical approach
The RYGB procedure was performed by experienced bariatric surgeons at both academic bariatric surgery centers using a standardized laparoscopic approach. This included creation of a 30-mL gastric pouch, a gastrojejunal anastomosis created with a 25-mm circular stapler, an antecolic and antegastric Roux limb 100 to 150 cm in length, and an end-to-side jejunostomy.
Statistical analysis
Baseline and 6- and 12-month postoperative characteristics were summarized as mean ± SD or median (interquartile range), as appropriate. Postoperative changes were summarized as mean ± SD and also mean (95% CI). At all steps in the analysis, data were assessed for normality, and when not normally distributed, nonparametric statistical tests were used. Paired t tests or Wilcoxon signed rank tests were used to determine whether study measures changed between preoperative and 6- or 12-month postoperative time points. The Pearson test of correlation, Spearman rank correlation, t test of independence, and Mann-Whitney U test were used to characterize the relationships between baseline measures of body composition, muscle strength, and physical performance and between these and potential determinants of these outcomes. In addition, these parametric and nonparametric tests were used to examine the bivariate relationships between changes in body composition, strength, and performance and their potential determinants. Statistical analyses were conducted using SAS version 9.4 (SAS Institute, Cary, NC).
Results
Baseline characteristics
Forty-seven participants underwent preoperative and at least one postoperative assessment of body composition (N = 46 with 6-month data; N = 44 with 12-month data). Of the 47, 10 (21%) were men, 27 (58%) were premenopausal women, and 10 (21%) were postmenopausal women (Table 1). Mean age was 45 ± 12 years. Fifty-five percent of the participants were white. Mean BMI was 44 ± 7 kg/m2, and mean percentage body fat was 46% ± 6%. Mean excess body weight was 59 ± 17 kg (Table 1).
Baseline Characteristics of Study Participants (N = 47)
| Characteristic | Value |
|---|---|
| Age, y | 45 ± 12 |
| Men | 52 ± 13 |
| Women | 43 ± 11 |
| Sex, n (%) | |
| Men | 10 (21%) |
| Women | 37 (79%) |
| Menopausal status, n (%) of women | |
| Premenopausal | 27 (73%) |
| Postmenopausal | 10 (27%) |
| Race, n (%) | |
| White | 26 (55%) |
| Black | 9 (19%) |
| Hispanic | 6 (13%) |
| Asian | 3 (6%) |
| Pacific Islander | 2 (4%) |
| Native American | 1 (2%) |
| Body mass index, kg/m2 | 44 ± 7 |
| Weight, kg | 123 ± 19 |
| Excess body weight, kg | 59 ± 17 |
| Total body fat, kg | 56 ± 12 |
| Percentage body fat, % | 47 ± 6 |
| Total body lean mass, kg | 62 ± 12 |
| Appendicular lean mass, kga | 28 ± 6 |
| Waist circumference, cm | 120 ± 14 |
| Diabetes, n (%) | 19 (40%) |
| HbA1c, % | 5.6 (5.4, 6.7) |
| 25(OH)D upon enrollment, ng/mL | 26 ± 11 |
| 25(OH)D at preoperative study visit, ng/mL | 42 ± 11 |
| Dietary protein intake, g | 78 ± 31 |
| % of total kilocalories from protein | 17 ± 3 |
| Physical activity, MET, min/wk | 1006 (33, 2772) |
Data are presented as mean ± SD or median (interquartile range).
Abbreviation: HbA1c, hemoglobin A1c.
Appendicular lean mass was calculated as the sum of lean mass from the arms and legs.
Correlates of baseline lean mass, strength, and physical performance
Baseline body composition differed by sex: Men had substantially greater lean mass than women (79 vs 57 kg, respectively; P < 0.01). At baseline, men had greater mean absolute strength than women (42.9 vs 26.5 kg, respectively; P < 0.01) as well as greater relative strength as measured by strength/BMI and strength/ALM (P < 0.01 for both). Premenopausal women had greater absolute strength than postmenopausal women (28.9 vs 20.1 kg, respectively; P < 0.01) as well as greater relative strength (P < 0.01 for strength/BMI; P = 0.04 for strength/ALM). At baseline, age was inversely correlated with the physical performance measures of gait speed and chair stand time, such that younger people were faster (r = −0.35, P = 0.02; and r = 0.29; P = 0.049, respectively). Sex was not associated with physical performance, but gait speed was faster among premenopausal than postmenopausal women (1.18 vs 0.94 m/s, respectively; P < 0.01). Race was not significantly associated with lean mass, strength, or physical performance.
At baseline, those with greater total mass and ALM had greater absolute strength and relative strength (strength/BMI) and faster gait speed. Those with greater absolute and relative strength (strength/BMI) had faster gait speed and faster chair stand times [Fig. 1; (38)]. Those reporting more physical activity at baseline had faster gait speed and chair stands at baseline (38). Those with higher baseline IGF-1 level had greater strength and faster chair stands, and the correlation between gait speed and IGF-1 level at baseline neared statistical significance (38).
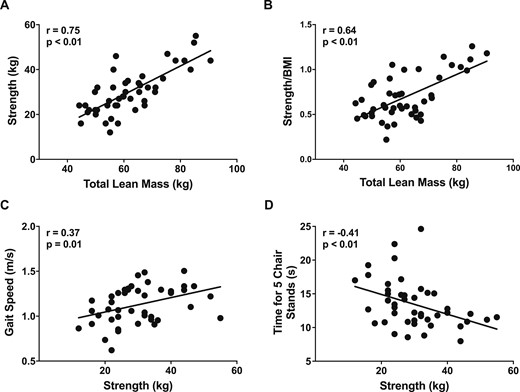
Correlations between baseline lean mass, strength measures, and physical performance measures. (A and B) Panels show that at baseline those with greater total lean mass had greater absolute and relative strength (strength/BMI). Those with greater strength had (C) faster gait speed and (D) better chair stand times. Relationships between parameters were analyzed by the Pearson test of correlation (N = 47).
Changes in body composition
Weight and BMI decreased in all participants at 6 months, with continued statistically significant declines between 6 and 12 months. Changes in body composition are shown in Fig. 2. By 12 months, mean percentage weight loss was 30% ± 7%, and percentage of excess body weight loss was 66% ±18%. The weight loss comprised a 49% ± 12% decrease in fat mass and a 14% ± 6% decrease in lean mass at 12 months. On regional analysis, the 12-month decline in ALM was 16% ± 7%. All body composition parameters changed significantly between 6 and 12 months.
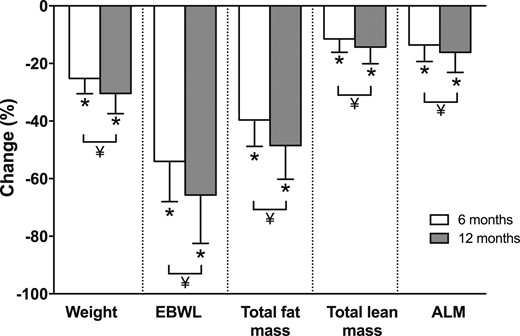
Percentage changes in body composition parameters at 6 and 12 mo after Roux-en-Y gastric bypass. Values are mean ± SD. N = 46 for 6-mo changes; N = 44 for 12-mo changes. *P < 0.05 compared with baseline by paired t test. ¥, 12 mo significantly different than 6 mo by paired t test (P < 0.05). EBWL, excess body weight loss.
Changes in absolute and relative muscle strength
Absolute muscle strength decreased significantly from preoperative values (P < 0.001; Fig. 3A). Mean 12-month change in absolute strength was a decline of 2.6 ± 5.4 kg, with all of the decline occurring in the first 6 postoperative months. In contrast, relative muscle strength (both strength/BMI and strength/ALM) increased progressively during the 12 months after surgery (Fig. 3B and 3C).
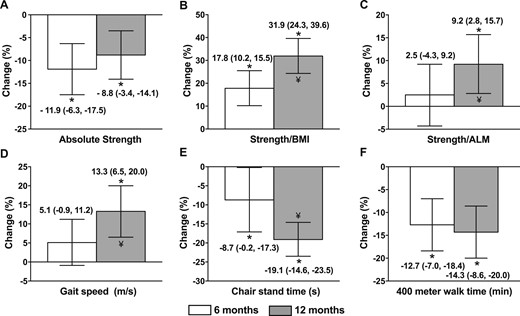
Percentage changes in (A) absolute and (B and C) relative strength and (D‒F) physical performance measures 6 and 12 mo after Roux-en-Y gastric bypass. Values are means and 95% CIs. N = 46 for 6-mo changes; N = 44 for 12-mo changes. *P < 0.01 compared with baseline by paired t test. ¥, 12 mo significantly different than 6 mo by paired t test (P < 0.05).
Changes in physical performance
Mean gait speed improved from 1.1 ± 0.2 m/s preoperatively to 1.3 ± 0.3 m/s at the 12-month postoperative time point, which represents a 13.3 ± 21.5% improvement (P < 0.01; Fig. 3D). Time for five chair stands improved from 13.4 ± 3.6 to 11.6 ± 6.8 seconds at 12 months, which is a 19.1% ± 14.6% improvement (P < 0.01; Fig. 3E). Mean 400-m walk time improved from 5.3 ± 0.6 to 4.4 ± 0.7 minutes at 12 months, which is a 14.3% ± 8.5% improvement (P < 0.01; Fig. 3F). Gait speed and chair stand time improved significantly between 6 and 12 months, whereas absolute 400-m walk time did not change significantly.
Changes in physical activity, laboratory parameters, and dietary protein intake
Change in self-reported physical activity was highly variable; there was no change on average over 6 or 12 months, with median (interquartile range) 12-month change of +499 (−868, +1062) (MET) minutes/week (P = 0.27) (Table 2). Testosterone levels, measured in men only increased at 6 and 12 months (P < 0.01 vs baseline for both). Mean IGF-1 level increased from baseline to 6 months (P = 0.06) and 12 months (P < 0.01), whereas mean 25(OH)D level decreased (P = 0.03 and P < 0.01 over 6 and 12 months, respectively). Dietary protein intake decreased over the first 6 postoperative months, but the percentage of total kilocalories coming from protein increased (P < 0.01) (Table 2).
Changes in Other Potential Determinants of Physical Performance 6 and 12 Months After RYGB
| Characteristics | Preoperative | 6 Mo Postoperative | P Value vs Preoperative | 12 Mo Postoperative | P Value vs Preoperative |
|---|---|---|---|---|---|
| Physical activity, MET, min/wk | 1006 (33, 2772) | 1426 (569, 2932) | 0.38 | 1617 (693, 3092) | 0.29 |
| Laboratory parameters | |||||
| IGF-1, ng/mL | 109 ± 49 | 121 ± 46 | 0.06 | 135 ± 55 | <0.01 |
| 25(OH)D, ng/mL | 42 ± 11 | 38 ± 12 | 0.03 | 36 ± 12 | <0.01 |
| Total testosterone, ng/dL (men only) | 368 ± 127 | 505 ± 154 | <0.01 | 554 ± 201 | <0.01 |
| Protein intake | |||||
| Total dietary protein intake, g/d | 78 ± 31 | 52 ± 20 | <0.01 | 49 ± 18 | <0.01 |
| Dietary protein per kilogram of body weight | 0.64 ± 0.23 | 0.58 ± 0.24 | 0.29 | 0.58 ± 0.21 | 0.32 |
| % of total kilocalorie intake from protein | 16.7 ± 2.5 | 20.3 ± 4.8 | <0.01 | 17.5 ± 4.0 | 0.27 |
Data are presented as mean ± SD or median (interquartile range); N = 47.
Correlates of 6- and 12-month changes in body composition, strength, and physical performance
Men, who had greater lean mass than women at baseline, lost more lean mass than women over 6 and 12 months after RYGB (−12 ± 4 kg vs −8 ± 4 kg at 12 months, respectively; P = 0.01). Race and menopausal status had no effect on body composition changes after RYGB. Change in absolute strength was not statistically different between women and men (P = 0.17 for 12-month change), but the decline in absolute strength was driven by a decline among women: Over 12 months, mean change was −4 ± 4 kg among women and +0.2 ± 7.7 among men. Increases in relative strength were smaller among women than men (P = 0.02 for difference between sexes for strength/BMI and P = 0.06 for strength/ALM). No correlations were found between age, sex, race, or menopausal status and changes in physical performance.
Neither changes in lean mass or fat mass nor changes in strength correlated with changes in physical performance (Table 3). Similarly, no significant correlations were identified between changes in laboratory parameters, physical activity, or dietary protein intake and changes in physical performance. Among participants with preoperative diabetes, those who experienced postoperative resolution of their diabetes demonstrated changes similar to those of participants who did not experience diabetes resolution.
Twelve-Month Change Correlations Between Body Composition, Absolute and Relative Strength, and Physical Performance Parameters
| 12-Mo Change | |||||||||
|---|---|---|---|---|---|---|---|---|---|
| Parameter | Total Fat Mass | Total Lean Mass | ALM | Strength | Strength/BMI | Strength/ALM | Gait Speed | Chair Stand Time | 400-m Walk Time |
| Weight | 0.92 (<0.01) | 0.46 (<0.01) | 0.52 (<0.01) | 0.00 (0.98) | −0.35 (0.02) | −0.22 (0.17) | −0.18 (0.27) | 0.12 (0.46) | 0.29 (0.38) |
| Total fat mass | 0.11 (0.48) | 0.23 (0.14) | 0.06 (0.72) | −0.21 (0.19) | −0.05 (0.78) | −0.17 (0.27) | 0.09 (0.55) | 0.12 (0.73) | |
| Total lean mass | 0.93 (<0.01) | −0.13 (0.43) | −0.45 (<0.01) | −0.49 (<0.01) | −0.09 (0.59) | −0.31 (0.36) | 0.31 (0.31) | ||
| ALM | −0.10 (0.52) | −0.48 (<0.01) | −0.50 (<0.01) | −0.19 (0.24) | 0.07 (0.66) | 0.37 (0.26) | |||
| Strength | 0.03 (0.84) | −0.11 (0.49) | −0.05 (0.89) | ||||||
| Strength/BMI | 0.09 (0.59) | −0.04 (0.81) | −0.17 (0.64) | ||||||
| Strength/ALM | 0.13 (0.44) | −0.10 (0.52) | −0.21 (0.56) | ||||||
Values are Pearson coefficients of correlation. P values appear in parentheses beside correlation coefficients. Boldface P values are statistically significant (P < 0.05); N = 47.
Discussion
In this longitudinal study of men and women undergoing RYGB, despite significant postoperative declines in lean mass and absolute muscle strength, relative muscle strength (measured as strength relative to BMI or ALM, referred to by some as “muscle quality”) increased by 6 and 12 months. Moreover, statistically and clinically significant improvements were observed in all three of the objective physical performance parameters measured—gait speed, chair stand time, and 400-m walk time.
Obesity is associated with fat infiltration of muscle and impaired muscle quality (7–10, 39). Although bariatric surgery has the potential to treat these problems (17, 19), it also results in reductions in lean mass while weight is lost. Indeed, in our cohort, lean mass decreases were consistent with those in the existing literature (13–17). It is noteworthy that in this cohort, the majority of the weight loss and related body composition change, including decrease in lean mass, occurred in the first 6 postoperative months. This suggests that early interventions might be beneficial in maintaining lean mass and avoiding long-term disability.
A major focus of our study was the assessment of postoperative change in muscle strength after RYGB, measured as change in handgrip strength. When expressed in absolute terms, our results show that handgrip strength was significantly lower at 6 and 12 months than at baseline. These findings are consistent with those of others who have demonstrated postoperative reductions in absolute muscle strength in both upper and lower extremities (17–19). Next, given the substantial weight loss seen after RYGB, muscle strength relative to body mass was examined by dividing strength by BMI and by ALM, as other investigators have done to examine muscle “quality” in a variety of patient populations (28, 29, 40, 41). Relative strength increased significantly between 6 and 12 months postoperatively. This could show that after the early loss of lean mass slows, there is a continued decrease in fat infiltration of muscle, such as that demonstrated after bariatric surgery by Toro-Ramos et al. (42). Other factors may also continue to change beyond the initial period of precipitous weight loss.
A unique contribution of this study is the objective assessment of physical performance at multiple time points, concurrent with assessment of body composition, strength, and other covariate measures. The three tests used have been shown to be valid, reliable, and sensitive to change (30, 32); in addition, improvements in test results have been associated with decreased mortality and morbidity in older adults (33). We found significant improvements in all three tasks in those who underwent bariatric surgery. Gait speed improved 13%, from a mean of 1.13 m/s preoperatively to 1.27 m/s postoperatively. This is noteworthy, as an increment of 0.1 m/s has been shown to be clinically meaningful in older adults (43, 44). Mean time to complete five chair stands improved by 19%, and 400-m walk time improved from 5.3 to 4.4 minutes. This means that, on average, the participants were able to walk a quarter of a mile almost a whole minute faster after RYGB, an increment linked to decreased morbidity and mortality in older adults (33). In fact, these improvements are substantially larger than the improvements seen with 2.6 years of a moderate physical activity intervention in older adults (44). These improvements in the ability to perform simple, everyday physical activities might contribute to improvements in quality of life and reduction in long-term disability.
We examined factors associated with lean mass, strength, and physical performance at baseline and predictors of postoperative changes in these measures. Sex and menopausal status were significant determinants. At baseline, those with greater total mass and ALM had greater absolute and relative strength and faster gait speed. Those with greater absolute and relative strength had faster gait speed and chair stand times.
We anticipated that those who maintained more lean mass after RYGB would maintain more absolute strength and/or have greater improvements in relative strength and that favorable postoperative changes in these parameters would translate into greater improvements in physical performance. However, there was no evidence of such correlations. Moreover, no correlations were found between these changes and changes in physical activity; 25(OH)D, IGF-1, or testosterone level; or dietary protein intake. Thus, we speculate that improvements in physical performance after RYGB could be due to changes in biomechanics that result from substantial weight loss, which make it easier for people to move around and interact with their environment. Potential improvements in cardiovascular fitness and joint pain could contribute as well. Some of these factors have been related to functional impairments in other populations (45). In older individuals, resistance exercises have been shown to enhance muscle mass, strength, and physical performance. With this in mind, we cannot rule out that perioperative and postoperative resistance training interventions could improve all of these domains, even though there was no evidence that participants who maintained more lean mass or muscle strength exhibited greater improvements in physical performance. If that is the case, such an intervention may have the potential to improve quality of life and prevent long-term disability.
This study has limitations. Handgrip strength is not a direct test of the lower extremity muscles used in the other physical performance tests. Nevertheless, handgrip strength is a simple, noninvasive, and highly reproducible measure of muscle strength; is suitable for clinical practice; and is commonly used in research as a surrogate for lower extremity strength (41, 46, 47). DXA is the research gold standard for lean mass assessment; however, it is not a direct measure of muscle mass. In addition, self-reported physical activity is an imperfect measure, as it has been shown that individuals with obesity overreport frequency and duration of physical activity (48).
Future studies should have longer follow-up periods and larger sample sizes and should include objective measures of physical activity such as activity monitors and direct measures of lower extremity muscle strength. In addition, they should examine additional measures of muscle quality, such as radiographic muscle density or muscle fat infiltration. Furthermore, future clinical trials should test the effect of specific interventions (e.g., specific resistance training programs) for mitigating loss of muscle mass and absolute strength and enhancing physical performance improvements after RYGB.
Conclusion
The current study shows that, despite declines in lean mass and absolute muscle strength after RYGB, both relative muscle strength and physical performance improved substantially. The magnitude of the physical performance improvements is clinically important and suggests that RYGB improves a person’s ability to perform activities of daily living. The particular measures assessed in this study have been associated with decreased morbidity and mortality in older adults. No clear predictors of physical performance changes were identified, so we propose that the observed physical performance improvements may result from changes in biomechanics, which simply make it easier for a person to move around and to perform physical tasks. Nonetheless, we cannot rule out that maintaining more muscle mass or strength leads to greater functional improvements, and future research should address a range of strategies to optimize postoperative physical performance.
Abbreviations:
- 25(OH)D
25-hydroxyvitamin D
- ALM
appendicular lean mass
- BMI
body mass index
- DXA
dual-energy X-ray absorptiometry
- IPAQ
International Physical Activity Questionnaire
- MET
metabolic equivalent of task
- NIH
National Institutes of Health
- RYGB
Roux-en-Y gastric bypass
Acknowledgments
The authors thank Barbara Arnold for study coordination and data collection, Viva Tai for DXA scan acquisition, Lisa Palermo for her work in data management, and Tiffany Kim and Nooshin Yashar for their roles in study support and data coordination.
Financial Support: This study was supported by the Department of Veterans Affairs (5 IK2 CX000549; to A.L.S.) and by the National Center for Advancing Translational Sciences, NIH, through UCSF-CTSI grant UL1 TR000004. Additional support was provided by the National Institute of Diabetes, Digestive, and Kidney Diseases, NIH R01 DK107629 and R21 DK112126 (to A.L.S.) and T32 DK007418, and the Wilsey Family Foundation. Manuscript contents are solely the responsibility of the authors and do not necessarily represent the official views of the NIH and the Department of Veterans Affairs. Laboratory assay kits were provided by Immunodiagnostic Systems.
Disclosure: The authors have nothing to disclose.
