


Abstract
Iron overload has been associated with greater adipose tissue (AT) depots. We retrospectively studied the potential interactions between iron and AT during an experimental overfeeding in participants without obesity.
Twenty-six participants (mean body mass index ± SD, 24.7 ± 3.1 kg/m2) underwent a 56-day overfeeding (+760 kcal/d). Serum iron biomarkers (ELISA), subcutaneous AT (SAT) gene expression, and abdominal AT distribution assessed by MRI were analyzed at the beginning and the end of the intervention.
Before intervention: SAT mRNA expression of the iron transporter transferrin (Tf) was positively correlated with the expression of genes related to lipogenesis (lipin 1, ACSL1) and lipid storage (SCD). SAT expression of the ferritin light chain (FTL) gene, encoding ferritin (FT), an intracellular iron storage protein, was negatively correlated to SREBF1, a gene related to lipogenesis. Serum FT (mean, 92 ± 57 ng/mL) was negatively correlated with the expression of SAT genes linked to lipid storage (SCD, DGAT2) and to lipogenesis (SREBF1, ACSL1). After intervention: Overfeeding led to a 2.3 ± 1.3-kg weight gain. In parallel to increased expression of lipid storage–related genes (mitoNEET, SCD, DGAT2, SREBF1), SAT Tf, SLC40A1 (encoding ferroportin 1, a membrane iron export channel) and hephaestin mRNA levels increased, whereas SAT FTL mRNA decreased, suggesting increased AT iron requirement. Serum FT decreased to 67 ± 43 ng/mL. However, no significant associations between serum iron biomarkers and AT distribution or expansion were observed.
In healthy men, iron metabolism gene expression in SAT is associated with lipid storage and lipogenesis genes expression and is modulated during a 56-day overfeeding diet.
Iron is essential for oxidation and electron transport but is highly regulated because of its capacity to cause oxidative stress. Intestinal iron absorption is tightly controlled by body iron stores, which regulate its transporters expression (1). In the enterocyte, iron is exported into the circulation by ferroportin 1 (also known as SLC40A1, solute carrier family 40 member 1), an iron export channel, and transporter hephaestin. Hepcidin regulates iron absorption by degradation of ferroportin 1. Iron then binds to the iron transport protein transferrin (Tf). The interaction of transferrin with transferrin receptor (TfRC) leads to intracellular iron uptake in target cells. Ferritin (FT), an intracellular protein, has a high capacity to bind iron and is released in serum to store iron. Serum ferritin is used as a marker of body iron content (2).
The links between iron metabolism and adipose tissue (AT) physiology are increasingly recognized (3). AT acts as an iron-sensing tissue that expresses the usual regulators of iron homeostasis, TfRC and FT. Adipocytes also express hepcidin (4) and ferroportin 1 (5). Decreased iron content in adipocytes is associated with a decreased expression of FTL (FT light chain) gene (encoding for FT) because of iron responsive protein binding on 5′ mRNA iron responsive element (6), whereas expression of the Tf gene is increased (3). Conversely, iron overload leads to increased FT translation and decreases in TfRC mRNA (5). In AT, insulin stimulates iron uptake into the cells by redistributing TfRC to the cell surface, which then binds to Tf (7). Moreover, iron is an important actor of AT function and especially of adiponectin expression; iron excess results in decreased adiponectin transcription (5).
Optimal adipocyte differentiation occurs in a narrow range of iron concentration (3), and outside of this range AT dysfunction arises. Rodent studies argue for a limited AT expandability with iron overload. Iron supplementation has resulted in a decrease in visceral adipose tissue (VAT) lipoprotein lipase gene expression and in VAT mass (8). In KK/HIJ mice, a polygenic obese model with increased plasma and AT iron levels, AT dysfunction, and reduced adipogenesis and insulin signaling was observed (9). Conversely, in rats, iron-deficient diets have been associated with fat mass expansion and lipogenesis (10, 11). Altogether these rodent data suggest that iron overload may limit AT adipogenesis and lipid storage and thus its capacity to expand. In agreement with this hypothesis, we have shown that the gene expression of FTL in humans, with and without obesity, was negatively associated with the expression of adipogenic genes (FASN, PPARγ) in AT [VAT and subcutaneous adipose tissue (SAT)] (12).
Concerning the impact of AT expansion on iron metabolism, a high-fat diet in wild-type mice led to obesity, iron accumulation in adipocytes, a proinflammatory profile, and a decrease in adiponectin expression (13). In humans without obesity, the participants who had greater adiposity (VAT and SAT measured with CT) had higher body iron content, quantified by serum FT (14), whereas obesity is associated with iron overload in AT (12) in humans (with increased expression of FTL and SLC40A1). Nonetheless, the regulation of iron markers in AT and its potential association with adipose metabolism during dynamic weight changes have never been studied.
In a previous study, we demonstrated that overfeeding-induced moderate weight gain in participants without obesity led to VAT expansion in association with a defect in the upregulation of lipid storage genes (DGAT2, SREBF1) in SAT (15). Whether iron could play a role in this response of fat tissues to overfeeding has not been studied. Therefore, the current study was conducted to retrospectively investigate the potential cross-talk between iron and AT function by analyzing the links between plasma levels and SAT expression of markers of iron metabolism with SAT metabolic gene expression during a previously reported lipid-diet overfeeding intervention in healthy men (15–17).
Methods
Twenty-six male participants without obesity (mean age ± SD, 30 ± 9 years) participating in a previous trial (15–17) took part in the current study. They did not differ from the rest of the study population (18).
The protocol was approved by the ethics committee of Lyon Sud-Est according to the French “Huriet-Serusclat” law and the Second Declaration of Helsinki. All participants gave informed written consent.
The participants were submitted to 56 days of lipid overfeeding as described previously (15–17). Briefly, participants ingested an excess of 760 kcal/day (3180 kJ/day) in addition to their usual diet. They completed 5-day dietary records before the study and during the overfeeding period (days 51 to 55). Metabolic explorations were performed before the study (day 0) and at the end of the study (day 56). The assays led to the withdrawal of a total of 400 mL of blood during the protocol. At day 0 and day 56, body composition was determined by dual-energy x-ray absorptiometry (Hologic, Inc., Bedford, MA); abdominal adipose tissue distribution (subcutaneous and visceral fat regions) was assessed by MRI (Magnetom Symphonie 1.5 Tesla; Siemens AG, Munich, Germany) using single-slice image at the L2 to L3 disk level. Basal metabolic rate and lipid and carbohydrate oxidation rates were assessed by indirect calorimetry (Deltatrac Datex, Helsinki, Finland) before and after the intervention.
AT analyses
A needle biopsy of abdominal SAT was performed about 10 to 15 cm from the umbilicus under local anesthesia (1% lidocaine). A subsequent biopsy specimen (day 56) was taken contralaterally. Fat samples were immediately frozen in liquid nitrogen and stored at −70°C (17). Expression of genes encoding major lipid storage and adipogenesis proteins (SCD, DGAT2, SREBF1, ACLY, CIDEA, Lipin1, ACSL1) were analyzed by RT-PCR analysis, as described previously (17), for 16 participants who did not differ from the rest of the population. In this subgroup of volunteers, fat samples from 12 participants were used for global gene expression profiling (Affymetrix GeneChip®, Thermo Fisher Scientific, Santa Clara, CA) in SAT before and at the end of the 56 days overfeeding as previously described (17). Genes related to iron metabolism were identified in the Affymetrix chips, and specific attention was paid to FTL, SLC40A1, Tf, TfRC, Hephaestin, HAMP (coding for hepcidin) and MitoNEET gene expression.
Serum analyses
Fasting glycemia was measured by using the hexokinase method (Roche Diagnostics, Meylan, France). Insulinemia (IRMA kit; IRE-Medgenix, Fleurus, Belgium) and serum adiponectin (Quantikine, R&D Systems, Minneapolis, MN) were measured. C-reactive protein was determined by enzymatic methods (Wako Parel Chemicals, Neuss, Germany). Concentrations of circulating hepcidin, soluble transferrin receptor (sTfR), and ferritin were measured by using a double monoclonal sandwich enzyme immunoassay [DRG® Hepcidin 25 (bioactive; EIA-5258; DRG International, Inc., Marburg, Germany); human sTfR ELISA (RD194011100, Heidelberg, Germany); and ELISA human serum ferritin (CAN-F-4280, Gentaur, Kampenhout, Belgium), respectively]. Intra-assay and interassay coefficients of variation were between 5% and 15%.
The iron markers were measured in a stored serum biobank retrospectively from the initial trial (17).
Statistical analyses
Statistics were performed by using SPSS software 12.0 (IBM Inc., Armonk, NY). Data are presented as mean ± SD. We used a paired Student t test to compare data before and after each intervention. Linear regression and Spearman correlation were used to analyze associations between serum biomarkers and SAT gene expression, Bonferroni adjustment was performed. A generalized linear model with repeated measures was performed to analyze the effect of overfeeding on distribution of SAT and VAT, with serum FT as a between-participant factor. A P value < 0.05 was considered to indicate a statistically significant difference.
Results
Table 1 features anthropometric and clinical parameters of the cohort before and after intervention.
Anthropometric and Clinical Parameters Before and After the Overfeeding Intervention
| Variable | Baseline (n = 26) | 56 Days After Overfeeding (n = 26) |
|---|---|---|
| Age, y | 30 ± 9 | |
| Weight, kg | 77.5 ± 10.6 | 79.7 ± 11.2a |
| BMI, kg/m2 | 24.7 ± 3.1 | 25.4 ± 3.2a |
| Waist, cm | 87 ± 9 | 89 ± 9a |
| Subcutaneous adipose area, cm2 | 162 ± 85 | 179 ± 103a |
| Visceral adipose area, cm2 | 169 ± 150 | 183 ± 142 |
| Fasting ferritin, ng/mL | 92 ± 57 | 67 ± 43a |
| Hepcidin, ng/mL | 9.2 ± 5.8 | 7.6 ± 3 |
| STf receptor, μg/mL | 0.9 ± 0.3 | 0.9 ± 0.2 |
| Fasting glucose, mM | 5.2 ± 0.3 | 5.3 ± 0.4 |
| Fasting insulin, mIU/L | 8.6 ± 2.5 | 9.2 ± 2.2 |
| Adiponectin, μg/mL | 5.2 ± 2.2 | 6.0 ± 3.1 |
| CRP, mg/dl | 0.8 ± 0.6 | 1.1 ± 1 |
| Dietary iron intake, mg/d | 11 ± 3 | 13 ± 3a |
| Respiratory quotient | 0.8 ± 0.1 | 0.8 ± 0.1 |
| Carbohydrate oxidation rate, mg ⋅ kg−1 ⋅ min−1 | 1.0 ± 0.4 | 1.0 ± 0.6 |
| Lipid oxidation rate, mg ⋅ kg−1 ⋅ min−1 | 0.9 ± 0.2 | 0.8 ± 0.2 |
| Resting energy expenditure, kcal/d | 1760 ± 185 | 1790 ± 211 |
Data are expressed as mean ± SD. Paired Student t test was used to compare data before and after each intervention. BMI, body mass index.
P < 0.01 using the Student paired t test.
Baseline
The 26 volunteers were 30 ± 9 years old, without obesity (body mass index, 24.7 ± 3.1 kg/m2), did not have type 2 diabetes or inflammation, and had normal iron status.
At baseline (day 0), serum FT levels were in the normal range (13 to 200 ng/mL), were positively associated with serum hepcidin (linear regression, R = 0.7; P < 0.01), and negatively with sTfR (linear regression, R = 0.4; P = 0.03). Serum FT levels were negatively associated with expression of lipid storage (DGAT2, SCD) with lipogenesis (SREBF1, ACSL1)-related genes in SAT (Table 2;Fig. 1) and positively associated with expression of lipid storage gene (CIDEA). No significant correlations between serum ferritin levels and age, body mass index, fat mass, fat distribution (SAT or VAT), or dietary iron intake were found.
Spearman Correlation Between Serum FT, Iron Gene Expression in AT, and Lipid Storage Gene Expression in SAT at Baseline and 56 Days After Overfeeding (n = 16)
| Gene | Baseline | 56 Days After Overfeeding | ||||||
|---|---|---|---|---|---|---|---|---|
| Serum Ferritin | AT | Serum Ferritin | AT | |||||
| Tf | SLC40A1 | FTL | Tf | SLC40A1 | FTL | |||
| SCD | −0.6a | 0.7b | −0.1 | −0.5 | −0.4 | 0.7b | −0.3 | −0.5 |
| DGAT2 | −0.7b,c | 0.5 | 0.5 | −0.6 | −0.4 | 0.7b | −0.7b | −0.5 |
| SREBF1 | −0.5a | 0.3 | 0.1 | −0.6a | −0.3 | 0.4 | −0.3 | −0.4 |
| mitoNEET | −0.3 | −0.3 | 0.1 | −0.4 | 0.1 | 0.2 | −0.2 | −0.7b |
| ACLY | −0.5 | 0.3 | −0.2 | 0.3 | −0.1 | 0.6 | −0.3 | −0.2 |
| CIDEA | 0.6a | 0.2 | -0.6a | 0.4 | 0.1 | 0.1 | −0.1 | 0.1 |
| Lipin 1 | −0.4 | 0.6a | −0.2 | −0.4 | −0.1 | 0.7a | −0.4 | −0.4 |
| ACSL1 | −0.7a | 0.6a | 0.2 | −0.1 | −0.1 | 0.5 | −0.5 | −0.1 |
Correlation was performed by using nonparametric (Spearman) test among SAT gene expression. For serum ferritin correlations, lipid storage gene expression was analyzed by quantitative RT-PCR. For correlations between iron gene expression and lipid storage expression, microarray data were used.
P < 0.05.
P < 0.01.
P < 0.006 after Bonferroni correction.
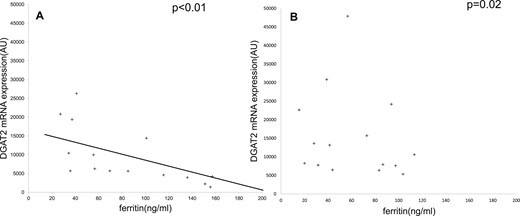
SAT DGAT2 mRNA expression using quantitative RT-PCR according to serum ferritin before (A) and after (B) overfeeding. (A) Spearman correlation between serum ferritin and DGAT2 gene expression at baseline. (B) After overfeeding, the correlation between serum ferritin and DGAT2 gene expression was absent. The mRNA level of DGAT2 was measured by quantitative RT-PCR and normalized by using hypoxanthine-guanine phosphoribosyltransferase mRNA expression in SAT biopsy specimens. AU, arbitrary unit.
FTL gene expression in SAT was negatively correlated with expression of SREBF1, coding SREBP1c, a master regulator of lipogenesis (Table 2), whereas Tf gene expression was positively correlated with the expression of genes linked to intracellular fatty acid storage (SCD) and lipogenesis (lipin 1,ACSL1) (Table 2)(18). The expression of the ferroportin 1 gene (SLC40A1) was negatively correlated with CIDEA.
Through use of FTL and Tf gene expression as surrogate markers of AT iron content and serum FT as a surrogate marker of body iron stores, these results show a negative relationship between the expression of genes linked to SAT expansion and body iron content.
56 days after overfeeding
The participants gained 2.3 ± 1.3 kg, with an increase in subcutaneous adipose area (Table 1). Glycemia, insulinemia, adiponectin, and CRP were unchanged.
Serum FT decreased from 92 ± 57 ng/mL to 67 ± 43 ng/mL, suggesting a decrease in body iron content. Serum FT remained correlated to both hepcidin (R = 0.8l P < 0.001) and sTfR (R = −0.6; P < 0.01); nonetheless, the mean circulating values of hepcidin and sTfR were unchanged after overfeeding. There was no link between serum FT at day 56 and fat mass or VAT and SAT expansion.
In contrast to baseline, the correlations between serum FT and the expression of several genes related to lipid metabolism were no longer significant (Fig. 1B; Table 2). However, baseline serum FT levels were positively correlated with the 56-day increase in SCD and DGAT2 gene expression (percentage increase in gene expression at day 56 from baseline, Spearman coefficient, 0.6 and 0.8, respectively; P < 0.05).
The expression of genes linked to lipid storage (SCD, DGAT2, SREBF1) (Fig. 2) in SAT was increased after overfeeding, as previously reported (17). Of note, the 56-day increases in SAT, DGAT2, and SCD gene expression were negatively correlated with their baseline expression (R = −0.6, P = 0.01 for DGAT2; R = −0.6, P = 0.06 for SCD). MitoNEET was also upregulated by overfeeding (Fig. 2). In addition to lipid metabolic genes, there were significant changes in the expression of iron-related genes, as evidenced by increased mRNA levels of: Tf (1.4 ± 0.2-fold change; P < 0.01), Hephaestin (1.6 ± 0.2-fold change; P < 0.01), SLC40A1 (1.4 ± 0.1-fold change; raw P < 0.01), and decreased expression of FTL (0.9 ± 0.0-fold change; P = 0.03) after overfeeding (Fig. 2). Hepcidin and TfRC mRNA in SAT were unaffected by overfeeding.
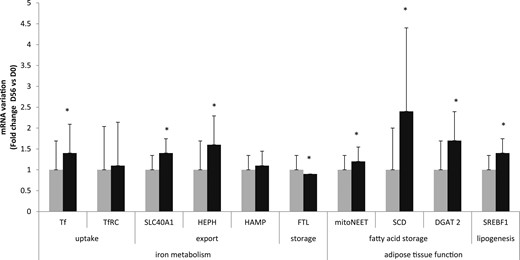
Comparison of mRNA expression of TF, SLC40A1, FTL, mitoNEET, SCD, DGAT2, and SREBF1 by microarray before (gray bars) and after (black bars) overfeeding. Data are expressed as mean ± SD. Statistical analyses were performed by using a paired t test. *P < 0.05. D, day; HAMP hepcidin; HEPH, hephaestin.
On the other hand, Tf gene expression in SAT at day 56 was positively correlated with DGAT2, SCD, and lipin 1 gene expression (Table 2) (18), whereas SLC40A1 and FTL mRNA were negatively correlated with DGAT2 and mitoNEET, respectively. The decrease in FTL expression (fold change at day 56 vs day 0) during the intervention was associated with the increase in SCD and ACSL1 expression [fold change at day 56 vs day 0, R = −0.6, P = 0.04 for SCD (Fig. 3); R = −0. 6, P = 0.02 for ACSL1].
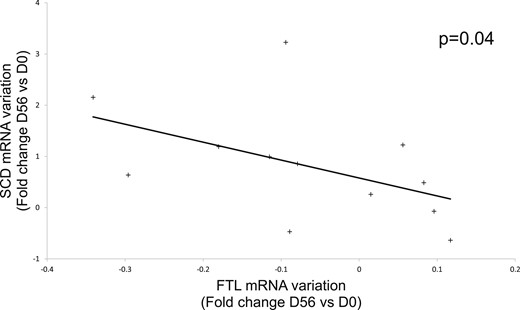
Spearman correlation between FTL mRNA variation (fold change at D56 vs D0) and SCD mRNA variation (fold change at D56 vs D0) by microarray. The + corresponds to one subject of the study.
Before and after overfeeding, no significant correlations between serum iron biomarkers and SAT expression of iron metabolism–related genes were found. There was no link between iron markers and serum adiponectin or adiponectin expression in SAT.
Discussion
In the current study, we investigated the potential links between iron metabolism and SAT physiology in human, taking advantage of a previously performed high-fat overfeeding intervention in participants without obesity. By using surrogate markers of iron content (iron metabolism gene expression in SAT and serum FT), data from this retrospective analysis suggest a negative association between iron content and the expression of genes linked to lipogenesis and lipid storage in SAT. The high-fat overfeeding diet led to fat mass gain and increased SAT expression of genes linked to lipogenesis and lipid storage in parallel to modifications of iron metabolism related genes expression.
The link between iron and AT metabolism has been mostly studied in obesity, and it was shown that obesity is associated with iron overload in AT (4, 13), elevated serum FT due to inflammation, but low iron stores due to increased hepcidin (19). In persons without obesity, serum FT, independently of inflammation, has been correlated positively to abdominal AT surface (14). Because fat mass expansion seems to be positively associated with accumulation of body or AT iron, we used a 56-day overfeeding diet, which led to moderate but significant AT expansion, to investigate the potential links between AT and iron metabolism during a dynamic situation of weight gain of participants without obesity and body iron stores in the reference range.
Baseline body and AT iron are associated with markers of AT expandability
In line with studies on rodents showing higher lipid storage capacity when iron content is low in AT (5, 10, 11), a positive association between SAT Tf expression, PPARγ (an adipogenic gene), and FASN (fatty acid synthase, a lipogenic gene), has been previously described in humans (12). Our results confirm this link between iron metabolism and AT expandability. Using indirect markers of iron content (Tf, SLC40A1, and FTL gene expression in AT and serum FT), we found that both body iron and SAT iron were negatively associated with the expression of genes related to lipid storage (DGAT2, SCD) and to lipogenesis (SREBF1, Lipin1, ACSL1), suggesting an inverse relationship between SAT capacity to expand and iron content. In agreement with this assumption, a recent study in ob/ob mice demonstrated that the prevention of AT iron accumulation mediated by deferoxamine administration resulted in a significant improvement in AT physiology, increasing adipogenesis and insulin signaling and decreasing adipocyte size (20). In addition, several studies have shown that iron overload was associated with decreased adiponectin secretion by adipocytes (4, 5), via a FOX1 repression of adiponectin transcription by iron. Because adiponectin promotes AT expansion (21), it could be a mediator of the association between iron and AT function. Nevertheless, our study could not confirm this hypothesis because we did not find any association between iron and adiponectin (serum and gene expression in SAT). The association between AT expandability and iron may be linked to oxidative stress. Iron may contribute to oxidative stress by the production of toxic free radicals (22). A study in animal models recently showed (23) that increased oxidative stress in adipose tissue was associated with a downregulation of lipid storage genes in SAT, contributing to a smaller high-fat diet–induced SAT expansion. Further studies are thus warranted to define more precisely the relation between iron and AT expandability, but together with the published data, our observation in healthy participants without obesity suggest that iron content, by limiting AT expandability, could favor ectopic lipid deposition.
Expansion of AT during high-fat overfeeding and changes in AT iron markers
Fifty-six days of overfeeding led to an increase of Tf, SLC40A1, and hephaestin and a decrease in FTL gene expression in SAT. Because intracellular iron content regulates the expression of these genes, these data suggest decreased SAT iron content with overfeeding, possibly by the increase of iron demand required for AT expansion–associated adipogenesis (3). This hypothesis needs to be confirmed by the measurement of protein expression and iron content in AT, which was not feasible in the current study. In line with our previously published data (12), TfRC expression was unchanged after overfeeding, although this gene is also known to be regulated by intracellular iron content (5). This suggests that the observed changes in iron-related SAT gene expression during overfeeding could also be due to the alteration of other parameters, such as the modulation of lipid concentration. Indeed, our previous report suggested that, in vitro, palmitate could modulate adipocyte Tf gene expression (3). In parallel to these effects on AT iron gene expression, AT capacity to store lipid was increased, as reflected by increased expression of mitoNEET, SCD, DGAT2, and SREBF1. Interestingly, Tf and DGAT2, SCD, and lipin 1 expression were positively correlated after overfeeding, whereas the variation with overfeeding of FTL was negatively associated with SCD and ACSL1 variations, suggesting that the decrease in AT iron content may have enhanced the effect of overfeeding on the increased lipid storage and lipogenesis capacity.
The association between iron metabolism and lipid storage–related genes in SAT may be linked to mitoNEET, an iron-sulfur cluster mitochondrial protein. Overexpression of mitoNEET in rodents is associated with an expansion of AT and a lower rate of β oxidation in adipocytes. It also leads to a decrease in mitochondria iron concentration, iron being a rate-limiting component of electron transport chain activity (24). We found a negative correlation between mitoNEET gene expression and FTL gene expression, confirming our previously published study (25) in which mitoNEET (also known as CISD1) was negatively associated with iron accumulation genes (FTL and CYBA, cytochrome B-245 alpha chain). Overfeeding was associated with increased expression of mitoNEET, which paralleled the decrease in expression of FTL gene, strengthening the suggested link between lipid storage gene expression and iron metabolism.
On the basis of microarray data, hepcidin gene expression was unchanged after overfeeding. In human, hepcidin was expressed at negligible levels in SAT of lean persons (12) but overexpressed in SAT of persons with obesity (4). In our study, the moderate weight gain did not affect hepcidin gene expression, in accordance with the evolution of serum hepcidin. Because hepcidin expression is positively regulated by inflammation, this could be due to the fact that the moderate weight gain did not induce inflammation (neither macrophage and lymphocytes content in SAT nor serum CRP and proinflammatory cytokine levels were modified during overfeeding) (17).
Therefore, the present work is an exploratory study on iron and lipid storage gene expression. AT expansion is a tightly regulated mechanism that depends on extrinsic (dietary composition, duration of overfeeding) and intrinsic (sex, genetic background) parameters (26), and that adipocyte iron content might play a role in this process, partly through the regulation of lipid storage gene expression as observed here, remains a hypothesis. Complementary overfeeding studies with modulation of iron content by supplementation or chelators are needed to clarify the physiological links between iron and AT expansion.
Although dietary iron intake was increased after the intervention, the moderate weight gain provoked by 56 days of overfeeding was associated with a decrease in serum FT; however, serum hepcidin remained unchanged. A high-fat diet study on rodents (27) previously suggested that this decrease in serum FT could be explained by decreased intestinal iron uptake. However, we did not monitor the regulation of intestinal iron uptake during this overfeeding protocol to confirm this hypothesis.
Surprisingly, variation of expression of lipid storage genes (DGAT2 and SCD) during overfeeding was associated with baseline serum FT. The greater the baseline serum FT concentration, the greater the increase in SAT gene expression linked to lipid storage during overfeeding. This is in line with our previous in vitro results showing that iron supplementation led to increased adipogenesis in a dose-dependent manner (3). However, these in vitro results cannot be extrapolated directly to in vivo conditions. Our data could also be explained by the fact that the participants presenting with lower baseline SAT DGAT2 and SCD gene expression were the ones who had the greatest increase in the expression of those lipid storage genes after overfeeding. Furthermore, serum FT was no longer related to SAT gene expression after overfeeding, suggesting that additional factors certainly contribute to the regulation of the expression of lipid storage genes in SAT after overfeeding (26).
Limitations
Our study has several limitations that could pose bias in its interpretation. The decrease in serum FT may have been eventually linked to the blood withdrawal (400 mL in total during the protocol) for the study samples (28). Also, the evolution of body iron stores with overfeeding complicates the interpretation of our data because it could have contributed to a decrease in AT iron content. Moreover, we had no AT material to analyze iron metabolism at the protein level or to directly quantify iron content. Furthermore, for ethical reasons, we had no VAT biopsies with which to extend or refute our conclusion regarding VAT. Our study was performed on men, and results cannot be extrapolated to women. Finally, although we observed an association between iron stores and metabolic gene expression as markers of AT expandability, we did not find associations with direct measures of fat depot volume assessed by MRI, perhaps because of the low magnitude of the weight gain and the lack of sensitivity of the imaging technique. Nonetheless, our study presents several strengths. It overviews the links between iron metabolism and AT functionality in healthy humans without obesity by studying plasma iron and SAT iron gene expression in parallel of SAT gene expression linked to lipid storage during a high-fat overfeeding diet.
Conclusion
Our data suggest that iron accumulation, in plasma and in AT, despite being in the normal range, could limit the SAT capacity to expand in healthy persons during a dynamic period of controlled weight gain. The moderate AT expansion during the high-fat overfeeding diet is associated with altered iron metabolism gene expression, suggesting a decrease in iron content in SAT. Complementary overfeeding studies modulating iron stores are needed to decipher the mechanisms and the exact links between iron metabolism and AT physiology in vivo in humans.
Abbreviations:
- ACLY
ATP citrate lyase
- ACSL1
acyl-CoA synthetase long chain family member 1
- AT
adipose tissue
- CIDEA
cell death–inducing DFFA-like effector A
- CRP
C-reactive protein
- CYBA
cytochrome B-245 alpha chain
- DGAT2
diacylglycerol O-acyltransferase homologue 2
- FASN
fatty acid synthase
- FT
ferritin
- FTL
ferritin light chain
- SAT
subcutaneous adipose tissue
- SCD
stearoyl CoA desaturase
- SLC40A1
solute carrier family 40 member 1
- SREBF1
sterol regulatory element binding transcription factor 1
- sTfR
soluble transferrin receptor
- Tf
transferrin
- TfRC
transferrin receptor
- VAT
visceral adipose tissue
Acknowledgments
The authors acknowledge the FATBANK platform promoted by the CIBER (Centro de Investigación Biomédica en Red) de la Fisiopatología de la Obesidad y la Nutrición and the IDIBGI (Institut d’Investigació Biomèdica de Girona) Biobank (Biobanc IDIBGI, B.0000872), integrated in the Spanish National Biobanks Network, for their collaboration. The volunteers are acknowledged for their contribution to the study.
Financial Support: This work was supported by research grants from Hospices Civils de Lyon (to M.L.), from Programme Hospitalier de Recherche Clinique Interregional (to M.L.), Agence Nationale de la Recherche (Programme national de recherche en nutrition humaine and Programme National de Recherches en Alimentation-Metaprofile; M.L.), Institut Benjamin Delessert (to B.S.), Innovation Stratégique Industrielle program of Agence pour l’Innovation OSEO (IT-DIAB project; to M.L.), Instituto de Salud Carlos III from Spain (PI15/01934; to J.M.F.-R.), FEDER funds, and CIBER de la Fisiopatología de la Obesidad y la Nutrición (CIBERobn; to J.M.F.-R.). The CIBERobn is an initiative from the Instituto de Salud Carlos III.
Clinical Trial Information: ClinicalTrials.gov no. NCT00905892 (registered 21 May 2009).
Author Contributions: J.M.M.-N., M.A., H.V., and M.L. contributed to the study design; J.M.M.-N., M.A., and J.M.F.-R. contributed to data collection; B.S., J.M.M.-N., K.S., E.M., J.-A.N., J.M.F.-R., and M.L. did the analysis and wrote the manuscript.
Current Affiliation: K. Seyssel’s current affiliation is the Department of Physiology, Faculty of Biology and Medicine, University of Lausanne 1005 Lausanne, Switzerland.
Disclosure Summary: The authors have nothing to disclose.
