


Abstract
Body-weight fluctuation (weight cycling) has been found to be associated with higher mortality and cardiovascular events in patients with coronary artery disease. However, there are very limited data regarding the relationship between body-weight fluctuation and health-related outcomes in the general population.
We examined whether body-weight fluctuation can associate incident diabetes mellitus and cardiovascular events, and mortality in a Korean population from the Korean Genome and Epidemiology Study. The intraindividual fluctuations of body weight were calculated by average successive variability (ASV); health-related outcomes were collected every 2 years for 16 years in 3,678 participants.
Participants with a high ASV of body weight were more obese and had higher blood pressure and HbA1c levels at baseline than those with a low ASV of body weight. A 1-unit increase in ASV of body weight was associated with increase in mortality (HR, 1.46; 95% CI, 1.32 to 1.62; P < 0.001). However, the association between the ASV of body weight and incident diabetes mellitus seemed to be influenced by baseline body mass index (BMI): negative effect in subjects with BMI <25 kg/m2 (HR, 1.36; 95% CI, 1.11 to 1.65; P = 0.003) and protective effect in those with BMI ≥25 kg/m2 (HR, 0.76; 95% CI, 0.60 to 0.95; P = 0.014). There was no association between the ASV of body weight and cardiovascular event.
Body-weight fluctuation was associated with mortality. In addition, the effect of body-weight fluctuation on incident diabetes mellitus depended on the presence of obesity at baseline.
Obesity and overweight are correlated with diverse chronic diseases such as diabetes mellitus, dyslipidemia, hypertension, cardiovascular disease, and cancer (1). Body-weight reduction shows protective effects for these diseases (2), but in contrast, unintended body-weight loss could be a bad indication (3, 4). In addition, body-weight regain is common in treatment of obesity (5) and is potentially harmful (6). According to a study in mice, weight cycling induced greater adipose tissue inflammation and insulin resistance than a consistently obese state (7). A human study showed that body-weight fluctuation was related to poorer body-fat distribution (8). Increasing physical activity and exercise could prevent body-weight fluctuation after weight loss (9); therefore, maintaining body weight after body-weight reduction could reflect physical activity. In this regard, body-weight fluctuation should be assessed as an important clinical factor for chronic diseases. In general, it is easy to assess the degree of obesity with body mass index (BMI), and obesity is associated with diverse health-related outcomes (10). However, BMI shows nonlinear association with mortality (11, 12), and body fatness is characterized differently across ethnicity and sex. New parameters that represent health-related outcomes directly, that can be applied to the general population, and that are driven by a simple measurement or equation, would be useful for the assessment of obesity-related health risks.
Previous studies have tested whether body-weight cycling or fluctuation is a prognostic marker for mortality in individuals with high cardiovascular risk, including middle-aged men (9), obese postmenopausal women (13), and older adults (14). A more recent study showed that body-weight variability, which was defined as average successive variability (ASV), was significantly associated with a coronary event and mortality in a post hoc analysis of the Treating to New Target trial (15). This study enrolled patients with clinically evident coronary heart disease, and an important association was shown only in individuals who are overweight or obese. Therefore, this finding needs to be confirmed in the general population, including in lean individuals and those naïve to coronary artery disease. Furthermore, the association between body-weight fluctuation and health-related outcome was inconsistent according to differences in study population, outcome measurement, and observation duration. For instance, a cohort study including high-risk, middle-aged men showed a positive association between weight cycling and mortality only in a subgroup with low BMI (9). Other population-based studies showed very limited influence of body-weight variability on health-related outcomes (16, 17).
The primary aim of our present study was to investigate the contribution of body-weight variability as assessed by ASV to new-onset diabetes mellitus, cardiovascular events, and mortality in the community-dwelling population. We also assessed these outcomes after adjusting for traditional risk factors. To our knowledge, there are no previously reported data about body-weight fluctuation and mortality in an Asian population.
Methods
Study population
The Ansung Cohort is part of the Korean Genome and Epidemiology Study, and is a prospective community-based cohort study to evaluate noncommunicable disease and its related risk factors (18). This cohort study recruited individuals aged 40 to 69 years in 2001−2002 and followed them biannually. The last data were obtained in November 2016, and the study is ongoing. Among 5018 individuals at the baseline evaluation, body weight data were measured more than four times in 3857 participants. We excluded participants who had thyroid disease (n = 105), chronic obstructive pulmonary disease (n = 39), and cancer (n = 35) at baseline, and analyzed data of 3678 participants. For analysis of diabetes mellitus, we excluded subjects who were diagnosed with diabetes mellitus. Similarly, we excluded previous cardiovascular event in analyzing cardiovascular event. In the case of cancer occurrence during follow-up, the events were censored. The study protocol was previously approved by the Ethics Committee of the Korean Center for Disease Control and the Institutional Review Board of Ajou University School of Medicine (No. AJIRB-CRO-07-012). All participants provided their written informed consent before enrollment.
Procedures
Exposure assessment
Body weight and height were measured using an electronic scale at each visit and BMI was calculated as weight (kg)/height2 (m2). The intraindividual body-weight variability was defined by ASV as the mean of each body-weight change (12). The ASV of body weight was calculated using body weight at each follow-up (Bwtn) using the following formula: |Bwt1 − Bwt2| + |Bwt2 − Bwt3| + ··· + |Bwtn−1 − Bwtn|/n−1. We calculated the ASV of body weight by including the body-weight values from baseline to just before the event was captured. Because the body weight of enrolled subjects was measured more than four times, we included data for mortality that occurred after the fourth visit. For analysis of incident diabetes mellitus and cardiovascular disease, we included the body-weight data from baseline to the last visit before the event. Therefore, we included data for diabetes mellitus and cardiovascular events that occurred after the fifth visit. Corresponding time variables were calculated from baseline to the event. We defined the time of the event as the time when we evaluated the subjects during follow-up.
Assays for clinical factors
Systolic and diastolic blood pressure were measured after 10 minutes of relaxation. A blood sample at baseline was drawn after 12 hours of fasting, and laboratory tests were performed at a central laboratory. Fasting plasma glucose, total cholesterol, triglycerides, high-density lipoprotein (HDL) and low-density lipoprotein (LDL) cholesterol, aspartate aminotransferase, alanine aminotransferase, γ-glutamyl transpeptidase, blood urea nitrogen, and creatinine were measured using a Hitachi 747 chemistry analyzer (Hitachi, Tokyo, Japan). HbA1c levels were assayed using high-performance liquid chromatography (Variant II; Bio-Rad Laboratories, Hercules, CA). Fasting plasma insulin levels were measured by radioimmunoassay (Insulin-IRMA; BioSource, Nivelles, Belgium). Insulin resistance was calculated using a homeostasis model assessment of insulin resistance (HOMA-IR) (19). High-sensitivity C-reactive protein (hsCRP) was measured by immunoradiometric assay (ADVIA 1650, Bayer Diagnostics, Tarrytown, NY). Sociodemographic information and comorbidities were gathered by questionnaire. We performed a subgroup analysis according to smoking status and baseline BMI. A never smoker was defined as an individual who smoked <20 packs of cigarettes in a lifetime, and a healthy subject was free of diabetes mellitus, hypertension, dyslipidemia, and cardiovascular disease at baseline.
Outcomes
Mortality data were driven by the death statistics from the Korean National Statistical Office, and researchers cross-checked this information by individual contact. Cardiovascular diseases included acute myocardial infarction, coronary artery diseases, cerebrovascular disease, and peripheral artery disease. Baseline and follow-up events of cardiovascular disease were recorded using a structured questionnaire. HbA1c and standard 75-g oral glucose tolerance test were performed biannually, and the diabetes was defined by the American Diabetes Association criteria (20).
Statistical analysis
Data are expressed as means with SDs, n (%), or HRs with 95% CIs. We compared means in two groups using a Student t test, and compared categorical variables using a χ2 test. The body-weight variability was used both as a continuous and a categorical variable. The incidence of diabetes mellitus, cardiovascular events, and mortality was calculated using a Cox proportional hazards model with the ASV of body weight as a continuous variable. In this model, we analyzed the increase in each outcome per 1-unit increase in the ASV of body weight. In addition, we adjusted for possible confounding factors: mean body weight, age, sex, HbA1c, systolic blood pressure, LDL cholesterol, previous cardiovascular disease, smoking status, and body weight change. We categorized participants into two or five groups. For two groups, we used the median value of the ASV of body weight as a cutoff, and next divided them into quintiles of ASV of body weight. A Pearson correlation analysis was applied to analyze the correlation between HOMA-IR and the ASV of body weight. All analyses were performed using IBM SPSS Statistics for Windows (version 22.0) or R (version 3.3.2). Two-sided P values were calculated and those <0.05 were considered significant.
Results
We enrolled 1616 men and 2062 women in this analysis. The mean numbers of measurement points of body weight were 6.9 (SD, 1.4), 6.3 (SD, 1.0), and 7.0 (SD, 1.3) for diabetes mellitus, cardiovascular event, and mortality, respectively. The baseline and mean body weight during follow-up for entire cohort was 61.5 kg (SD, 9.9), and 61.0 kg (SD, 9.9), respectively. The δ change of body weight from baseline to the last observation was −1.30 kg (SD, 4.95). The median ASV of body weight was 1.75; we divided participants into two groups using this cutoff value. Table 1 shows baseline characteristics of participants according to body-weight variability status. There was no difference in age and sex distribution between participants with low or high body-weight variability. However, participants with high body-weight variability were more obese and lost more body weight than those with low body-weight variability. Blood pressure, fasting glucose, and HbA1c levels were higher in the high body-weight variability group than in its counterpart. At baseline evaluation, more participants in the group with high body-weight variability had hypertension (28.6% vs 25.6%, P = 0.049), diabetes mellitus (13.8% vs 9.4%, P < 0.001), or cardiovascular disease (3.7% vs 2.1%, P = 0.004). Differences in baseline characteristics of subjects according to their body-weight variability for analysis of diabetes mellitus and cardiovascular event are shown in the online repository (21), respectively. Participants with high body-weight variability show consistently higher body weight and BMI compared with those who have low body-weight variability. However, in contrast to the analysis of mortality and cardiovascular events, in the analysis of incident diabetes mellitus, body-weight change did not differ between participants with high and low body-weight variability. Moreover, baseline fasting plasma glucose and HbA1c levels were comparable between the two groups in the analysis of incident diabetes mellitus.
Baseline Characteristics of Study Participants According to Their Body-Weight Variability For Analysis of Mortality
| Low Body-Weight Variability (n = 1829) | High Body-Weight Variability (n = 1849) | Total (n = 3678) | P | |
|---|---|---|---|---|
| Age, y | 55.2 (8.6) | 55.4 (8.7) | 55.3 (8.6) | 0.301 |
| Men | 781 (42.7%) | 835 (51.7%) | 1616 (43.9%) | 0.135 |
| Body weight, kg | 60.1 (9.3) | 63.0 (10.2) | 61.5 (9.9) | <0.001 |
| Body-weight change, kga | −1.00 (3.75) | −1.60 (5.89) | −1.30 (4.95) | <0.001 |
| BMI, kg/m2 | 24.1 (3.1) | 24.9 (3.4) | 24.5 (3.2) | <0.001 |
| SBP, mm Hg | 121.0 (18.0) | 122.7 (17.5) | 121.9 (17.8) | 0.005 |
| DBP, mm Hg | 76.8 (10.3) | 77.8 (10.4) | 77.3 (10.4) | 0.006 |
| FPG, mmol/L | 4.8 (0.9) | 4.9 (1.1) | 4.9 (1.0) | 0.005 |
| HbA1c | <0.001 | |||
| % | 5.6 (0.8) | 5.7 (1.0) | 5.6 (0.9) | |
| mmol/mol | 38 (8.7) | 39 (10.9) | 38 (9.8) | |
| Total cholesterol, mg/dL | 188.9 (33.8) | 188.8 (35.0) | 188.9 (34.4) | 0.951 |
| HDL cholesterol, mg/dL | 46.9 (11.0) | 45.9 (10.8) | 46.4 (10.9) | 0.004 |
| Triglycerides, mg/dL | 158.0 (101.0) | 163.4 (112.8) | 160.7 (107.1) | 0.125 |
| LDL cholesterol, mg/dL | 113.6 (33.4) | 114.4 (35.7) | 114.0 (34.6) | 0.471 |
| AST, IU/L | 27.7 (19.0) | 27.5 (15.5) | 27.6 (17.4) | 0.776 |
| ALT, IU/L | 25.3 (22.2) | 25.9 (20.9) | 25.6 (21.5) | 0.441 |
| GGT, IU/L | 34.1 (54.2) | 34.3 (67.7) | 34.2 (61.3) | 0.951 |
| BUN, mg/dL | 14.1 (3.7) | 14.3 (3.8) | 14.2 (3.7) | 0.076 |
| Creatinine, mg/dL | 0.79 (0.20) | 0.80 (0.17) | 0.80 (0.19) | 0.086 |
| hsCRP, mmol/L | 0.25 (0.64) | 0.25 (0.64) | 0.25 (0.68) | 0.913 |
| HOMA-IR | 1.8 (1.8) | 1.8 (1.3) | 1.8 (1.6) | 0.268 |
| Current smoker | 423 (23.6%) | 501 (27.6%) | 924 (25.6%) | 0.021 |
| Hypertension | 496 (25.6%) | 528 (28.6%) | 997 (27.1%) | 0.049 |
| Diabetes mellitus | 171 (9.4%) | 252 (13.8%) | 423 (11.6%) | <0.001 |
| Cardiovascular disease | 39 (2.1%) | 69 (3.7%) | 108 (2.9%) | 0.004 |
Data are unadjusted means (± SDs) unless otherwise indicated.
Abbreviations: BUN, blood urea nitrogen; DBP, diastolic blood pressure; FPG, fasting plasma glucose; SBP, systolic blood pressure.
Body-weight change was calculated by the difference of body weight from baseline to final visit. P values were determined using Student t and χ2 tests.
During a median follow-up period of 14.0 years, 90 in the low body-weight variability group (4.9%) and 173 in the high body-weight variability group (9.4%) died (P < 0.001). Of the 263 deaths observed, 43 were from cardiovascular cause. Twelve and 31 subjects in the low and high body-weight variability group died of cardiovascular causes, respectively (0.7% vs 1.7%, P = 0.005). There were no differences in cardiovascular event rates in the group with high body-weight variability (65 events) than in the group with low body-weight variability (53 events) (4.4% vs 3.6%, P = 0.301). The participants in the group with high body-weight variability developed diabetes mellitus similarly with the participants in the group with low body-weight variability (117 cases vs 115 cases; 8.4% vs 8.5%, P = 0.945). When comparing event rates between quintiles, the rate of mortality increased with each higher quintile of body-weight variability, but there was no increasing trend in diabetes mellitus or cardiovascular events (Fig. 1).
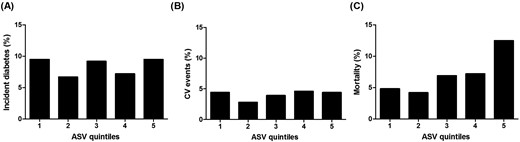
Quintiles of body-weight variability: (A) incident diabetes mellitus, (B) CV event, and (C) all-cause mortality. CV, cardiovascular.
We assessed the HRs for incident diabetes mellitus, cardiovascular disease, and mortality using a Cox proportional hazards model with the ASV of body weight as a continuous variable. The unadjusted model showed that the HR for diabetes mellitus was 1.05 (95% CI, 0.91 to 1.21, P = 0.531), HR for cardiovascular disease was 1.11 (95% CI, 0.90 to 1.35, P = 0.329), and HR for mortality was 1.46 (95% CI, 1.32 to 1.62, P < 0.001) for each increase of 1 unit of body-weight ASV (Table 2; Fig. 2). The increased risk for mortality was consistent when adjusted for mean body weight, and body-weight change. In the fully adjusted model including for age, sex, HbA1c, systolic blood pressure, total cholesterol, HDL cholesterol, triglyceride, LDL cholesterol, hsCRP, smoking status, and body-weight change, the HR for mortality was not attenuated.
Body-Weight Variability and Risk of New-Onset Diabetes Mellitus, Cardiovascular Event, and Mortality
| Outcome | Model 1 | Model 2 | Model 3 | Model 4 | ||||
|---|---|---|---|---|---|---|---|---|
| HR (95% CI) | P | HR (95% CI) | P | HR (95% CI) | P | HR (95% CI) | P | |
| New-onset diabetes mellitus | ||||||||
| Male | 0.93 (0.72−1.21) | 0.591 | 0.90 (0.69−1.18) | 0.438 | 0.92 (0.70−1.20) | 0.540 | 0.91 (0.69−1.18) | 0.465 |
| Female | 1.11 (0.93−1.32) | 0.241 | 0.96 (0.80−1.16) | 0.699 | 0.95 (0.78−1.16) | 0.610 | 0.97 (0.80−1.19) | 0.779 |
| BMI <25.0 kg/m2 | 1.36 (1.11−1.65) | 0.003 | 1.43 (1.16−1.76) | 0.001 | 1.40 (1.13−1.74) | 0.002 | 1.36 (1.10−1.69) | 0.005 |
| BMI ≥25.0 kg/m2 | 0.76 (0.60−0.95) | 0.014 | 0.68 (0.54−0.85) | 0.001 | 0.67 (0.53−0.85) | 0.001 | 0.68 (0.54−0.86) | 0.001 |
| Healthy never smokers | 1.24 (0.95−1.62) | 0.117 | 1.06 (0.81−1.40) | 0.664 | 1.11 (0.82−1.51) | 0.496 | 1.11 (0.82−1.51) | 0.500 |
| Never smokers | 1.09 (0.91−1.32) | 0.339 | 0.93 (0.77−1.14) | 0.482 | 0.96 (0.78−1.18) | 0.688 | 0.97 (0.79−1.19) | 0.765 |
| Former or current smokers | 1.00 (0.78−1.28) | 0.990 | 0.93 (0.73−1.20) | 0.585 | 0.94 (0.73−1.20) | 0.605 | 0.93 (0.73−1.19) | 0.574 |
| Total | 1.05 (0.91−1.21) | 0.531 | 0.96 (0.82−1.11) | 0.561 | 0.96 (0.82−1.12) | 0.606 | 0.96 (0.82−1.12) | 0.611 |
| Cardiovascular event | ||||||||
| Male | 1.02 (0.72−1.44) | 0.909 | 1.02 (0.72−1.44) | 0.924 | 0.98 (0.69−1.39) | 0.898 | 0.96 (0.68−1.36) | 0.818 |
| Female | 1.16 (0.91−1.49) | 0.234 | 1.11 (0.87−1.44) | 0.403 | 1.12 (0.86−1.45) | 0.410 | 1.17 (0.90−1.52) | 0.257 |
| BMI <25.0 kg/m2 | 1.02 (0.75−1.40) | 0.895 | 1.04 (0.75−1.43) | 0.815 | 0.94 (0.68−1.29) | 0.702 | 0.91 (0.66−1.24) | 0.539 |
| BMI ≥25.0 kg/m2 | 1.14 (0.87−1.50) | 0.337 | 1.11 (0.84−1.46) | 0.452 | 1.12 (0.84−1.49) | 0.434 | 1.17 (0.88−1.57) | 0.289 |
| Healthy never smokers | 0.83 (0.45−1.54) | 0.554 | 0.83 (0.45−1.55) | 0.565 | 0.81 (0.43−1.54) | 0.528 | 0.83 (0.44−1.56) | 0.553 |
| Never smokers | 1.19 (0.92−1.53) | 0.181 | 1.12 (0.86−1.45) | 0.404 | 1.11 (0.85−1.45) | 0.435 | 1.15 (0.88−1.51) | 0.294 |
| Former or current smokers | 0.99 (0.70−1.39) | 0.948 | 0.98 (0.70−1.39) | 0.927 | 0.98 (0.69−1.39) | 0.911 | 0.96 (0.68−1.35) | 0.816 |
| Total | 1.11 (0.90−1.35) | 0.329 | 1.08 (0.88−1.32) | 0.471 | 1.06 (0.86−1.31) | 0.599 | 1.08 (0.87−1.33) | 0.495 |
| Mortality | ||||||||
| Male | 1.47 (1.26−1.72) | <0.001 | 1.53 (1.31−1.79) | <0.001 | 1.50 (1.27−1.76) | <0.001 | 1.47 (1.25−1.74) | <0.001 |
| Female | 1.47 (1.28−1.70) | <0.001 | 1.48 (1.28−1.71) | <0.001 | 1.52 (1.30−1.78) | <0.001 | 1.57 (1.33−1.85) | <0.001 |
| BMI <25.0 kg/m2 | 1.49 (1.29−1.71) | <0.001 | 1.50 (1.30−1.73) | <0.001 | 1.46 (1.26−1.69) | <0.001 | 1.46 (1.26−1.69) | <0.001 |
| BMI ≥25.0 kg/m2 | 1.53 (1.31−1.78) | <0.001 | 1.52 (1.29−1.78) | <0.001 | 1.52 (1.28−1.80) | <0.001 | 1.50 (1.25−1.79) | <0.001 |
| Healthy never smokers | 1.51 (1.15−1.97) | 0.003 | 1.69 (1.28−2.23) | <0.001 | 1.72 (1.30−2.27) | <0.001 | 1.66 (1.24−2.23) | 0.001 |
| Never smokers | 1.53 (1.33−1.76) | <0.001 | 1.54 (1.33−1.79) | <0.001 | 1.50 (1.29−1.75) | <0.001 | 1.54 (1.31−1.79) | <0.001 |
| Former or current smokers | 1.40 (1.19−1.65) | <0.001 | 1.51 (1.28−1.79) | <0.001 | 1.48 (1.25−1.76) | <0.001 | 1.45 (1.22−1.72) | <0.001 |
| Total | 1.46 (1.32−1.62) | <0.001 | 1.50 (1.35−1.66) | <0.001 | 1.48 (1.33−1.65) | <0.001 | 1.47 (1.32−1.64) | <0.001 |
Model 1 was unadjusted. Model 2 was adjusted for age, sex, and mean body weight. Model 3 was adjusted for the same variables as model 2 and for baseline HbA1c, systolic blood pressure, total cholesterol, HDL cholesterol, triglyceride, LDL cholesterol, hsCRP, and smoking status. Model 4 was adjusted for the same variables as model 3 and weight change.
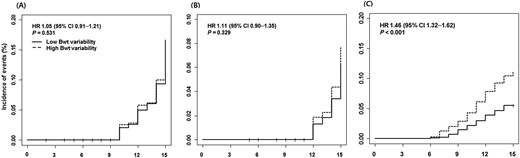
Time-to-event curve for (A) incident diabetes mellitus, (B) CV event, and (C) all-cause mortality. HR and P value were derived from Cox proportional hazards models.
In participants with a baseline BMI ≥25.0 kg/m2, increase in body-weight variability increased the risk for mortality (HR, 1.53; 95% CI, 1.31 to 1.78; P < 0.001). However, in this subgroup, the incidence of diabetes mellitus decreased with an increase in the ASV of body weight (HR, 0.76; 95% CI, 0.60 to 0.95; P = 0.014). By contrast, individuals whose BMI was <25.0 kg/m2 showed an opposite relationship between the ASV of body weight and the incidence of diabetes mellitus (HR, 1.36; 95% CI, 1.11 to 1.65; P < 0.001). Mortality showed consistent association between the ASV of body weight in this subgroup (HR, 1.49; 95% CI, 1.29 to 1.71; P < 0.001) (Table 2). When we performed a subgroup analysis according to smoking status, mortality was consistently related to the ASV of body weight both in groups of never smokers (HR, 1.53; 95% CI, 1.33 to 1.76; P < 0.001) and former or current smokers (HR, 1.40; 95% CI, 1.19 to 1.65; P < 0.001) (Table 2). Furthermore, the HR for mortality was highest in never smokers who were free from diabetes mellitus, hypertension, dyslipidemia, and cardiovascular disease at baseline (HR, 1.66; 95% CI, 1.24 to 2.23; P < 0.001) (Table 2).
When we divided the subjects into four groups according to baseline BMI and the direction of body-weight change, the subgroup with BMI ≥25 kg/m2 and weight loss showed a significant association between the ASV of body weight and occurrence of diabetes mellitus (HR, 0.64; 95% CI, 0.46 to 0.88; P = 0.006) (Table 3). In the subgroup with BMI <25 kg/m2 and weight gain, the higher body-weight ASV was related with increasing new-onset diabetes mellitus after adjusting body-weight change (HR, 1.63; 95% CI, 1.25 to 2.14; P < 0.001) (Table 3). However, body-weight change was only significantly associated with new-onset diabetes mellitus in the subgroup of obese and weight loss (HR, 1.24; 95% CI, 1.12 to 1.36; P < 0.006) (Table 3).
Association of Body-Weight Variability and Body-Weight Change With Risk of New-Onset Diabetes Mellitus According to Baseline BMI and Direction of Body-Weight Change
| ASV of Body Weight | Change of Body Weight | ||||||||
|---|---|---|---|---|---|---|---|---|---|
| Unadjusted Model | Adjusted Modela | Unadjusted Model | Adjusted Modelb | ||||||
| n | HR (95% CI) | P | HR (95% CI) | P | HR (95% CI) | P | HR (95% CI) | P | |
| BMI <25.0 kg/m2 and weight loss | 889 | 1.21 (0.85−1.73) | 0.297 | 1.34 (0.93−1.93) | 0.123 | 1.10 (0.97−1.23) | 0.126 | 1.12 (0.99−1.26) | 0.067 |
| BMI <25.0 kg/m2 and weight gain | 800 | 1.47 (1.15−1.87) | 0.002 | 1.63 (1.25−2.14) | <0.001 | 0.98 (0.89−1.09) | 0.733 | 0.92 (0.83−1.02) | 0.917 |
| BMI ≥25.0 kg/m2 and weight loss | 653 | 0.64 (0.46−0.88) | 0.006 | 0.75 (0.55−1.03) | 0.080 | 1.24 (1.12−1.36) | <0.001 | 1.22 (1.10−1.35) | <0.001 |
| BMI ≥25.0 kg/m2 and weight gain | 413 | 0.91 (0.66−1.26) | 0.576 | 1.00 (0.71−1.40) | 0.983 | 0.90 (0.80−1.02) | 0.093 | 0.90 (0.80−1.02) | 0.108 |
Adjusted by change of body weight.
Adjusted by ASV of body weight.
Interestingly, the HOMA-IR at the last observation was significantly higher in those in the group with high body-weight variability than in their counterparts [2.6 (SD 2.7) vs 2.4 (SD 1.7), P = 0.022]. Furthermore, the ASV of body weight was positively correlated with HOMA-IR at the last observation (r = 0.040, P = 0.037).
Discussion
In the current study, we demonstrated that high body-weight variability was associated with higher mortality in a community-dwelling population. This association remained substantial after adjusting for traditional cardiovascular risk factors, mean body weight, and body-weight change. However, high body-weight variability showed protective effect on incident diabetes mellitus in obese subjects in contrast to negative effect in subjects whose BMI was <25 kg/m2. Therefore, body-weight fluctuation would be a useful assessment tool to predict future health-related outcomes such as diabetes mellitus and mortality.
Various cohort studies showed a dose–response relationship between BMI and health-related outcomes, and having a BMI lower than normal was related with higher mortality, the so-called obesity paradox (11, 12). This phenomenon was also observed in Asian populations (22), including Koreans (23). A recent meta-analysis of 230 cohort studies demonstrated that a more U-shaped association between BMI and all-cause mortality was driven by smoking history, presence of preclinical disease, and short duration of follow-up (24). These findings mean that it is important to avoid potential confounding factors when assessing the effect of body-weight parameters per se on health-related outcomes. Accordingly, we analyzed the association between the AVS of body weight and mortality in healthy never smokers and found the highest adjusted HR of those examined (HR, 1.66; 95% CI, 1.24 to 2.23; P = 0.001). Therefore, the current study adds to a previous study performed in patients with coronary artery disease (15): the association between high body-weight variability and increased mortality was observed not only in participants with high cardiovascular risk, but also in healthy participants.
However, we did not show any important association between body-weight variability and cardiovascular event. The previous analysis using the data from the Treating to New Target trial enrolled patients with previous coronary heart disease but we excluded subjects with previous cardiovascular disease. In addition, a greater absolute increase between high- vs low body-weight variability in the risk of cardiovascular events were observed among overweight and obese populations than in normal counterparts in the previous study. Given that subjects in our cohort had relatively lower BMI and cardiovascular risk than the previous study, the effect of body-weight fluctuation on cardiovascular event might be diminished.
Weight regain occurs after weight loss because of homeostatic feedback mechanisms (25). During and after body-weight loss, hunger hormones such as ghrelin are increased; by contrast, satiety hormones such as leptin, peptide YY, and amylin are decreased (26). Furthermore, adipocytes themselves have a tendency to maintain their cell size, and as a result, when the size of adipocytes becomes smaller, the adipocytes tend to store more energy (27). This energy homeostasis causes body weight to fluctuate. Interestingly, during weight loss, fat mass tends to be reduced more than lean mass, but during weight regain, lean mass is not increased as much as fat mass (6, 28). Therefore, body-weight fluctuation induces an “unhealthy” body composition. Although the pathophysiological mechanisms of clinical hazards of body-weight fluctuation are not yet fully clear, alteration of energy expenditure and neuroendocrine signals might have a role (7, 28–30). In the current study, increased insulin resistance was observed in participants with a high ASV of body weight compared with those with a low ASV of body weight, and there was substantial positive correlation between the ASV of body weight and HOMA-IR. Because insulin resistance is a core pathological feature of cardiometabolic disease (31), further studies will be needed to investigate whether body-weight fluctuation induces aggravation of insulin resistance and how this effects body composition.
Among obesity-related comorbidities, incident diabetes mellitus was positively associated with the ASV of body weight in the subgroup whose baseline BMI was <25 kg/m2, but negatively associated in subjects with BMI ≥25 kg/m2. In the subgroup with BMI ≥25 kg/m2, body-weight change was negatively correlated with body-weight ASV (r = −0.161, P < 0.001). Therefore, a greater reduction in body weight was observed with higher body-weight fluctuation in this obese subgroup. In contrast, there was a positive correlation between the ASV of body weight and body-weight change (r = 0.068, P = 0.005) in subjects with BMI <25 kg/m2. Accordingly, in this subgroup, high ASV of body weight was likely to be related to weight gain. Therefore, the presence of obesity and magnitude of body-weight changes must be considered when evaluating the effect of body-weight fluctuation on diabetes mellitus. Because weight reduction is considered to be a main contributor to the prevention of diabetes mellitus (32, 33), subjects with BMI ≥25 kg/m2 have a benefit to losing their body weight in terms of diabetes mellitus prevention, even though body weight could fluctuate during weight loss. However, because this is an observational cohort study and not an interventional study, we do not know whether the body-weight change was intended or unintended.
Our study has several limitations. First, data on cardiovascular events were collected by questionnaire, which does not detect subclinical disease. Second, we did not include physical activity and nutritional data. In the same context, we did not know whether weight loss was intended, and therefore weight cycling might be a phenomenon of chronic disease rather than a cause. Third, body compositional change was not assessed in this population, and so the ability of body-weight measurement to assess adiposity was limited.
In conclusion, after taking into account traditional cardiometabolic risk factors, higher body-weight fluctuation is likely to be independently associated with a higher mortality in a community-dwelling population. This phenomenon was observed universally across sex, obesity, and smoking status. The current study added findings in a Korean population to previous reports dominated by Caucasian data. However, the effect of body-weight fluctuation on incident diabetes mellitus was positive in obese individuals and negative in their lean counterparts.
Abbreviations:
- ASV
average successive variability
- BMI
body mass index
- Bwtn
body weight at each follow-up
- HDL
high-density lipoprotein
- HOMA-IR
homeostatic assessment of insulin resistance
- hsCRP
high-sensitivity C-reactive protein
- LDL
low-density lipoprotein
Acknowledgments
The authors thank the Division of Statistics in Medical Research Collaborating Center at Seoul National University Bundang Hospital for statistical analyses.
Financial Support: This work was supported by the Research Program funded by the Korea Centers for Disease Control and Prevention (grants 2001-347-6111-221, 2002-347-6111-221, 2003-347-6111-221, 2004-E71001-00, 2005-E71001-00, 2006-E71006-00, 2007-E71003-00, 2008-E71005-00, 2009-E71007-00, 2010-E71004-00, 2011-E71008-00, 2012-E71008-00, 2013-E71007-00, 2014-E71005-00, 2015-P71002-00, and 2016-E71002-00) (to N.H.C.).
Author Contributions: T.J.O., N.H.C., and H.C.J. designed the study and wrote the report. T.J.O. conducted the data analysis and prepared the figures and tables. T.J.O., K.S.P., N.H.C., and H.C.J. interpreted data and critically reviewed the report. T.J.O., J.H.M., S.H.C., S.L., K.S.P., N.H.C., and H.C.J. reviewed the report.
Disclosure Summary: The authors have nothing to disclose.
