


Abstract
Uterine leiomyoma (fibroids) are the most common tumors in women. Recently, perilipin-2 (PLIN2) was identified as a critical target gene of the progesterone receptor; however, its function in the pathogenesis of fibroids is unknown.
To determine the function of PLIN2 in leiomyoma cells.
Tissue and primary cells from leiomyoma and myometrium were analyzed. PLIN2 function in leiomyoma was assessed using small interfering RNA. RNA-sequencing was performed to identify genome-wide effects of PLIN2 depletion. Metabolic activity was measured using the Seahorse XF96 analyzer. Real-time quantitative PCR and immunoblotting were also performed.
Laboratory.
Forty-one premenopausal women undergoing surgery for fibroids.
Gene expression, oxygen consumption rate (OCR), extracellular acidification rate (ECAR), and cell proliferation.
PLIN2 gene expression was 2.4-fold lower in leiomyoma compared with adjacent myometrium, suggesting a link between PLIN2 deficiency and fibroids. A total of 3877 genes were differentially expressed after PLIN2 knockdown. Gene ontology analysis identified metabolism as the second-highest biological process affected by PLIN2 depletion. OCR (mitochondrial respiration) and ECAR (glycolysis) were significantly upregulated after PLIN2 knockdown; PLIN2-depleted cells had a greater basal metabolic activity and higher metabolic stress response. Cell proliferation was also significantly increased after PLIN2 knockdown.
PLIN2 depletion increases mitochondrial respiration and glycolysis, suggesting that PLIN2 is a critical regulator of metabolic function in leiomyoma cells. PLIN2 deficiency also reprograms leiomyoma cells to a proproliferative phenotype. These findings introduce metabolomics as an area to explore to better understand leiomyoma tumorigenesis.
Uterine leiomyoma (fibroids) are the most common tumors found in women. By the age of 50, 70% of women will have at least one fibroid (1). Although benign in origin, the burden of disease often leads to substantial morbidity (heavy menstrual bleeding, anemia, pelvic pressure, and urinary symptoms) (2–5). It is estimated that up to $34.4 billion is spent annually caring for women with fibroids (6). Despite their high prevalence and associated healthcare costs, there are no long-term, nonsurgical treatment options available for women with fibroids. Moreover, the mechanism underlying the pathogenesis of fibroids remains unclear, which has impeded discovery of new treatment options.
It has been shown that progesterone and its receptor (PR) regulate multiple genes implicated in the pathogenesis of fibroids (7, 8). Progesterone has been shown to cause fibroids to grow, whereas selective PR modulators (SPRMs), such as RU486 and ulipristal acetate (UPA), have been shown to reduce their size (2, 9). Despite their effectiveness, little is known about the exact mechanisms through which SPRMs exert their therapeutic effect. Recently, PR chromatin immunoprecipitation, followed by sequencing, and gene-expression profiling by microarray identified perilipin-2 (PLIN2) as a PR target gene in leiomyoma and breast cancer cells treated with RU486 (10). RU486 treatment induced PLIN2 expression via the same DNA regulatory region in both cell types, suggesting that PLIN2 may mediate the therapeutic effects of RU486 (10).
PLIN2, also known as adipose differentiation-related protein, is a lipid droplet-binding protein found on the surface of lipid droplets in most mammalian cell types. It has been found to play an important role in helping to form and stabilize lipid droplets (11), which are known to play a critical role in providing substrates for energy metabolism (11–14). Moreover, alterations in lipid metabolism are a key feature of sustained cellular proliferation in tumor biology (15). Loss of PLIN2 has been linked to cell transformation in liver cirrhosis (16). Until now, the function of PLIN2 in leiomyoma cells has not been characterized. Based on the significance of lipid droplets in cell metabolism and proliferation, we hypothesize that PLIN2 plays an important role in altering the metabolic profile of leiomyoma cells to promote tumorigenesis. In this study, we examine the expression of PLIN2 and its function in uterine leiomyoma cells.
Materials and Methods
Tissue acquisition and cell culture
Human leiomyoma and matched myometrial tissues were obtained from 41 premenopausal women (age 43 ± 5) undergoing uterine surgery for symptomatic fibroids at Northwestern Memorial Hospital (Chicago, IL). Fibroid tumors ranged from 3 to 19.5 cm in size. All tissues were collected under a protocol approved by the Northwestern University Institutional Review Board. Women who received hormone therapy 6 months before surgery were excluded. Tissues were dissociated and/or cultured as previously described (17). In brief, cells were cultured in six-well or 100 mm cell-culture plates (Midwest Scientific, Valley Park, MO) with DMEM/F12 (Thermo Fisher Scientific, Waltham, MA) containing 10% fetal bovine serum (FBS) and 1% antibiotic and antimycotic (growth medium) in a humidified atmosphere with 5% CO2 at 37°C. All cell-culture experiments were run on unpassaged cells (passage zero) or cells passaged only one time.
RNA preparation and real-time quantitative PCR
Total RNA was extracted from tissue using the RNeasy Fibrous Tissue Mini Kit (no. 74704; Qiagen, Hilden, Germany) or from cultured cells using the RNeasy Mini Kit (no. 74104; Qiagen). cDNA was prepared from total RNA using the qScript cDNA SuperMix (Quanta Biosciences, Beverly, MA). mRNA levels of PLIN2 and cyclin-dependent kinase inhibitor 1A (CDKN1A) were quantified using real-time quantitative PCR (RT qPCR) with the SYBR Green or TaqMan 2× Universal Master Mix (Applied Biosystems, Foster City, CA) and normalized to glyceraldehyde-3-phosphate dehydrogenase (GAPDH) expression. TaqMan-based qPCR primers were used for CDKN1A (Hs00355781_m1; Thermo Fisher Scientific). Sequences for SYBR Green-based qPCR primers were the following: GAPDH forward 5′-GAAGGTGAAGGTCGGAGTC-3′; reverse 5′-GAAGATGGTGATGGGATTTC-3′; PLIN2 forward 5′-AGTATCCCTACCTGAAGTCTGTG-3′; reverse 5′-CCCCTTACAGGCATAGGTATTG-3′. The cycling conditions for qPCR were set as follows: 50°C for 2 minutes and 95°C for 10 minutes, followed by 40 cycles of 95°C for 15 seconds and 60°C for 1 minute. The no-template control was run to monitor contamination and primer-dimer formation. Fold change was calculated by first subtracting the average cycle threshold value for GAPDH from the cycle threshold value of the target gene and then raising this value to the power of 2.
UPA treatment
Passage zero leiomyoma cells were cultured in growth medium in six-well cell-culture plates. Once cells reached full confluency, cells were starved overnight with phenol red-free DMEM/F12 containing 1% charcoal-stripped (CS) FBS and 1% antibiotic and antimycotic (starvation medium). Cells were then treated for 24 hours with varying concentrations of UPA (10−9 to 10−5 M, no. S3081; Selleck Chemicals, Houston, TX) or vehicle (dimethyl sulfoxide) suspended in starvation medium. RNA was extracted, and PLIN2 expression was quantified by qPCR.
Gene silencing–small interfering RNA transfection
Gene silencing was carried out using both forward and reverse transfection. Forward transfection was performed once cells were 60% to 70% confluent. Leiomyoma cells were transfected with PLIN2 small interfering RNA (siRNA; 100 nM, no. 4392422; Ambion, Foster City, CA) or nontargeting siRNA (100 nM, no. 4390844; Ambion). siRNAs were resuspended in Opti-MEM reduced serum media (Thermo Fisher Scientific) and then complexed with Opti-MEM reduced serum media containing Lipofectamine RNAiMAX (Thermo Fisher Scientific) for 15 minutes before being added to their respective plate of leiomyoma cells. After a 5-hour incubation period, cells were supplemented with equal volumes of phenol red-free DMEM/F12 containing 20% CS-FBS. Cells were then starved 24 hours after transfection with starvation medium. After 72 hours, cells were either lysed using buffer RLT containing 1:100 β-mercaptoethanol (no. M3148; Sigma-Aldrich, St. Louis, MO) in preparation for RNA extraction for RNA-sequencing (RNA-seq) and RT qPCR or harvested with PBS containing a 1:100 protease inhibitor (no. P8340; Sigma-Aldrich) in preparation for protein extraction for immunoblot.
Reverse transfection was performed for all experiments using the Seahorse XF96 Analyzer (Agilent Technologies, Santa Clara, CA). Leiomyoma cells were trypsinized and then suspended in phenol red-free DMEM/F12 containing 10% CS-FBS. PLIN2 siRNA (100 nM) or nontargeting control siRNA (100 nM) was resuspended in Opti-MEM reduced serum media and then complexed with Lipofectamine RNAiMAX, as described above. After 15 minutes, the cell suspension was added to its respective PLIN2 or nontargeting siRNA-Lipofectamine complex. The leiomyoma cell suspension–siRNA-Lipofectamine complex (100 µL; 50,000 to 100,000 total cells) was then added to each 96-well plate. After 24 hours, cells were washed with PBS and then starved with starvation medium. Extracellular flux was measured using the Seahorse XF96 Analyzer, 72 hours after transfection.
RNA-seq
Total RNA was isolated using the RNeasy Mini Kit, 72 hours after transfection of leiomyoma cells, as described above. All samples were pretreated with RNase-Free DNase (Qiagen). RNA quality was assessed using the Agilent Bioanalyzer 2100. Construction of the RNA-seq library was completed per the manufacturer’s instructions using the Stranded RNA-seq Kit with RiboErase (no. KK8483; KAPA Biosystems, Wilmington, MA). The RNA library concentrations were measured by Qubit (Thermo Fisher Scientific) and library quality determined using the Agilent Bioanalyzer 2100. cDNA libraries were sequenced as single-end, 75 base-length reads on a NextSeq 500 instrument (Illumina, San Diego, CA), with an average read count of 27 million reads per sample. The quality of DNA reads, in FASTQ format, was evaluated using FastQC (Babraham Bioinformatics, Cambridge, UK). Adapters were trimmed, and reads of poor quality or aligning to rRNA sequences were filtered. The cleaned reads were aligned to the Homo sapiens Genome (hg19) using STAR (18). Read counts for each gene were calculated using htseq-count (19) in conjunction with a gene annotation file for hg19 obtained from the University of California Santa Cruz (http://genome.ucsc.edu). The Gene Expression Omnibus accession number for the sequencing data reported in this paper is GSE128898.
Metabolic profiling
Metabolic profiling was performed using the Seahorse XF96 Analyzer and XF Cell Energy Phenotype Test Kit (no. 103325-100; Agilent Technologies), 72 hours after transfection of leiomyoma cells, as described above. The analyzer creates a transient microchamber, 200 µm above the monolayer of plated leiomyoma cells, which allows for simultaneous measurements of the oxygen consumption rate (OCR; a measure of mitochondrial respiration) and the extracellular acidification rate (ECAR; a measure of glycolysis). Before bioenergetic measurements were taken, the culture medium was changed to a phenol red-free Seahorse XF base medium (Agilent Technologies) containing glucose (17.5 mM), pyruvate (0.5 mM), and glutamine (2.5 mM). The pH was adjusted to 7.4 using 1 N NaOH. Cells were allowed to equilibrate in the new medium for 1 hour before the analyzer was run. The analyzer was subsequently run to determine the preferred energy pathways of the treated leiomyoma cells during the basal and stressed state. Cellular response in the stressed state also quantifies if metabolic switching occurs during periods of increased bioenergetic demand. The basal OCR and ECAR were measured for three cycles. Approximately 20 minutes after the first basal measurement, oligomycin (1.0 μM) and carbonyl cyanide p-(trifluoromethoxy)-phenyl-hydrazone (FCCP; 1.0 μM) were simultaneously injected to induce the stress response, and OCR and ECAR were measured over five cycles. Oligomycin inhibits ATP production by blocking ATP synthase, which causes a compensatory increase in the rate of glycolysis. FCCP dissipates the proton gradient and drives OCRs higher as the mitochondria attempt to restore its membrane potential.
Once metabolic profiling was complete, a bicinchoninic acid assay (Thermo Fisher Scientific) was run to quantify protein concentrations following the manufacturer’s protocol. All metabolic data were normalized to protein concentration.
Immunoblotting
Cell lysates were prepared and analyzed by immunoblotting, as previously described (17). Monoclonal antibodies used included anti-proliferating cell nuclear antigen (PCNA; no. 2586S; Cell Signaling Technology, Danvers, MA) and anti-β-actin (no. HRP-60008; Proteintech, Chicago, IL) as a loading control. Luminata Crescendo horseradish peroxidase substrate (Millipore, Billerica, MA) was used for chemiluminescent detection. Proteins were quantified using ImageJ software (version 1.45; National Institutes of Health, Bethesda, MD). PCNA protein levels were normalized against β-actin.
Statistical analysis
To allow comparisons between samples, PLIN2 mRNA levels were normalized to one in leiomyoma tissue. Myometrial fold change was then calculated relative to leiomyoma. The sign test was used to determine differential PLIN2 expression between leiomyoma and myometrial tissue. Student’s t-test or repeated-measures ANOVA was used to compare means between groups. Differential gene expression of RNA-seq data was determined using edgeR (http://www.bioconductor.org/) (20, 21). The cutoff for the determination of significant differentially expressed genes was a false discovery rate-adjusted P value <0.05. For analysis of the metabolic data, the stress effect was assessed by the calculation of either the absolute change between basal and stress values or the percent change between basal and stress values. Absolute change was analyzed with the use of a random-effects model with gene (PLIN2 siRNA, control siRNA) and time (basal: times <20 minutes, stress: times >20 minutes) as fixed effects; tissues from different patients and replicate cell-culture wells were random effects. The significance of the gene by time interaction in this model indicated whether the stress effect, as measured by absolute change, differed between PLIN2 siRNA- and control siRNA-transfected cells. Percent change was calculated by averaging the basal values for each well and then calculating the percent change from this basal average of each stress level time point. Likewise, these percent changes were also analyzed using a random effects model. The significance of the gene effect in this model indicated whether the stress effect, as measured by percent change, differed between PLIN2 siRNA- and control siRNA-transfected cells. Post hoc tests were adjusted for multiple comparisons. Data are reported as mean and SE. Statistical significance was indicated when P < 0.05. All figures were created using GraphPad Prism (version 7.02; GraphPad Software, Inc., La Jolla, CA).
Results
PLIN2 expression is lower in leiomyoma compared with matched myometrium
Fibroids are believed to originate from a myometrial stem cell population transformed into pathogenic leiomyoma cells (2). Thus, myometrial cells represent the normal “non-disease” state, whereas leiomyoma cells represent the abnormal “disease” state. With this in mind, we sought to determine if PLIN2 gene expression is differentially expressed in leiomyoma compared with adjacent myometrium. Fresh, frozen myometrial and matched leiomyoma tissues were analyzed from 24 premenopausal women. RT qPCR showed that PLIN2 expression was 2.4-fold lower in leiomyoma compared with adjacent myometrium (P = 0.007; Fig. 1), suggesting a pathologic role for PLIN2 deficiency in leiomyoma. Pearson correlation analysis did not detect a significant correlation between the tumor size and PLIN2 mRNA levels. We then treated leiomyoma cells with varying concentrations of UPA for 24 hours. Fig. 2 shows that UPA treatment induced PLIN2 expression in a dose-dependent manner, consistent with our previous report that RU486 (a SPRM) stimulated PLIN2 expression in leiomyoma cells (10). These findings suggested that PLIN2 expression is dysregulated in leiomyoma vs normal myometrial tissue. In the following studies, we explored the functional role of PLIN2 in leiomyoma cells.
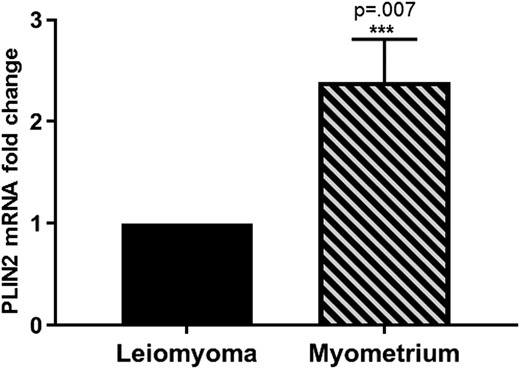
Relative PLIN2 mRNA levels in human leiomyoma tissue and matched adjacent myometrium. A total of 48 samples from 24 women were analyzed. To standardize comparisons between samples, PLIN2 expression in leiomyoma tissue was normalized to one. PLIN2 expression was 2.4-fold lower in leiomyoma compared with matched myometrium tissue (2.4 ± 0.51, mean ± SEM; ***P = 0.007 comparing myometrium with leiomyoma).
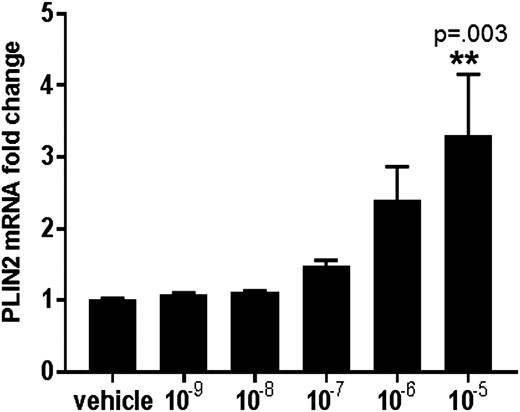
Effect of UPA treatment on the expression of PLIN2 in leiomyoma cells. Serum-starved leiomyoma cells were treated with varying concentrations of UPA (ranging from 10−9 to 10−5 M) or vehicle for 24 h. PLIN2 mRNA levels were normalized to GAPDH. Results are reported as fold change compared with vehicle and represent the mean ± SEM of experiments performed in five independent patient samples (**P = 0.003 compared with vehicle; 10−9 vs 10−5: P = 0.004; 10−8 vs 10−5: P = 0.004; 10−7 vs 10−5: P = 0.02; 10−6 vs 10−5: P = 0.5).
PLIN2 knockdown alters the genome-wide gene-transcription profile of leiomyoma cells
PLIN2 expression was knocked down in leiomyoma cells from four women using siRNA. RNA-seq was then performed to identify genome-wide differentially expressed genes. The overall PLIN2 knockdown efficiency was ∼85% (Fig. 3). A total of 3877 genes were found to be differentially expressed, with 2557 genes found to be upregulated and 1320 genes found to be downregulated. Gene ontology analysis (Database for Annotation, Visualization and Integrated Discover; https://david.ncifcrf.gov) identified cellular component organization/biogenesis (P = 1.4E-27) and metabolic processes (P = 1.6E-10) as the top two biological processes of genes upregulated by PLIN2 depletion (Table 1). Kyoto Encyclopedia of Genes and Genomes (and Database for Annotation, Visualization and Integrated Discovery) pathway analysis identified enrichment of genes involved in the cell cycle, pyruvate metabolism, fatty acid metabolism and degradation, purine and pyrimidine metabolism, apoptosis, and extracellular matrix (ECM) component organization after PLIN2 depletion (Table 2). Gene ontology analysis of downregulated genes showed reciprocal alterations in pathways involving cellular component organization/biogenesis, biological adhesion, and growth (data not shown). Taken together, these findings provide support for a role of PLIN2 depletion in the activation of metabolic activity within leiomyoma cells.
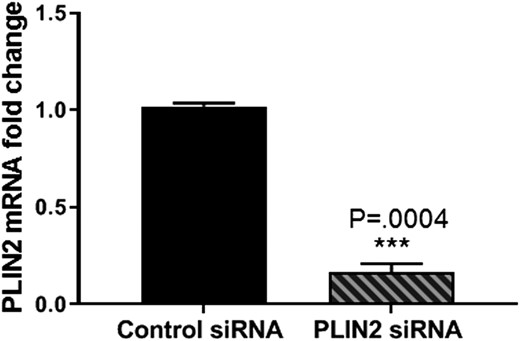
PLIN2 knockdown significantly decreases its expression in leiomyoma cells. Leiomyoma cells were transfected with control siRNA or PLIN2 siRNA for 72 h. PLIN2 mRNA expression was detected using RT qPCR, which was downregulated ∼0.17-fold (0.166 ± 0.04). Results are reported as fold change compared with control siRNA. The mean ± SEM for four patient samples is reported. ***P = 0.0004.
Gene Ontology Analysis of Upregulated Processes After PLIN2 Knockdown
| Rank Position | Process | FDR-Adjusted P Value |
|---|---|---|
| 1 | Cellular component organization or biogenesis | 1.4E-27 |
| 2 | Metabolic process | 1.6E-10 |
| 3 | Cellular process | 1.0E-6 |
| 4 | Reproductive process | 2.6E-4 |
| 5 | Reproduction | 2.3E-4 |
| Rank Position | Process | FDR-Adjusted P Value |
|---|---|---|
| 1 | Cellular component organization or biogenesis | 1.4E-27 |
| 2 | Metabolic process | 1.6E-10 |
| 3 | Cellular process | 1.0E-6 |
| 4 | Reproductive process | 2.6E-4 |
| 5 | Reproduction | 2.3E-4 |
Abbreviation: FDR, false discovery rate.
KEGG Pathway Analysis of Upregulated Genes After PLIN2 Knockdown
| Rank Position | KEGG Pathway | Differentially Expressed Genes |
|---|---|---|
| 1 | Cell cycle | CCNA1, CCNA2, CCNB1, CCNB2, CDC20, CDK1, CDK2, E2F2, PCNA, TP53 |
| 4 | DNA replication | LIG1, PCNA, POLA1, POLE, FEN1, MCM2/3/5/6/7, PRIM1, RPA1/2/3, RNASEH2A/2B |
| 17 | Pyruvate metabolism | ACAT1, ACACB, ACSS1, LDHA, ME1, ME2, ME3, PC, PKM |
| 19 | Fatty acid metabolism | ACAT1, ACADM, ACADSB, ACSBG1, ACSL1, ACSL3 |
| 23 | Fatty acid degradation | ACAT1, ACADM, ACADSB, ACSBG1, ACSL1, ACSL3, EHHADH, HADH |
| 24 | Apoptosis | AKT3, BAX, BCL2L1, CASP6, CASP7, NFKB1, TP53 |
| 27 | Purine metabolism | NT5C, NT5M, ATIC, ADCY3, AK3, ADSL, ADSS, GMPS, IMPDH1, PDE1A |
| 28 | Pyrimidine metabolism | NT5C, NT5M, CMPK1, CMPK2, DUT, TXNRD1, TK1, TYMP |
| 29 | ECM receptor interaction | COL3A1, COL4A3, COL4A4, COL4A5, COL4A6, COL11A1, COL24A1 |
Abbreviation: KEGG, Kyoto Encyclopedia of Genes and Genomes.
PLIN2 knockdown increases metabolic activity of leiomyoma cells
To further explore the relationship between PLIN2 depletion and metabolism, we used the Seahorse XF96 Analyzer to measure real-time changes in mitochondrial respiration and glycolysis under both basal and stressed conditions after PLIN2 siRNA transfection. Basal activity represents the amount of energy needed to maintain cellular homeostasis. The difference between the basal and stress response reflects the cells’ ability to meet increased energy demand. Under basal conditions, PLIN2 depletion was associated with increased OCR (a measure of mitochondrial respiration; Fig. 4A and 4C; n = 5, P < 0.0001), demonstrating that PLIN2-depleted leiomyoma cells are more metabolically active than control cells. After cells were stressed with oligomycin and FCCP, PLIN2-depleted cells had a significantly higher OCR compared with the stressed control group (Fig. 4A and 4C; n = 5, P < 0.0001).
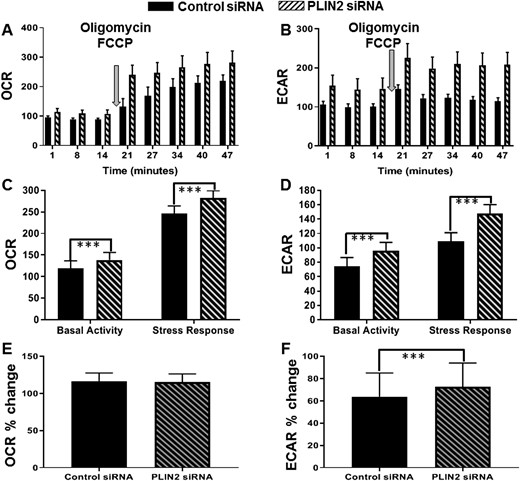
Metabolic activity of leiomyoma cells after PLIN2 knockdown. Leiomyoma cells were transfected with control siRNA or PLIN2 siRNA for 72 h. Metabolic activity was determined by the measurement of extracellular flux using the Seahorse XF 96 Analyzer. The OCR reflects mitochondrial respiration, whereas the ECAR reflects glycolysis. Basal activity represents metabolic activity under basal conditions. Stress response represents metabolic activity after injection of FCCP and oligomycin. (A and B) Representative kinetics of increased (A) OCR and (B) ECAR over time in control or PLIN2-depleted cells. (C and D) Quantification of data from five patient samples demonstrates that PLIN2 depletion is associated with increased (C) mitochondrial respiration (mean ± SEM, ***P < 0.0001) and (D) glycolysis (mean ± SEM, ***P < 0.0001) under both basal and stressed conditions. (E and F) Percent change in OCR and ECAR transitioning from the basal state to the stress state. PLIN2 depletion causes leiomyoma cells to rely more heavily on (F) glycolysis (73 ± 21.3% vs 64 ± 21.3%, n = 5, ***P < 0.0001) over (E) mitochondrial respiration (115% vs 117%, n = 5, P = 0.63) to meet increased energy demand.
Next, the rate of glycolysis (ECAR) was assessed in both groups. Under basal conditions, PLIN2 depletion was associated with a significantly higher ECAR compared with the control group (Fig. 4B and 4D; n = 5, P < 0.0001). Likewise, after oligomycin and FCCP injection, PLIN2-depleted cells had a significantly higher ECAR than stressed control cells (Fig. 4B and 4D; n = 5, P < 0.0001). Additionally, the percent change in ECAR, as cells transitioned from the basal state to the stress state, was significantly higher in the PLIN2-depleted cells compared with the control cells (Fig. 4F; n = 5, P < 0.0001); this same change was not observed for OCR (Fig. 4E), suggesting that PLIN2 depletion caused leiomyoma cells to rely more heavily on glycolysis to meet the increased energy demand. Altogether, these data suggest that PLIN2 depletion within leiomyoma cells leads to increased metabolic activity and especially increases glycolytic activity.
PLIN2 depletion increases cell proliferation
Increased cell proliferation is a key feature of tumorigenesis. To test whether PLIN2 depletion affects cell proliferation, protein levels of PCNA (a cell-proliferation marker) were analyzed by immunoblot. PLIN2-depleted cells expressed 4.8-fold higher PCNA protein than control cells (Fig. 5A and 5B; n = 3, P < 0.05). In addition, we found through RT qPCR that CDKN1A, a CDK inhibitor that directly controls the quiescent-proliferation bifurcation in cell fate (22), was significantly downregulated after PLIN2 depletion (Fig. 5C; n = 5, P < 0.05). These data suggest that PLIN2 depletion increases cellular proliferation.
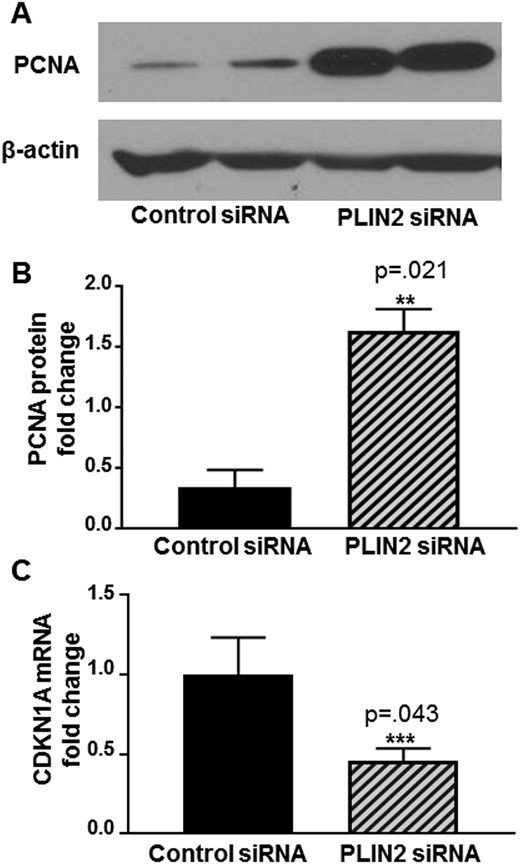
Effects of siRNA knockdown of PLIN2 on leiomyoma cell proliferation. Cell proliferation was determined by the measurement of PCNA protein levels using immunoblot. Blots were reprobed with a β-actin antibody as a loading control. (A) Representative immunoblot showing PLIN2 depletion led to increased PCNA protein expression. (B) Quantification of immunoblots from three independent patient samples demonstrating a 4.8-fold increase in PCNA protein levels (**P = 0.021; 1.63 ± 0.08 vs 0.34 ± 0.06, means ± SEM). (C) Leiomyoma cells were transfected with control siRNA or PLIN2 siRNA for 72 h. RT qPCR assay demonstrated a 0.46-fold decrease in CDKN1A mRNA levels in PLIN2-depleted vs control cells (***P = 0.043; 0.46 ± 0.08 vs 1.0 ± 0.23, mean ± SEM).
Discussion
Our data show that PLIN2 expression is 2.4-fold lower in leiomyoma compared with myometrium. Treatment of leiomyoma cells with UPA induced PLIN2 expression in a dose-dependent manner, further supporting the significance of PLIN2 as a PR target gene (10). In addition, genome-wide transcriptome profiling showed that PLIN2 depletion was associated with increased expression of genes vital for metabolism. Finally, we demonstrated that PLIN2 depletion is associated with a substantial increase in leiomyoma metabolic activity and cell proliferation.
Lipid droplets play an important role in providing energy precursors, such as free fatty acids, that can be used for beta-oxidation and the tricarboxylic acid cycle (11–13). An abundance of PLIN2 at the cell lipid-droplet surface attenuates lipolysis by blocking the ability of lipases to access lipid droplets physically, thus decreasing the availability of energy precursors (11). Conversely, decreased PLIN2 would allow for lipolysis to occur and increase the availability of energy precursors to support cell metabolism (11). Consistent with these findings, we demonstrated that knockdown of PLIN2 upregulated genes enriched in metabolic processes, such as the fatty acid metabolism. Whereas we describe the role of PLIN2 in leiomyoma cells, others have shown that loss of PLIN2 in liver cirrhosis is associated with the transformation of quiescent hepatic stellate cells to fibrogenic ECM producing myofibroblasts (16, 23). Furthermore, autophagy and its metabolic implications appear to be key mediators of this transformation (24–26). Our RNA-seq data also revealed that knockdown of PLIN2 increased the expression of several ECM genes, such as Col3A1 and Col4A3 (Table 2), further supporting the important role of PLIN2 in controlling fibrosis.
A key component of both benign and malignant tumor biology is growth that is dependent on aberrant cellular proliferation, which by necessity, requires increased metabolic capacity (27). ATP is efficiently generated through mitochondrial respiration to support biological processes, such as cell proliferation. Our data show that PLIN2 depletion results in both increased mitochondrial respiration and glycolysis within leiomyoma cells. In addition, our data show that PLIN2 depletion resulted in leiomyoma cells relying more significantly on glycolysis to meet their increased metabolic demand. This increased reliance on glycolysis is a known hallmark of cancer biology and has also been shown to play an important role in benign tumors (27, 28).
In both normal fibroblasts and lymphocytes, glycolysis has been shown to be essential in supporting cell proliferation (28) by increasing DNA synthesis and the biomass intermediates (amino acids, nucleotides, and lipids) that are needed to sustain rapid cell growth (29). We found that PLIN2 knockdown not only significantly increased basal and stress-induced OCR (mitochondrial respiration) and ECAR (glycolysis) but also markedly induced leiomyoma cell proliferation. Taken together, our data suggest that PLIN2 functions as a key regulator of tumorigenesis, with low expression levels altering metabolic activity within leiomyoma cells to a proproliferative phenotype. Interestingly, recent data have shown that treatment of leiomyoma cells with strawberry extracts decreases ECAR and inhibits ECM gene expression (30, 31), further supporting a role for changes in metabolism in leiomyoma pathogenesis. Our data suggest that the induction of PLIN2 by UPA may halt proliferation by modifying the cellular metabolism. In other organ systems, data show that both increases and decreases in PLIN2 expression are linked to tumorigenesis. For example, high PLIN2 expression has been shown to be associated with greater cancer-free survival among patients with clear cell renal cell carcinoma; moreover, PLIN2 knockdown has been shown to promote proliferation, invasion, and migration of renal cancer cells (32–34). In contrast, the silencing of PLIN2 has been shown to inhibit human colon cancer HT-29 cell proliferation (35). Islam et al. (36) recently analyzed the fatty acid profile of leiomyoma vs myometrial tissue and found that treatment with omega-3 fatty acids remodeled the cell membrane structure and regulated transcriptional activity of genes involved in mechanical signaling and cellular lipid accumulation. Notably, they also demonstrated that omega-3 fatty acid treatment significantly reduced the expression level of the CYP11A1 gene in myometrial cells but not in leiomyoma cells. CYP11A1 encodes the mitochondrial enzyme that catalyzes the conversion of cholesterol to pregnenolone. This is important, because pregnenolone is the precursor steroid hormone of estrogen and progesterone, which are essential for leiomyoma growth (8). Given the importance of lipid metabolism in cell biology, we believe that the function of PLIN2 in tumor biology warrants further investigation.
Recently, Heinonen et al. (37) identified genome-wide metabolic dysregulation in leiomyoma tissue vs normal myometrial tissue. Progesterone, in particular, has been shown to have important effects on carbohydrate, lipid, and protein metabolism (38). However, to our knowledge, the role that progesterone plays in altering the metabolic profile of uterine leiomyoma has not previously been explored. Our data establish PLIN2 as a potential link among progesterone/PR signaling, metabolism, fibrosis, and proliferation in leiomyoma cells.
Strengths of our study include the use of primary human tissue, our unbiased, genome-wide approach using RNA-seq to determine the effect of PLIN2 depletion, our sample size, and the use of the Seahorse XF96 Analyzer to measure real-time changes in metabolic activity, followed by correlation with function. Whereas our study describes the role of metabolism in the pathogenesis of fibroids, we acknowledge that our in vitro findings will need to be further studied in an in vivo model. Future directions include validation of our findings within a xenograft animal model and exploration of signaling pathways regulated by PLIN2.
Conclusion
We showed that the silencing of PLIN2 in leiomyoma cells increases cellular parameters of mitochondrial respiration and glycolysis, providing direct evidence that PLIN2 is a regulator of metabolic function in leiomyoma cells. We also showed that leiomyoma cells express lower levels of PLIN2 than adjacent, healthy myometrium and that treatment of leiomyoma with SPRMs increases PLIN2 gene expression. Together, these data provide support for a link between progesterone/PR signaling via its target gene PLIN2 and metabolism in leiomyoma cells. The limited therapeutic options in fibroid treatment highlight the need for identification of alternative pathways to target when treating fibroids. Our data not only support metabolomics as an area to explore to understand leiomyoma tumorigenesis better but also highlight metabolic pathways as a potential therapeutic target.
Acknowledgments
We thank Dr. Navdeep Chandel and his entire laboratory at Northwestern University for allowing us to use their Seahorse XF 96 Analyzer to conduct all metabolic experiments. Research reported in this manuscript was made possible, in part, by the services of the NUSeq Core Facility, which is supported by the Northwestern University Center for Genetic Medicine, Feinberg School of Medicine, and Shared and Core Facilities of the University’s Office for Research.
Financial Support: This study was supported by the Eunice Kennedy Shriver National Institute of Child Health and Human Development Grant P01-HD057877 (to S.B.).
Additional Information
Disclosure Summary: The authors have nothing to disclose.
Data Availability: All data generated or analyzed during this study are included in this published article or in the data repositories listed in References.
Abbreviations:
- CS
charcoal stripped
- ECAR
extracellular acidification rate
- ECM
extracellular matrix
- FBS
fetal bovine serum
- FCCP
carbonyl cyanide p-(trifluoromethoxy)-phenylhydrazone
- GAPDH
glyceraldehyde 3-phosphate dehydrogenase
- OCR
oxygen consumption rate
- PCNA
proliferating cell nuclear antigen
- PLIN2
perilipin-2
- PR
progesterone receptor
- qPCR
quantitative PCR
- RNA-seq
RNA-sequencing
- RT qPCR
real-time quantitative PCR
- siRNA
small interfering RNA
- SPRM
selective progesterone receptor modulator
- UPA
ulipristal acetate
