


Abstract
Checkpoint inhibitor–associated autoimmune diabetes mellitus (CIADM) is a rare illness, and little is known about its incidence, clinical features, or pathogenesis.
Consecutive patients from a single quaternary melanoma center who developed new-onset insulin-requiring diabetes after commencing anti–programmed cell death-1 (PD-1) immunotherapy were studied to describe CIADM characteristics. Ten (1.9%) of 538 patients with metastatic melanoma treated with anti–PD-1–based immunotherapy from March 2015 to March 2018 developed CIADM. Nine patients had no history of diabetes, and one had pre-existing type 2 diabetes mellitus. Median time from immunotherapy start to CIADM diagnosis was 25 weeks [interquartile range (IQR), 17.5 to 34.5 weeks]. All patients had normal serum C-peptide shortly before CIADM onset and an inappropriately low level when measured soon after. At CIADM diagnosis, median hemoglobin A1c was 7.6% (IQR, 7.15% to 9.75%), median glucose level was 32.5 mmol/L (IQR, 21.6 to 36.7 mmol/L), and median C-peptide concentration was 0.35 nmol/L (IQR, 0.10 to 0.49 mmol/L). Type 1 diabetes (T1D)–associated autoantibodies (DAAs) were present in two patients (both of whom had anti–glutamic acid decarboxylase antibody); all were negative for insulin-associated protein 2, insulin, and ZnT8. Three patients were heterozygous for an HLA class II T1D-risk haplotype; two additional patients also carried protective haplotypes for T1D. All patients continued immunotherapy; eight (80%) had complete or partial oncological response, and all patients required ongoing insulin therapy.
CIADM is characterized by sudden permanent β-cell failure occurring after immunotherapy. It is distinct from T1D, usually lacks DAA or T1D-associated HLA-risk haplotypes, and is associated with difficult glycemic control from the onset. As such, CIADM represents a new model of auto-inflammatory β-cell failure.
Immune checkpoint inhibitors (ICIs) improve survival of patients with advanced cancers, including melanoma, non–small cell lung cancer, renal cell carcinoma, bladder cancer, head and neck squamous cell carcinoma, and Hodgkin lymphoma (1). Recently, they have also been shown to improve survival in the adjuvant setting (2–4). ICIs include antibodies against programmed cell death-1 (PD-1) (nivolumab, pembrolizumab) or its ligand (PD-L1), (atezolizumab, durvalumab) or cytotoxic T lymphocyte associated antigen 4 (CTLA-4) (ipilimumab). These drugs activate cytotoxic T cells to restore antitumor immunity; however, normal tissues may also be affected, leading to immune-related adverse events (3) (irAEs). These most commonly affect the skin and gastrointestinal tract (>10% frequency) (5) and less often the endocrine system, liver, and lungs (6). Although most irAEs are treated with dose interruption, corticosteroids, or immunosuppressive drugs and resolve, endocrine irAEs are mostly permanent (7). Diabetes mellitus is a rare endocrine irAE, and little is known about its incidence, clinical features, or pathogenesis. We term this "checkpoint inhibitor–associated autoimmune diabetes mellitus" (CIADM).
Diabetes mellitus can be due to absolute or relative insulin deficiency: The former is usually due to an autoimmune process, type 1 diabetes (T1D), whereas the latter is a progressive insulin secretory defect often associated with insulin resistance, type 2 diabetes. Other rare types of diabetes include those due to genetic defects in β-cell function or insulin action, postpancreatectomy diabetes, or drug-related diabetes, such as that associated with corticosteroids. Anti–PD-1 therapy has been associated with diabetes mellitus (CIADM) in <0.1% to 1% of patients. In a recent meta-analysis looking at endocrine irAEs after immunotherapy in 38 randomized clinical trials of 7689 treated patients (8), no statistical analysis was possible for the development of insulin-deficient diabetes due to the small numbers reported. Only 13 cases were reported overall, giving an incidence of 0.2%, with 6 cases grade 3 or higher (0.1%), 12 of 13 cases observed in PD-1 inhibitors (pembrolizumab and nivolumab) (9), and 1 in ipilimumab (10). The incidence of diabetes in anti–CTLA-4 has not been commonly reported. Few details are offered in these clinical trials on the development of diabetes, although those classified as grade 3 presented with diabetic ketoacidosis necessitating hospitalization.
Several case reports have described the development of new-onset insulin-dependent diabetes mellitus with combination anti–CTLA-4 and anti–PD-1 immunotherapy (11), anti–PD-1 inhibitor monotherapy (12), anti–PD-L1 inhibitor (13), and anti–CTLA-4 inhibitor monotherapy (14). Furthermore, the predictors of CIADM are not well understood, and the relationship between this and traditional predictors of T1D, including autoimmune antibody status and human leukocyte antigen (HLA) molecules, has not been thoroughly studied.
To date, no large published series has examined the onset, progress, and outcome of CIADM, in particular the role of glycemic variability, by using continuous glucose monitoring, a routine method of monitoring T1D. We therefore sought to describe the nature of CIADM, including the onset, natural history, treatment, glycemic variability, and potential immunological and genetic predictive factors, in a series of 538 patients with advanced melanoma treated with ICI.
Methods
Study design
This retrospective cohort study included all patients diagnosed with new-onset insulin-requiring diabetes mellitus following ICI, as a subset of all patients with metastatic melanoma treated with ICI at Melanoma Institute Australia and the Department of Endocrinology, Royal North Shore Hospital, Sydney, Australia, between March 2015 and March 2018. The Human Ethics Review Committees of Melanoma Institute Australia and Royal North Shore Hospital approved the study [Royal Prince Alfred Hospital Research Ethics Committee Protocol No. X10-0305 and HREC/10/RPAH, Northern Sydney Local Health District Human Research Ethics Committee Reference No. LNR/15/HAWKE/84 (RESP/15/58)]. All patients provided written informed consent.
Biochemical Data
Glucose, hemoglobin A1c, insulin, and C-peptide were measured in plasma samples before the first dose of immunotherapy on banked samples obtained prior to diagnosis of CIADM and for up to 35 months after diagnosis of CIADM.
Continuous glucose monitoring
Prospective patients with a confirmed diagnosis of CIADM underwent masked continuous glucose monitoring (CGM) with the iPro®2 Professional CGM system (Medtronic Australasia Pty Ltd, Sydney, Australia) at a median of 3 months after diabetes onset. This was performed once patients were stable on regular doses of insulin in order to better understand the basis of glycemic variability of this condition (i.e., after a short adaptation to insulin, because glycemic variability immediately after diagnosis is often due to insulin titration). The CGM device was worn for up to 6 days, and after confirmation of validity (as per the iPro®2 interpretation guidelines), raw data were exported to the EasyGV analysis program (15) for quantification and characterization of time spent within glucose ranges and glycemic variability. Time in hypoglycemic, euglycemic, and hyperglycemic ranges were determined according to the recommendations from the International Consensus on the Use of Continuous Glucose Monitoring (16). Data from patients with T1D for ≤5 years (n = 10) and T1D for ≥20 years (n = 20) who had CGM done as part of routine clinical practice were included as a comparator group. These groups were selected to exclude patients in the early “honeymoon” phase during which very low insulin levels are required.
Statistical analyses
Differences in biochemical measures before and after onset of diabetes were determined by using the paired t test or Wilcoxon matched-pairs signed-rank test for parametric and nonparametric data, respectively. Glycemic variability and glucose time in range values were compared between patients with CIADM and T1D by one-way ANOVA, Kruskal-Wallis test, or two-way repeated-measures ANOVA, where appropriate. Statistical analysis was performed using SPSS statistical software, IBM version 25.0, (Armonk, NY).
Results
CIADM incidence and patient demographic characteristics
Between March 2015 and March 2018, a total of 538 patients with metastatic melanoma were treated with PD-1 antibodies (pembrolizumab, nivolumab) alone (n = 285), in combination with ipilimumab (n = 214), or in combination with ipilimumab or placebo (n = 39) at Melanoma Institute Australia. The last category represented patients who remain blinded in clinical trials. Ten (1.9%) consecutive patients developed new-onset insulin-requiring diabetes mellitus (Table 1). Of these, 6 received PD-1 monotherapy (2.1% of treated patients) and 4 received PD-1 and ipilimumab combination (1.9%). Patients were reviewed regularly by oncologists, and CIADM was diagnosed on the basis of elevated glucose levels and symptoms of hyperglycemia. The median age was 62 years, most patients were male (n = 9, 90%). Six received anti–PD-1 antibodies as monotherapy, and four received the antibodies in combination with ipilimumab). Nine of the 10 patients had no history of diabetes before presentation; before diagnosis of CIADM, the 10th patient's diabetes was well controlled with oral hypoglycemic agents (biguanide and sodium glucose transporter 2 inhibitor).
Patient Characteristics, CIADM Features, and Associated Toxicity
| Patient | Age (y)a | Sex | Immunotherapy | Best Responseb | Time to CIADM Onset (wk) | DKA | Diagnosis | DAAc | HLA Class II Haplotype | Other IrAE | ||||
|---|---|---|---|---|---|---|---|---|---|---|---|---|---|---|
| Glucose (mmol/L) | C-peptide (0.4–1.5 nmol/L) (nmol/L) | HbA1c (%) (mmol/mol) | DRB1 | DQB1 | DQA1 | |||||||||
| 1 | 59 | M | Ipilimumab and pembrolizumab | CR | 12 | Yes | 36.7 | <0.1f | 6.8 (51) | Negative | 4 | 3:01 | 3 | T, R |
| 8 | 4 | 4 | ||||||||||||
| 2 | 76 | M | Pembrolizumab | PR | 63 | No | 24.5 | 0.615 | 9.4 (79)f | Negative | 3d | 2d | 5d | A |
| 12 | 3:01 | 5 | ||||||||||||
| 3 | 68 | M | Pembrolizumab | CR | 30 | No | 32.5 | 0.15 | 7.6 (60) | Negative | 4d | 3:02d | 3d | HyP |
| 11e | 3:01e | 5e | ||||||||||||
| 4 | 79 | M | Pembrolizumab | CR | 16 | No | 38.9 | 0.42f | 7.5 (59) | Negative | 4d | 3:02d | 3d | EP, H |
| 1 | 5 | 1 | ||||||||||||
| 5 | 61 | M | Ipilimumab and nivolumab | PD | 4 | Yes | 44.2 | 0.051 | 7.7 (61) | Negative | NA | NA | NA | C, EP, R |
| 6 | 64 | M | Ipilimumab and nivolumab | CR | 17 | Yes | >20 | <0.1f | 9.8 (84)f | Negative | NA | NA | NA | EP |
| 7 | 45 | M | Pembrolizumab | CR | 12 | No | 21.6 | 0.485 | 8.4 (68) | Negative | 7:01e | 3:03e | 2:01e | V |
| 9:01 | 2:02 | 2/03/2019 3:01 | ||||||||||||
| 8 | 43 | M | Ipilimumab and nivolumab | PD | 24 | No | 20.6 | 0.5 | 6.7 (50) | Negative | 1:01 | 5:01 | 4/05/2019 1:01 | HyP, T |
| 16:01 | 5:02 | 1:02 | ||||||||||||
| 9 | 78 | F | Pembrolizumab | CR | 63 | No | 20.6 | 0.352 | 11.8 (106) | Positive | 14 | 5 | 1 | H, T |
| 13 | 6 | 1 | ||||||||||||
| 10 | 55 | M | Pembrolizumab | PR | 26 | Yes | 34 | 0.049 | 13.1 (120) | Positive | 3:01e | — | — | H, EP, P |
Abbreviations: A, arthritis; C, colitis; CR, complete response; DKA, diabetic ketoacidosis; EP, exocrine pancreatitis; H, hepatitis; HyP, hypophysitis; NA, not available; P, pancreatitis; PD, progressive disease; PR, partial response; R, rash; T, thyroiditis; V, vitiligo.
Age at diagnosis of diabetes.
Response to immunotherapy.
DAA T1D-associated autoantibodies, including anti-GADA, anti-insulin antibody, islet antigen 2 antibody, and zinc transporter 8 antibody.
HLA haplotypes associated with T1D.
HLA haplotypes associated with protection against T1D.
Result within 3 mo of diagnosis.
Presentation of CIADM
CIADM was diagnosed a median of 25 weeks [interquartile range (IQR), 17.5 to 34.5 weeks] after initiation of ICI therapy (Table 1). Most patients also developed other irAEs, including acute pancreatitis (n = 2, 20%) and pancreatic exocrine failure (n = 3, 30%), as well as thyroiditis (n = 3, 30%), hypophysitis (n = 2, 20%), colitis (n = 1, 10%), hepatitis (n = 3, 30%), and arthritis (n = 1, 10%). One patient had a diagnosis of CIADM concurrent with pancreatitis, and another had concurrent development of CIADM with thyroiditis and hypophysitis.
For the first five patients with CIADM, until the end of 2016, initial presentation was with marked hyperglycemia associated with ketosis (four patients had ketoacidosis) requiring hospitalization. Subsequent patients were diagnosed more promptly and were managed as outpatients. The most recent patient (number 10) rapidly deteriorated because of pancreatitis at diagnosis and presented with diabetic ketoacidosis. At presentation, all patients had glucose levels >20 mmol/L (360 mg/dL) (median, 32.5 mmol/L; IQR, 21.6 to 36.7 mmol/L), with inappropriately low C-peptide (median, 0.35 nmol/L; IQR, 0.10 to 0.49 nmol/L; reference range, 0.4 to 1.5 nmol/L). HbA1c was elevated at diagnosis (median, 7.6%; IQR, 7.15% to 9.75%) and was higher in those who presented with diabetic ketoacidosis, suggesting longer duration or more severe hyperglycemia before diagnosis of CIADM.
C-peptide levels
In six cases of CIADM with historical blood available, C-peptide levels were present soon before diabetes diagnosis (within 60 days) but were undetectable or inappropriately low soon after diagnosis (Fig. 1A). Furthermore, there was a significant decrease in C-peptide following the onset of diabetes [median, 1978 pmol/L (IQR, 1616 to 2577 pmol/L] vs 6 pmol/L (IQR, 3 to 369.5 pmol/L); P = 0.031]. Repeat blood samples obtained several months after diagnosis (range, 1 to 50 months) revealed a persistently low C-peptide level (median, 0.41 nmol/L; IQR, 0.40 to 0.41 nmol/L), suggesting deficient β-cell function as the cause for diabetes. Nonfasting glucagon levels were measured in only three patients at diagnosis, and these were in the normal reference range (median, 97 pg/mL; IQR, 88 to 118.5 pg/mL; reference range, 50 to 150 pg/mL).
![Hormone and glucose levels in CIADM. (A) C-peptide pre- and post-diagnosis of CIADM. C-peptide levels over time in six patients with CIADM (8 mo before to 50 mo post onset). (B) Comparison of time spent in hypoglycemic, euglycemic, and hyperglycemic ranges for patients with T1D and CIADM via CGM. Hypoglycemia [< 3.9 mmol/L (<70.3 mg/dL)]; euglycemia [3.9 to 10.0 mmol/L (70.3 to 180.2 mg/dL)]; hyperglycemia [> 10.0 mmol/L (>180.2 mg/dL)].](https://oup.silverchair-cdn.com/oup/backfile/Content_public/Journal/jcem/104/11/10.1210_jc.2019-00423/1/m_jc.2019-00423f1.jpeg?Expires=1750198461&Signature=HkGtfLI6TfTnCO3x~hx-DLOy8PF0axpqk~35U2HNgCSknmTNCF-utOM74gb4IFmpqki2XKaly1RXeXzp23647AuyDg6U4JaxrB8xxEyXARaRARHejIg~QUWaOgefcAAUP2~B6XFbq8PWQlPvCtvI15t~KtNHRUeJ675tydj7XR5ga9vixRlJxoZotiUfWrc08iUDBB3AT3wDHIq5IdR8iFE~3TlvRYfqwPnMbeh29KJmO3Ujzaz22HxwfDhIer~KcL7iO9l61UBiAiXF0mgxcDUAZzj18CtX1CHJmX5II5NAGwp3p-fHZbuAf1btah3pEhF8eYLTjyXGZGSTGUGeAw__&Key-Pair-Id=APKAIE5G5CRDK6RD3PGA)
Hormone and glucose levels in CIADM. (A) C-peptide pre- and post-diagnosis of CIADM. C-peptide levels over time in six patients with CIADM (8 mo before to 50 mo post onset). (B) Comparison of time spent in hypoglycemic, euglycemic, and hyperglycemic ranges for patients with T1D and CIADM via CGM. Hypoglycemia [< 3.9 mmol/L (<70.3 mg/dL)]; euglycemia [3.9 to 10.0 mmol/L (70.3 to 180.2 mg/dL)]; hyperglycemia [> 10.0 mmol/L (>180.2 mg/dL)].
Autoantibodies and HLA typing
Testing for diabetes-associated autoantibodies (DAAs) was performed at the time of diagnosis and at follow-up after diagnosis (range, 1 to 32 months) (Table 1). These included anti–glutamic acid decarboxylase antibody (GADA), anti-insulin antibody, islet antigen 2 antibody, and zinc transporter 8 antibody. Only two patients had a positive results for DAAs (both had GADA), and no patients had positivity for islet antigen 2 antibody, insulin antibody, or zinc transporter 8 antibody. No patient who had antibody negativity at diagnosis developed antibodies at subsequent testing.
Eight patients who developed CIADM underwent HLA class II typing. Three patients had a risk haplotype for T1D; two patients had DRB1*04-DQB1*03:02-DQA1*03:01, one patient had DRB1*03:01-DQB1*02:01-DQA1*05:01, and all were DAA negative. Interestingly, three patients had an HLA haplotype previously associated with protection against T1D (17): One had DRB1*07:01-DQB1*03:03-DQA1*02:01, one had DRB1*3:01, and one (who also had DRB1*04-DQB1*03:02-DQA1*03:01) had DRB1*11-DQB1*03:01-DQA1*05:01.
Management of CIADM and glycemic variability
All patients were commenced on multiple daily injections of insulin and all remained on insulin at data cutoff (follow-up range, 1 to 35 months). The choice of insulin depended on the patient’s ability to adjust insulin according to carbohydrate intake, with all patients initiated on basal bolus regimen (insulin glargine once daily and insulin aspart with meals); one patient switched to mixed insulin twice daily for convenience and enhanced adherence (insulin protamine and aspart). Two patients were switched to insulin pump therapy (insulin aspart) to improve glycemic control and reduce hypoglycemia.
Masked CGM was carried out for eight of the available patients with CIADM in order to review glycemia; those patients maintained optimal diet and insulin dosing via carbohydrate counting. Three patients were on prednisone at the time of monitoring because of concurrent diagnosis of hypophysitis, rash, or hepatitis at replacement doses (<10 mg daily). Comparison of conventional measures of glycemic variability between patients with CIADM and T1D of ≤5 years' duration (n = 10) or ≥20 years' duration (n = 20) showed no difference between groups, with similar mean glucose levels and indices of glycemic variability (Fig. 2A–2I). Similarly, subanalyses to restrict the data to patients with CIADM without DAA (n = 7) or patients not receiving prednisone at the time of CGM (n = 5) also demonstrated no difference in mean glucose or indices of glycemic variability (data not shown). Time spent within hypoglycemic, euglycemic, and hyperglycemic ranges did not differ between groups (Fig. 1B), highlighting that patients with CIADM have glycemic patterns that are similar to those in patients with established T1D.
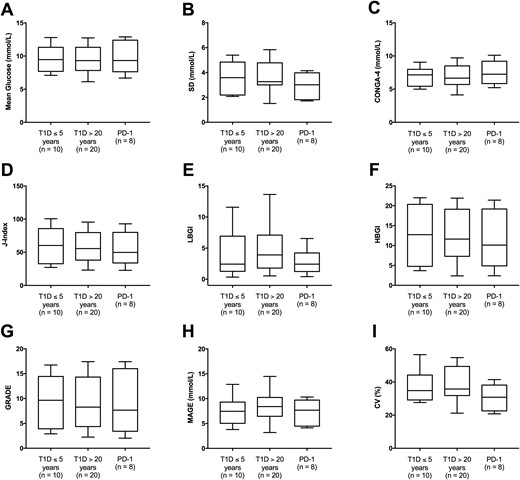
The three groups are T1D less than 5 y duration (T1D <5), T1D more than 20 y duration (T1D >20 y), and CIADM group (PD-1). Comparison of mean glucose and indices of glycemic variability between patients with T1D and CIADM. (A) Mean glucose. (B) SD of glucose. (C) Continuous overlapping net glycemic action over 4 h (CONGA-4). (D) J-index. (E) Low blood glucose index (LBGI). (F) High blood glucose index (HBGI). (G) Glycemic risk assessment diabetes equation (GRADE). (H) Mean amplitude of glycemic excursions (MAGE). (I) Coefficient of variation (CV).
Discussion
Checkpoint inhibitors have made a dramatic impact in oncology, initially for metastatic melanoma, but now also for a diverse spectrum of cancers. Endocrinopathies are common irAEs and generally develop within 8 weeks of initiation of immunotherapy (18). Several case reports have described new-onset insulin-dependent diabetes mellitus after PD-1 or PD-L1 inhibition (11–13). Our case series describes the time course of insulin-requiring diabetes in 10 patients receiving anti-PD1 immunotherapy for melanoma. We present the clinical and biochemical findings of a cohort of patients with CIADM.
Autoimmune diabetes has previously been near-synonymous with T1D, a condition clinically characterized by absolute insulin deficiency and the presence of β cell–associated serum autoantibodies (19). However, the predictors of T1D are not completely understood. The pathology of T1D is thought to be via T cell–mediated destruction of β cells following islet infiltration by leukocytes (20). Interplay between genetic and environmental factors has long been hypothesized; the exact nature of environmental triggers has been elusive. The strongest genetic risk is at the HLA class II loci, with evidence for both HLA susceptibility (mainly from DR3-DQB1*02:01 and/or DR4-DQB1*03:02) and HLA protection (17). HLA class II haplotypes DR4, DQB*0302, and/or DR3, DQB*0201 is present in >90% of T1DM. Hence it has been speculated that HLA typing may have a role in predicting the development of immunotherapy-related diabetes (17). Ongoing trials are looking at the utility of immunological markers, including islet cell antibody, insulin antibody, GADA, insulin-associated protein antibody, and zinc transporter 8 antibody (21), with higher titers and multiple positive antibodies being associated with higher risk for future T1D (22). Autoantibodies against β-cell antigens typically precede the onset of T1D by many years: anti-GADAs are present in 70% of cases (23), anti–insulin-associated protein antibodies in 58% of cases (24), and anti–zinc transporter antibody in 60% to 80% of cases. However, diabetes has developed in antibody negative patients without an HLA susceptible haplotype (25). The mechanism for the development of autoimmune diabetes is therefore poorly understood.
In contrast to patients with T1D, our cohort of patients with CIADM had characteristic features, including acute onset of hyperglycemia within 63 weeks of starting anti–PD-1 therapy, rapid decline in C-peptide concentrations consistent with sudden β-cell failure, high glycemic variability in keeping with absence of residual β-cell function (i.e., no honeymoon period), and infrequent association with DAAs. Previous case reports have usually referred to new-onset insulin-dependent diabetes mellitus that occurs after immunotherapies as T1D (11); a small subset of these patients may indeed have T1D, associated with positivity for DAAs. However, our data suggest that in general CIADM is a distinct pathophysiologic entity from T1D: most patients do not have DAAs, and several have HLA class II haplotypes that would normally protect against T1D. Sudden loss of β-cell function in CIADM, despite its occurrence in older adults, is also distinct from latent autoimmune diabetes of adult onset, in which positivity for DAAs (usually GADA) is associated with slow progression of β-cell failure. The sudden loss of C-peptide and insulin in the context of immunotherapy is a marker of CIADM, even in the context of other factors that worsen insulin resistance, such as corticosteroid therapy. We propose that this represents a new entity of autoimmune diabetes that we term CIADM.
CGM demonstrated the high glycemic variability characteristic of autoimmune diabetes; mean glucose, glycemic excursions, and time spent in hypoglycemic and hyperglycemic ranges were similar between CIADM and T1D. This further highlights the insulin-deficient nature of CIADM and indicates that patients with CIADM develop rapid-onset insulin deficiency, in the absence of the honeymoon period traditionally experienced by patients with T1D.
The mechanism of CIADM is not clear, although the condition seems likely to be due to β-cell autoinflammation triggered by disruption of normal immune surveillance. Hypotheses for other irAEs include autoreactive T cells, autoantibodies, and/or cytokine-mediated autoimmunity (26). Intriguingly, IL-17 was identified in some patients with ipilimumab-induced colitis (27). This same IL has been linked with the genesis of T1D: IL-17 neutralization prevents diabetes in susceptible mice, and Th17 immunity was upregulated in peripheral blood T cells from children with T1D (28). A determination of whether Th17 is dysregulated in CIADM will require specific immunophenotyping of circulating T cells from these patients. Preclinical models of PD-L1 and PD ligand 2 knockout mice suggest that PD-L1 expression on islet cells of the pancreas protects against autoimmune diabetes (29), and thus interruption of this immunoregulatory process using anti–PD-1/L1 inhibitors in humans may mechanistically cause diabetes. However, why such a low proportion of patients treated with immunotherapy develop CIADM remains unknown.
CIADM is an infrequent but permanent toxicity from anti–PD-1 and anti–PD-L1 ICIs. It appears to be distinct from T1D, occurring in older patients, without autoantibodies, and with sudden loss of insulin and variable glycemic control from onset. As such, CIADM represents a new model for autoimmune β-cell failure.
Acknowledgments
The authors thank the doctors, nurses, and clinical data management and biospecimen banking staff at Melanoma Institute Australia and Royal North Shore Hospital, as well as the patients and their families.
Financial Support: R.A.S. is supported by an Australian National Health and Medical Research Council Practitioner Fellowship. G.V.L. is supported by an Australian National Health and Medical Research Council Practitioner Fellowship and the Medical Foundation, The University of Sydney. A.M.M. is supported by a Cancer Institute NSW Fellowship.
Author Contributions: V.H.M.T. and A.M.M. devised the concept and design of the project. V.H.M.T., R.T.M., G.V.L., R.J.C.B., A.D.G., and A.M.M. collected data and wrote the draft manuscript. V.H.M.T. had full access to all the data in the study and had final responsibility for the decision to submit for publication. All authors contributed to and approved the final manuscript.
Disclosure Summary: R.J.C.B. has served on advisory boards for Eisai, Amgen, and Bayer and has received speaking honoraria from Eisai, Amgen, Novo Nordisk, and IPSEN. A.D.G. has served on advisory board for Bristol-Myers Squibb, Sun Pharma, Pfizer, Merck, kgA, Roche, and Eisai outside the submitted work. G.V.L. reports personal fees from Aduro, Amgen, Array, Bristol-Myers Squibb, Merck Sharp & Dohme, Novartis, Oncosec, and Pierre Fabre outside the submitted work. A.M.M. has served on advisory boards for Bristol-Myers Squibb, Merck Sharp & Dohme, Novartis, Roche, and Pierre-Fabre. The remaining authors have nothing to disclose.
Data Availability: The datasets generated during and/or analyzed during the current study are not publicly available but are available from the corresponding author on reasonable request.
Abbreviations:
- CGM
continuous glucose monitoring
- CIADM
checkpoint inhibitor–associated autoimmune diabetes mellitus
- DAA
type 1 diabetes–associated autoantibody
- GADA
glutamic acid decarboxylase antibody
- ICI
immune checkpoint inhibitor
- IQR
interquartile range
- irAE
immune-related adverse event
- PD-1
programmed cell death-1
- PD-L1
programmed cell death-1 ligand
- T1D
type 1 diabetes
