


Abstract
Cushing syndrome is characterized by glucocorticoid excess, which induces physical and mental symptoms, impairments in functional status and perceived health, resulting in impaired quality of life. Biochemical remission is urgently required; however, quality of life and cognitive function may remain impaired.
To perform a systematic review and meta-analysis evaluating changes in health-related quality of life and cognitive functioning in patients with Cushing syndrome after treatment.
Eight electronic databases were searched in March 2017, and PubMed again in May 2018, to identify potentially relevant articles. Eligible studies were (randomized controlled) trials, cohort studies, and cross-sectional studies assessing quality of life or cognitive functioning in patients treated for Cushing syndrome. Differences were expressed as standardized mean difference and reported with 95% confidence intervals. We compared patients before and after treatment (improvement) and patients after treatment and healthy controls (normalization).
We included 47 articles with 2643 patients. Most patients had Cushing disease and were in remission after treatment. Quality of life and cognitive functioning improved after treatment in all studied domains. Compared with a healthy control population, quality of life did not normalize. Cognitive functioning normalized in part, but not all, of the studied domains.
Treatment of Cushing syndrome improves quality of life and cognitive functioning. Because normalization was not achieved in quality of life and in some aspects of cognitive functioning, special and continuous attention should be given to these aspects for patients after treatment. Effective interventions for further improvement and possibly normalization are urgently needed.
Cushing syndrome resulting from endogenous glucocorticoid excess is a rare condition and is either adrenocorticotropic hormone (ACTH)-dependent or ACTH-independent, both with a variety of underlying causes (1). Glucocorticoid excess causes osteoporosis, central obesity, insulin resistance, dyslipidemia, proximal muscle weakness, hypertension, hypercoagulability, and neuropsychiatric disorders. Patients report fatigue, a variety of mental and physical symptoms, and impairment in quality of life (2, 3). Mortality and morbidity are increased even after long-term correction of glucocorticoid excess, including cognitive functioning, indicating irreversible adverse effects of previous hypercortisolism (4–6). In addition, structural and functional brain abnormalities were shown to be persistent after biochemical cure of Cushing syndrome, which was related to both quality of life (mainly disease-specific) and cognitive functioning impairments (mainly memory) in patients with Cushing syndrome (5).
First-choice treatment of Cushing disease is transsphenoidal pituitary surgery, selectively removing the corticotroph adenoma (7). Cushing syndrome is generally approached by removing the ACTH-producing tumor in ectopic Cushing syndrome and by adrenalectomy in ACTH-independent Cushing syndrome (8). If necessary to establish cure, repeat surgeries, radiotherapy, and pharmaceutical therapies are considered. After surgical treatment, many patients face a period of transient or permanent adrenal insufficiency and sometimes other hormone deficits (9). A particular issue after surgery, but sometimes also during medical therapy, is the steroid withdrawal syndrome with its severe musculoskeletal pains, fatigue, and emotional lability (10).
In 2012, a literature review summarized the effects of Cushing disease on clinical symptoms, including health-related quality of life and cognitive functioning, stating that current treatment options may not completely reverse the effects of chronic hypercortisolism (11). In 2015, another systematic review summarized quality of life in patients with a pituitary adenoma, concluding that patients with Cushing disease, along with patients with acromegaly, demonstrated the greatest impairment in quality of life, and the smallest improvement (12).
Until now, no meta-analysis has been performed to evaluate health-related quality of life or cognitive functioning in patients with Cushing syndrome before and after treatment.
Study aims
The aim of the current study aims to evaluate improvement in, and normalization of, health-related quality of life and cognitive functioning in patients with Cushing syndrome. Improvement in health-related quality of life and cognitive functioning will be evaluated by comparing patients before treatment to patients after treatment of Cushing syndrome. Whether health-related quality of life and cognitive functioning can normalize will be evaluated by comparing patients with Cushing syndrome after (multimodality) treatment to a healthy control population.
Methods
Eligibility criteria
(Randomized controlled) trials, cohort studies (measuring at different time points) and cross-sectional studies (measuring at one point in time), assessing quality of life or cognitive functioning in patients with Cushing syndrome were eligible for inclusion. Comparative studies (before-after treatment comparisons, or patients with Cushing syndrome compared with healthy controls) and noncomparative studies were considered for inclusion. Eligible quality-of-life questionnaires were validated generic, disease-specific (for Cushing syndrome), and domain-specific questionnaires. Articles were excluded if no separate results for patients with Cushing syndrome were described, if the study included children only, if no quantitative data of quality-of-life questionnaires or cognitive functioning tests were presented (e.g., only figure without numbers), or if the reported quality of life or cognitive functioning data could not be incorporated in our analysis for another reason (e.g., only percentage of patients below a certain cutoff provided). There were no restrictions regarding treatment of Cushing syndrome. If multiple studies with (partially) overlapping populations described the same questionnaire or test, only the data from the largest cohort were included per analysis. To minimize risk of selection bias, at least 10 patients had to be included per study group. Articles irretrievable online were requested by contacting the authors. Only articles written in English were considered.
Search strategy
PubMed, Embase, Web of Science, COCHRANE Library, CENTRAL, Emcare, LWW, and ScienceDirect were systematically searched in March 2017 in cooperation with a specialized librarian to identify potentially relevant articles (13). In May 2018, the search was repeated in PubMed. References of included articles were searched for relevant eligible articles.
Data extraction
The identified articles were all entered in EndNote 8 (Thomson Reuters, Philadelphia, PA). First, the studies were screened by title and abstract. Two independent reviewers reviewed potentially relevant articles in detail. For reporting, the Meta-analysis Of Observational Studies in Epidemiology guidelines were used (14).
The following data were extracted from all included articles: study period, study center, study design, etiology of Cushing syndrome, number of patients, treatment of Cushing syndrome, age, sex, duration of follow-up, type and number of control subjects, quality-of-life questionnaires and cognitive functioning tests used, and outcomes of these tests. If available, separate outcomes were extracted for patients in remission and patients not in remission after treatment.
If data were only presented according to categories (e.g., remission status, sex), the data were combined into one outcome score using a fixed-effects meta-analysis for the main analyses. Combination scores were calculated from the subscale scores for the following questionnaires: Cushing Quality of Life questionnaire (CushingQoL) (15), Symptom Rating Test (16), Multidimensional Fatigue Inventory-20 (17), Nottingham Health Profile (18), and the Hospital Anxiety and Depression Scale (18). For one article, the scores after treatment were calculated using the scores before treatment and the difference between before and after treatment, imputing the SD from before treatment as the best estimate of the SD after treatment (19). If estimate and 95% CI, but not SD, were given for a single group, the following formula was used to calculate SD: ((CI)/2)/TINV (0.05; n − 1) × SQRT (n), with n = number of patients, in which TINV indicates the inverse of the two-tailed Student T distribution and SQRT indicates square root. If data for two groups were combined as described previously, SD was calculated using the following formula: SQRT [([(n1 − 1) × SD12] + [(n2 − 1) × SD22])/[(n1 + n2) − 2]], with n1 indicating number of patients in group 1, SD1 the SD in group 1, n2 the number of patients in group 2, and SD2 the SD in group 2. From one article, two questionnaires were excluded (Short Form health survey-36 and Beck Depression Inventory) (20), and from another article, one questionnaire was excluded (State Trait Anxiety Inventory) (21), because of highly improbable or impossible outcomes (e.g., State Trait Anxiety Inventory score < 20 points).
Risk of bias assessment
A component approach was used to assess risk of bias for all included studies. Components that could potentially bias a reported association between treatment of Cushing syndrome and quality of life or cognitive functioning were included as follows.
Loss to follow-up <5% was considered low risk of bias for follow-up studies; similarly, missing quality-of-life or cognitive functioning data in <5% of patients was considered low risk of bias for cross-sectional studies.
Inclusion of patients: consecutive inclusion of all eligible patients or a random sample was considered low risk of bias.
Criteria for diagnosis of Cushing syndrome: at least one of the following biochemical parameters had to be increased for low risk of bias: 24-hour urinary free cortisol or midnight salivary cortisol.
Criteria for remission of Cushing syndrome: at least normalization of biochemical hypercortisolism had to be measured for low risk of bias.
Test quality: number of cognitive domains assessed, validation of used questionnaires and tests, reporting of test instructions for cognitive tests, and reporting of sequence of cognitive tests were described for each study. Low risk of bias is considered use of validated questionnaires and tests only and reporting both test instructions and sequence of cognitive tests.
Risk of bias assessment was used to explore potential heterogeneity. Confounding was assessed by comparing baseline characteristics (age, sex, duration of follow-up, and treatment methods) for all included studies, as well as by comparing study group characteristics per study with a direct comparison before vs after treatment, or between patients after treatment and healthy controls. These assessments were made based on study level data.
Study end points
Quality-of-life scores were pooled for generic, disease-specific, and domain-specific (per domain) questionnaires separately. Analyzed domains were anxiety, depression, and fatigue because these were the only domains with enough data for analysis. Cognitive functioning was analyzed in the following categories: intelligence (including concept formation), executive functioning (i.e., visuomotor tracking, inhibition, and mental flexibility), attention (i.e., divided, sustained), and memory (i.e., auditory, visual). In the category intelligence, the following tests were analyzed: (i) Wechsler Adult Intelligence Scale – Revised; (ii) similarities; and (iii) Raven's Progressive Matrices. In the category executive functioning, the following tests were analyzed: (i) Trail Making Test (trail A-D) and (ii) fluency tests [Verbal fluency, Word fluency, and the FAS test in which as many words as possible starting with the letters F, A, and S should be produced within a prescribed time frame]. In the category attention, the following tests were analyzed: (i) substitution tests [digit symbol (substitution) test], digit symbol coding, and letter-digit substitution test, and (ii) digit span. For the category memory, no analyses could be performed because of the large variety in used memory tests.
Per analysis, all quality-of-life questionnaires and cognitive functioning tests were included, with notifications for studies with (partially) overlapping populations using different questionnaires or tests. To provide the most complete picture as possible, we included all total scores as well as subscores, if available. However, we did not include single items in our analysis. Separate analyses were performed per questionnaire or test (including subscales if provided) reported by at least two articles. Stratified analyses were performed for longitudinal and cross-sectional studies. Main analyses were performed in all included studies. Subgroup analyses were performed for patients with Cushing disease only, and for patients in remission and patients not in remission after treatment. Separate analyses were performed according to follow up time (short-term follow-up was defined as ≤12 months; long-term follow-up was defined as >12 months) if sufficient studies with both short-term as well as long-term follow-up were included.
Data were displayed separately for quality-of-life and cognitive functioning scores of patients before treatment of Cushing syndrome, after treatment of Cushing syndrome, and for a healthy control population. Notifications were added stating for which questionnaires and tests a higher score represents a lower quality of life or worse cognitive functioning.
Statistical analysis
Primary study outcomes were the standardized mean differences (SMD) before vs after treatment, as well as treated patients vs healthy controls, within studies. As a rule of thumb for the interpretation of the SMD, an effect size of 0.2 represents a small effect, 0.5 represents a moderate effect, and 0.8 represents a large effect (22). A random-effects model was used because no fixed effect could be assumed because of the heterogeneity in questionnaires or tests; a fixed-effect model was used for analyses per questionnaire or test including less than five articles as in this case the between-study variance cannot be estimated reliably. All SMD scores were accompanied by 95% CI. No overall scores were presented per analysis with various tests/questionnaires, because a different number of (sub)scales per included article resulted in unintentional inequality in assigned weights per study, leading to incorrect effect estimates and CIs. For meta-analyses only, questionnaires and tests in which a higher score represents a lower quality of life or worse cognitive functioning were reversed by multiplying the outcome with −1, ensuring that all outcomes were in the same direction. For three articles, “±” was interpreted as SD in the analyses because this remained unclear after reading the articles (20, 23, 24). The digit symbol (substitution) test and letter-digit substitution test were included in the analyses in items/second, the Trail Making Test in seconds, and fluency tests in number/minute. All analyses were performed in Stata 14.2 (Stata Corp., College Station, TX).
Results
Study selection
The initial search yielded 717 potentially relevant articles. After searching through references of included articles and repeating the search in PubMed in May 2018, another nine articles were added, providing 726 articles. After screening the articles by title and abstract, 603 articles were excluded, leaving 123 articles for detailed review. In total, 47 articles were included in this systematic review and meta-analysis, of which 32 reported on quality of life only, 10 on cognitive functioning only, and 5 on both quality-of-life and cognitive functioning. Reasons for excluding articles are summarized in Fig. 1.
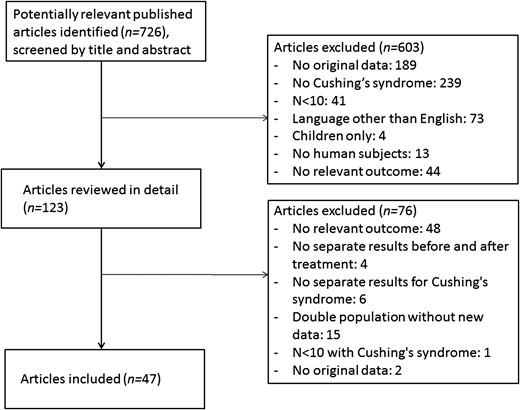
Flow chart of inclusion of articles in this systematic review.
Study characteristics
We included 27 cross-sectional studies (6, 18, 20, 21, 23, 25–46), 16 cohort studies (24, 47–61), 1 article that included both a cross-sectional study part and a cohort study part (62), 1 single-arm trial (63), and 2 articles about the same randomized controlled trial (pasireotide 600 µg vs pasireotide 900 µg) (19, 64). Studies were published between 1985 and 2017. Of the included studies, 28 reported on Cushing disease only, one on adrenal Cushing syndrome only, 17 described a mixed population, and one study included a cohort of patients with Cushing disease only, as well as a mixed population cross-sectional study part. In total, the included studies described 2643 patients, partially from overlapping populations.
Seventeen articles included a healthy control group (n = 2335, also partially from overlapping populations), of which 15 studies matched controls on at least age and sex, and 9 articles used normative data from the general population or literature reference values. Studies comparing patients before and after treatment by design included the same population for both measurement times, reducing risk of confounding, although bias remains possible through loss to follow up, as described in the following section.
Baseline characteristics varied between all included studies. Because data were insufficient to estimate risk of confounding, and inclusion of articles for meta-analysis differed per analysis and per domain, baseline characteristics data were summarized for all articles. Average age was between 33.6 and 57.0 years. Percentage of female patients varied between 40% and 100%. Average duration of follow-up for cohort studies was 6 to 54 months. Four studies, which were not included in any meta-analysis, did not present data after treatment. Of the remaining 43 studies, 23 used multimodality treatment, 15 used surgical procedures only, three only used pharmaceutical treatment, and two did not describe the nature of the treatment (13).
Risk of bias assessment
Loss to follow-up was reported by 14 of 20 cohort studies and trials, with a range of 0% to 74% loss to follow-up. Only four studies reported a loss to follow-up <5%. Of the 27 cross-sectional studies, six (22%) reported missing data for quality-of-life or cognitive functioning ≥5%. Fourteen articles (30%) explicitly stated including consecutive patients. Criteria for diagnosis of Cushing syndrome were reported adequately by 21 studies (45%). Criteria for remission of Cushing syndrome were reported adequately by 26 studies of 43 with postoperative measurements (61%) (13).
Study outcomes
Quality of life was reported in 37 articles, using eleven different generic questionnaires, two disease-specific questionnaires (i.e., CushingQoL and Tuebingen Cushing disease quality of life inventory), and 21 domain-specific questionnaires (including among others five anxiety, six depression, and five fatigue questionnaires). Twelve studies reported quality of life both before and after treatment. Quality-of-life data were reported for patients with Cushing syndrome before treatment by 15 studies, for patients with Cushing syndrome after treatment by 34 studies, and for a healthy control population by 17 studies.
Cognitive functioning was reported in 15 articles, using 35 different tests (including four tests on intelligence and concept formation, six on executive functioning, ten on attention, and 14 on memory). Only six studies reported cognitive functioning both before and after treatment. Cognitive functioning scores were reported for patients with Cushing syndrome before treatment by eight studies, for patients with Cushing syndrome after treatment by thirteen studies, and for a healthy control population by twelve studies. Detailed study outcomes and an overview of all included questionnaires and tests with abbreviations can be found elsewhere (13).
Meta-analyses of improvement of quality-of-life and cognitive functioning
Quality-of-life and cognitive functioning improved after treatment in all studied categories (generic, disease-specific, domain-specific: anxiety, and domain-specific: depression quality of life, and the cognitive functions intelligence, executive functioning, and attention). Generic quality of life improved by an SMD of 0.11 to 1.75 in all included studies (Fig. 2). The analysis of generic quality of life before vs after treatment stratified by follow-up time did not show a clear difference between studies with short-term follow-up (improvement after treatment by SMD of 0.38 to 1.75) vs studies with long-term follow-up (improvement after treatment by SMD of 0.11 to 1.74). Disease-specific quality of life improved by an SMD of 0.16 to 1.57 in all included studies (Fig. 3). For domain-specific quality-of-life and cognitive functioning, studies showed SMDs of 0.08 to 0.86, indicating improvement in all aspects of quality-of-life and cognitive functioning.
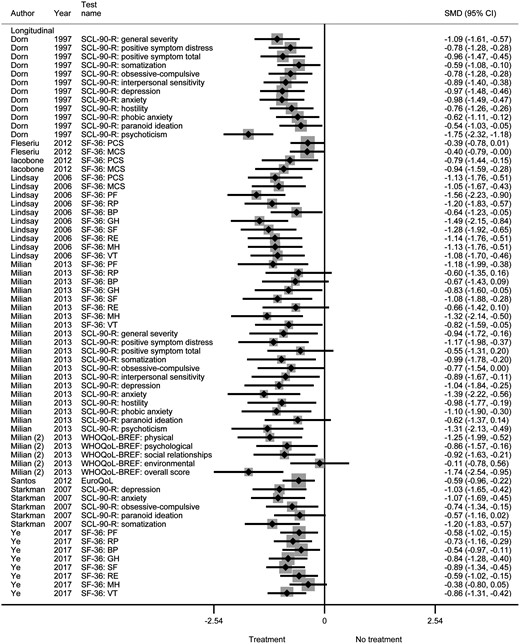
Generic quality of life before vs after treatment of Cushing syndrome.
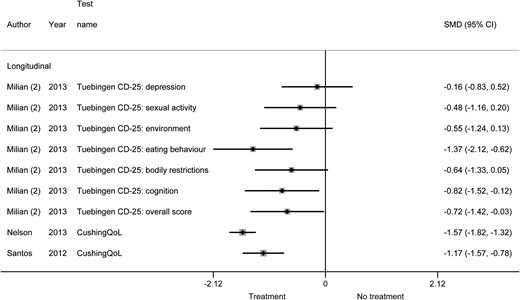
Disease-specific quality of life before vs after treatment of Cushing syndrome.
Table 1 shows a summary of all meta-analyses regarding improvement in quality-of life and cognitive functioning, including subgroup analyses for patients with Cushing disease only, and analyses stratified by remission status after treatment. In an online repository, we show the raw figures for the main analyses, analyses for patients with Cushing disease only, analyses according to remission status, and analyses according to remission status for patients with Cushing disease only, respectively (13).
Summary of Results of Improvement in and Normalization of Quality of Life and Cognitive Functioning in Cushing Syndrome
| Main Analysis (All Etiologies Included) | CD Only | Stratified by Remission Status: Remission | Stratified by Remission Status: No Remission | CD Only and Stratified by Remission Status: Remission | CD Only and Stratified by Remission Status: No Remission | |
|---|---|---|---|---|---|---|
| Generic quality of life | ||||||
| 1. Improvement? (Do patients after treatment score better than before treatment?) | Yes (l, s = 9, t = 65): SMD 0.11 (a) to 1.75 (a) | Yes (l, s = 5, t = 48): SMD 0.11 (a) to 1.74 (a) | Yes (l, s = 5, t = 25): SMD 0.11 (a) to 1.75 (a) | IDM-A | Yes (l, s = 2, t = 10): SMD 0.11 (a) to 1.74 (a) | IDM-A |
| 2. Normalization? (Do patients after treatment score as well as or better than healthy controls?) | No (c, s = 7, t = 59): SMD 0.05 (a) to 1.61 (h) | No (c, s = 6, t = 58): SMD 0.05 (a) to 1.61 (h) | No (c, s = 5, t = 53): SMD 0.05 (a) to 1.61 (h) | No (c, s = 2, t = 28): SMD 0.40 (a) to 2.25 (h) | No (c, s = 4, t = 52): SMD 0.05 (a) to 1.61 (h) | No (c, s = 2, t = 28): SMD 0.40 (a) to 2.25 (h) |
| Disease-specific quality of life | ||||||
| 1. Improvement? (Do patients after treatment score better than before treatment?) | Yes (l, s = 3, t = 9): SMD 0.16 (a) to 1.57 (a) | Yes (l, s = 2, t = 8): SMD 0.16 (a) to 1.57 (a) | Yes (l, s = 3, t = 9): SMD 0.16 (a) to 1.37 (a) | Yes (l, s = 2, t = 2): SMD 0.63 (a) to 1.60 (a) | Yes (l, s = 2, t = 8): SMD 0.16 (a) to 1.37 (a) | IDM-A |
| 2. Normalization? (Do patients after treatment score as well as or better than healthy controls?) | IDM-A | IDM-A | IDM-A | IDM-A | IDM-A | IDM-A |
| Quality of life, domain: anxiety | ||||||
| 1. Improvement? (Do patients after treatment score better than before treatment?) | Yes (l, s = 2, t = 3): SMD 0.25 (a) to 0.59 (a) | IDM-A | IDM-A | IDM-A | IDM-A | IDM-A |
| 2. Normalization? (Do patients after treatment score as well as or better than healthy controls?) | No (c, s = 3, t = 4): SMD: 0.50 (h) to 0.96 (h) | No (c, s = 3, t = 4): SMD: 0.50 (h) to 0.96 (h) | No (c, s = 3, t = 4): SMD: 0.50 (h) to 0.96 (h) | IDM-A | No (c, s = 3, t = 4): SMD: 0.50 (h) to 0.96 (h) | IDM-A |
| Quality of life, domain: depression | ||||||
| 1. Improvement? (Do patients after treatment score better than before treatment?) | Yes (l, s = 2, t = 2): SMD 0.35 (a) to 0.51 (a) | IDM-A | Yes (l, s = 2, t = 2): SMD 0.35 (a) to 0.41 (a) | IDM-A | IDM-A | IDM-A |
| 2. Normalization? (Do patients after treatment score as well as or better than healthy controls?) | No (c, s = 4, t = 5): SMD 0.33 (h) to 1.20 (h) | No (c, s = 4, t = 5): SMD 0.33 (h) to 1.20 (h) | No (c, s = 4, t = 5): SMD 0.33 (h) to 1.20 (h) | IDM-A | No (c, s = 4, t = 5): SMD 0.33 (h) to 1.20 (h) | IDM-A |
| Quality of life, domain: fatigue | ||||||
| 1. Improvement? (Do patients after treatment score better than before treatment?) | IDM-A | IDM-A | IDM-A | IDM-A | IDM-A | IDM-A |
| 2. Normalization? (Do patients after treatment score as well as or better than healthy controls?) | No (c, s = 2, t = 7): SMD 0.20 (h) to 1.08 (h) | IDM-A | No (c, s = 2, t = 7): SMD 0.20 (h) to 1.08 (h) | IDM-A | IDM-A | IDM-A |
| Cognitive function: intelligence | ||||||
| 1. Improvement? (Do patients after treatment score better than before treatment?) | Yes (l, s = 3, t = 6): SMD 0.08 (a) to 0.77 (a) | IDM-A | Yes (l, s = 3, t = 6): SMD 0.08 (a) to 0.77 (a) | IDM-A | IDM-A | IDM-A |
| 2. Normalization? (Do patients after treatment score as well as or better than healthy controls?) | Partially (l, s = 3, t = 6): SMD 0.55 (a) to 0.78 (h) | IDM-A | Partially (l, s = 3, t = 6): SMD 0.55 (a) to 0.78 (h) | IDM-A | IDM-A | IDM-A |
| Cognitive function: executive functioning | Yes (l, s = 3, t = 6): SMD 0.19 (a) to 0.86 (a) | Yes (l, s = 3, t = 6): SMD 0.19 (a) to 0.86 (a) | ||||
| 1. Improvement? (Do patients after treatment score better than before treatment?) | Yes (l, s = 2, t = 4): SMD: 0.48 (a) to 0.31 (h) | Yes (l, s = 2, t = 2): SMD 0.19 (a) to 0.78 (a) | Yes (l, s = 2, t = 4): SMD: 0.48 (a) to 0.31 (h) | IDM-A | Yes (l, s = 2, t = 2): SMD 0.19 (a) to 0.78 (a) | IDM-A |
| 2. Normalization? (Do patients after treatment score as well as or better than healthy controls?) | Unclear (c, s = 4, t = 9): SMD 0.00 to 0.31 (h) | Unclear (c, s = 2, t = 3): SMD 0.00 to 0.11 (h) | Unclear (c, s = 3, t = 7): SMD 0.00 to 0.33 (h) | IDM-A | Unclear (c, s = 2, t = 3): SMD 0.00 to 0.33 (h) | IDM-A |
| Cognitive function: attention | Yes (l, s = 2, t = 4): SMD 0.53 (a) to 0.71 (a) | Yes (l, s = 2, t = 4): SMD 0.53 (a) to 0.71 (a) | ||||
| 1. Improvement? (Do patients after treatment score better than before treatment?) | Yes (l, s = 2, t = 4): SMD 0.25 (a) to 0.14 (h) | IDM-A | Yes (l, s = 2, t = 4): SMD 0.25 (a) to 0.14 (h) | IDM-A | IDM-A | IDM-A |
| 2. Normalization? (Do patients after treatment score as well as or better than healthy controls?) | No (c, s = 3, t = 5): SMD 0.16 (h) to 0.31 (h) | No (c, s = 2, t = 2): SMD 0.21 (h) to 0.31 (h) | Unclear (c, s = 2, t = 2): SMD 0.11 (a) to 0.31 (h) | IDM-A | Unclear (c, s = 2, t = 2): SMD 0.11 (a) to 0.31 (h) | IDM-A |
| Cognitive function: memory | ||||||
| 1. Improvement? (Do patients after treatment score better than before treatment?) | IDM-A | IDM-A | IDM-A | IDM-A | IDM-A | IDM-A |
| 2. Normalization? (Do patients after treatment score as well as or better than healthy controls?) | IDM-A | IDM-A | IDM-A | IDM-A | IDM-A | IDM-A |
Abbreviations: a, patients after treatment performed better than before treatment; b, patients before treatment performed better than patients after treatment; c, cross-sectional; CD, Cushing disease; h, healthy controls performed better than patients after treatment; IDM-A, insufficient data for meta-analysis; l, longitudinal; s, number of studies included; SMD, standardized mean difference; t, number of (sub)tests or (sub)questionnaires included.
Meta-analyses of normalization of quality-of-life and cognitive functioning
Quality of life did not normalize after treatment of Cushing syndrome. For generic quality of life, SMDs varied across included studies from 0.05 in favor of patients after treatment to 1.61 in favor of healthy controls (Fig. 4). For domain-specific quality of life, SMDs varied from 0.20 to 1.20, indicating that healthy controls consistently have higher quality of life than patients after treatment of Cushing syndrome.
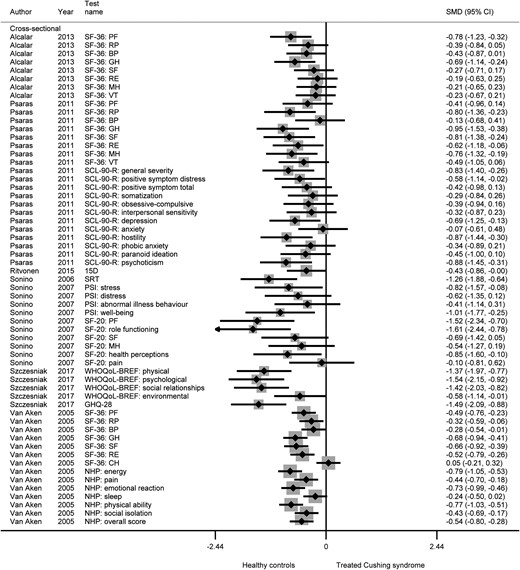
Generic quality of life after treatment of Cushing syndrome vs healthy controls.
Cognitive functioning partially normalized after treatment of Cushing syndrome. SMDs for intelligence varied across studies from 0.55 in favor of patients after treatment to 0.78 in favor of healthy controls. Executive functioning and attention were tested in both longitudinal as well as cross-sectional studies, which showed conflicting results. The longitudinal studies showed normalization of both domains of cognitive functioning, with SMDs varying between 0.48 in favor of patients after treatment and 0.31 in favor of healthy controls. The cross-sectional studies showed SMDs of 0.00 to 0.31 in favor of healthy controls, suggesting that no normalization of cognitive functioning had occurred. More detailed results regarding normalization of quality of life and cognitive functioning can be found in Table 1 and the online repository, including subgroup analyses (13).
Discussion
The present systematic review and meta-analysis shows that quality of life and cognitive functioning improve after treatment of Cushing syndrome. However, quality of life does not normalize, and only partial normalization occurs in cognitive functioning. These results demonstrate that biomedical treatment of Cushing syndrome is a step toward improvement in quality of life and cognitive functioning, but that room for further improvement remains in aiming to establish normalization of quality of life and cognitive functioning. Alternatively, the effect of persisting effects of transient hypercortisolism or ongoing adrenal insufficiency have to be acknowledged.
The present observations are in line with the results of a previous literature review by Feelders et al., which described that health-related quality of life improved in patients with Cushing disease during biochemical remission, but that it remained impaired compared with healthy controls. The same study also found that cognitive functioning did not improve short-term, and suggested that there may be a delay between correction of hypercortisolism and recovery of impairments in cognitive functioning (11). This is supported by our findings, because we found improvement and partial normalization of cognitive functioning during longer term follow-up. Because there was only one analysis (generic quality of life before vs after treatment) with sufficient studies with short-term follow-up as well as sufficient studies with long-term follow-up for analysis, extensive analyses according to follow-up time for both cognitive functioning as well as quality of life could not be performed. Our findings are in accordance with another systematic review by Andela et al., which described quality of life in patients with a pituitary adenoma in general, and found that patients with Cushing disease showed the smallest improvement and no normalization after treatment. They also reported room for further improvement in quality of life, potentially by psychosocial interventions as well as optimal medical treatment (12). Two articles were published after our last search in May 2018. Our results were in accordance with the one by Valassi et al., which demonstrated that quality of life, as assessed with the European Quality of Life Scale 5D (EQ-5D) and CushingQoL, improved after treatment of Cushing syndrome (65). The second article by Osswald et al. compared quality of life, as assessed with the Short Form health survey-36, CushingQoL, and Tuebingen Cushing disease quality of life inventory, between patients in remission of ectopic Cushing syndrome and patients with remitted Cushing disease, and observed that female patients with ectopic Cushing syndrome reported a better quality of life compared with female patients with Cushing disease. This difference was not observed in male patients. Comparing the quality of life scores of these patients to the quality-of-life scores reported in our included studies, it can be observed that the patients in the study of Osswald et al. scored better on all three questionnaires. Because this study included a small population (n = 69), their results would have meant a small change toward better quality of life in the average that we found for analyses including these questionnaires after treatment of Cushing syndrome only (66).
Although quality of life and cognitive functioning have been addressed before separately in systematic reviews, this systematic review and meta-analysis investigates both quality of life as well as cognitive functioning, which are both clinically relevant outcomes based on effects of previous hypercortisolism on the brain, and should both be evaluated for the well-being of the patient. Furthermore, not only patients with Cushing disease were included, but all patients with Cushing syndrome. The following study limitations need to be taken into account when interpreting the results. Included studies showed heterogeneity regarding etiology of Cushing syndrome, applied multimodality treatments, remission status after treatment, and follow-up duration. Results were consistent across the subgroup analyses for Cushing disease only and the subgroup analyses stratified by remission status. Unfortunately, no separate analyses for the subgroup of patients with adrenal Cushing syndrome could be performed because of a lack of sufficient separate data. Future research should aim to provide quality-of-life and cognitive functioning outcomes separately for the group of patients with adrenal Cushing syndrome. Because of a lack of sufficient data per category, no separate analyses stratified by treatment strategy could be performed. Because longitudinal studies are more suitable to compare individual changes in follow-up, interventions, and course of the disease than cross-sectional studies, analyses were performed separately for longitudinal vs cross-sectional studies. Only two cognitive functioning domains were tested by enough longitudinal and cross-sectional studies to perform and compare both analyses, hindering extensive comparison between the two study designs. Studies directly comparing different treatment strategies should be performed to determine the effect of treatment strategy on quality of life and cognitive functioning improvement and normalization.
Because there were already few articles included per category, no sensitivity analysis with only low risk of bias studies could be performed. Only two of the included articles had low risk of bias on all components. Most of the included articles were not low risk of bias because they had too high loss to follow-up or because they selected patients based on remission status. High loss to follow-up could have caused bias in longitudinal studies. Because it is most likely that patients who perform worse find it important to participate in quality-of-life research, our results may be too pessimistic, meaning that the improvement after treatment is actually larger than we observed. Publication bias was minimized by searching for otherwise unpublished meeting abstracts in Embase, Web of Science, and COCHRANE Library. This did not lead to additional data. Another potential source of bias is the selection of a population from a single center compared with a studying a population-based cohort. Unfortunately, no population-based cohort studies were included in our systematic review, probably because quality of life and cognitive functioning are often reported as secondary outcomes from a cohort collected from a single center to report outcomes of various treatments. It would be valuable future research to perform a population-based study of quality of life and cognitive functioning in patients with Cushing syndrome to compare with the results of this review.
Because glucocorticoid excess is known to cause not only physical symptoms, but also reduced quality of life and cognitive symptoms (2, 3), improvement in quality of life and cognitive functioning after treatment of Cushing syndrome could be explained by the normalization of cortisol concentrations with accompanying reduction in physical symptoms of Cushing syndrome. Lack of normalization of quality of life and cognitive functioning after treatment might be explained by the structural and functional brain abnormalities observed in patients with active Cushing syndrome, that even persist after long-term remission of Cushing syndrome (5). The partial normalization in cognitive functioning found in this study has not been described previously. Only the results from two small cohort studies showed clear normalization in cognitive functioning (50, 55). Larger cohort or cross-sectional studies, or (randomized controlled) trials comparing different treatment methods, are necessary to confirm the normalization in cognitive functioning observed in these two small cohort studies. Theoretically, partial normalization in cognitive functioning might be explained by the involvement of different brain regions in cognitive functioning tasks that showed normalization, than the brain regions affected by structural and functional abnormalities as described here. Focus groups on quality of life showed that patients complain of persisting symptoms, and that important disease-specific aspects are currently missing from quality of life questionnaires (67). The difficulty remains that there are usually no “baseline” measurements of either quality of life or cognitive functioning before start of symptoms of Cushing syndrome, which means there is no certainty if normalization for the individual patient is achieved. There is a need for consensus regarding which items of quality of life and cognitive functioning should be measured, to ensure better evaluation in the future.
In conclusion, treatment of Cushing syndrome is an effective step in improving quality of life and cognitive functioning. However, the most effective treatment regimen for Cushing syndrome regarding improvement in quality of life and cognitive functioning is still unknown, and probably consists of a multidisciplinary approach of at least endocrinology, surgery, and psychology, as well as early diagnosis to minimize permanent structural and functional brain abnormalities. Because no normalization could be achieved in quality-of-life and part of the cognitive functioning domains, patients require special attention from the clinician for quality of life as well as for cognitive functioning after effective treatment of Cushing syndrome. Interventions for further improvement and possibly normalization of quality of life and cognitive functioning should be investigated with priority. In the meantime, acknowledgment of persisting limitations in these domains from treating physicians and other caretakers is important to support patients in their daily life.
Acknowledgments
The authors are indebted to J.W. Schoones for his help in conducting the literature search.
Additional Information
Disclosure Summary: The authors have nothing to disclose.
Data Availability: All data generated or analyzed during this study are included in this published article or in the data repositories listed in References.
Abbreviations:
- ACTH
adrenocorticotropic hormone
- CushingQOL
Cushing Quality of Life questionnaire
- SMD
standardized mean difference
