


Abstract
Prospective studies on caffeine and different types of coffee intake in relation to the risk of ovarian cancer have shown conflicting results.
The aim of the present study was to perform a dose–response meta-analysis of cohort studies on the association between dietary caffeine intake, different types of coffee consumption, and the risk of ovarian cancer.
PubMed/Medline, ISI Web of Science, Scopus, and EMBASE were searched to identify relevant studies reported until October 2018.
Prospective cohort studies that had considered caffeine or different types of coffee as the exposure variable and ovarian cancer as the main outcome variable or as one of the outcome variables were included in our systematic review and meta-analysis. Two of us independently screened 9344 publications. A total of 14 cohort studies were included in the meta-analysis.
Two of us independently extracted the data. Any disagreements were resolved in consultation with the principal investigator.
Combining 13 effect sizes, we found no substantial association between coffee consumption and risk of ovarian cancer [risk ratio (RR), 1.08; 95% CI, 0.89 to 1.33]. Also, one additional cup daily of coffee consumption was marginally associated with an increased risk of ovarian cancer (RR, 1.02; 95% CI, 0.99 to 1.05; P = 0.21; I2 = 0.0%; Pheterogeneity = 0.68). No statistically significant association was observed between caffeine intake or caffeinated or decaffeinated coffee consumption and the risk of ovarian cancer.
We found no statistically significant association between caffeine intake or different types of coffee and the risk of ovarian cancer.
Ovarian cancer is the fifth most common cause of cancer deaths among women in the world (1). Its incidence and mortality has increased in recent years in Iran (2). Several factors, including age, family history, and genetic factors, might contribute to the incidence of ovarian cancer (1). Dietary intake has also been considered to play an important role in its etiology (3). Among the dietary factors, the association of coffee consumption and ovarian cancer has attracted great interest.
Coffee is one of the most popular beverages in the world (4). It contains many biologically active components that could have antitumor effects (5). Previous studies have examined the associations between coffee consumption with various types of cancers, including breast, colorectal, lung, endometrial, and prostate cancer (6–10). The association between coffee consumption and the risk of ovarian cancer has been widely examined; however, the findings have been inconclusive. In a prospective study of Norwegian women, no substantial association was found between coffee intake and the risk of ovarian cancer (11). The results from another cohort study revealed an increased risk of ovarian cancer among women who had consumed five cups daily of caffeinated coffee compared with women who did not drink coffee (12). Some additional studies also had not observed a statistically significant association (13, 14).
A 2007 meta-analysis on the association of coffee intake and the risk of ovarian cancer revealed no substantial association (15). However, several additional studies have been conducted since that meta-analysis was reported. A recently reported dose–response meta-analysis found no statistically significant association between the dose of coffee and ovarian cancer (16). However, these meta-analyses (15, 16) had focused on coffee intake but had not considered the caffeine intake or other types of coffee. In addition, Berretta et al. (16) excluded some of the cohort studies we included in our study (17–20). Moreover, Berretta et al. (16) had considered caffeinated coffee in the study by Tworoger et al. (21) as total coffee, while Tworoger et al. (21) had also provided data on decaffeinated coffee that was not included in the study by Berretta et al. (16). The aim of the present study, therefore, was to systematically review the current evidence on the association of caffeine and the consumption of different types of coffee and the risk of ovarian cancer. Furthermore, we performed a dose–response meta-analysis summarizing the earlier findings on this topic.
Methods and Materials
Search strategy
A systematic search on all studies reported until October 2018 was conducted using the online databases of PubMed/Medline, ISI Web of Science, Scopus, and EMBASE. The keywords used in our search strategy were as follows: (Coffee OR Caffeine OR Drink OR Beverage OR “Caffeinated beverages” OR “Coffee consumption” OR “Coffee intake” OR “Coffee drinking” OR “Caffeine consumption”) AND [(Neoplasm AND Ovarian) OR “Ovarian neoplasm” OR (Neoplasm AND Ovary) OR “Ovary neoplasm” OR “Ovary cancer” OR “Ovarian malignancy” OR (Cancer AND Ovary) OR “Ovarian cancer” OR (Cancer AND Ovarian) OR “Ovarian carcinoma”]. No language or time restrictions were used. In addition, no attempt was made to include unreported studies. Next, a manual search was performed of the references from the studies already chosen for inclusion, to avoid missing any publications. Finally, we also interviewed experts in the field to identify any additional studies. Two reviewers independently screened the output of the search to identify potentially eligible studies.
Inclusion criteria
Each title and abstract were reviewed to identify relevant studies. The full texts of the reports were reviewed if the abstract suggested that caffeine and the types of coffee consumption had been examined in relation to the risk of ovarian cancer. Studies with the following criteria were eligible for inclusion: (i) all human studies that considered caffeine or types of coffee as the exposure and ovarian cancer as the main outcome or as one of the outcomes; (ii) publications in which ORs, rate or risk ratios (RRs), or hazard ratios (HRs) were used to report the effect sizes (ESs) (Table 1).
PICOS Criteria for Study Inclusion
| Variable | Description |
|---|---|
| Population | Women |
| Intervention | Coffee, caffeine, caffeinated coffee, and decaffeinated coffee consumption |
| Comparator | Highest vs lowest category of coffee, caffeine, caffeinated coffee, and decaffeinated coffee consumption, per 1 cup daily increase in different types of coffee consumption, per 100 mg/d increase in caffeine consumption |
| Outcome | Ovarian cancer |
| Setting | Prospective cohort studies |
Abbreviation: PICOS, patients, intervention, comparator, outcomes, study design.
Exclusion criteria
In our systematic review and meta-analysis, letters, comments, reviews, meta-analyses, ecological studies, and animal studies were excluded. In the initial search, 9344 reports were identified. After elimination of duplicates, 8848 reports remained. Finally, 8834 studies were excluded by the title and abstract, and 14 potentially related articles remained for inclusion in our systematic review and meta-analysis (Fig. 1).
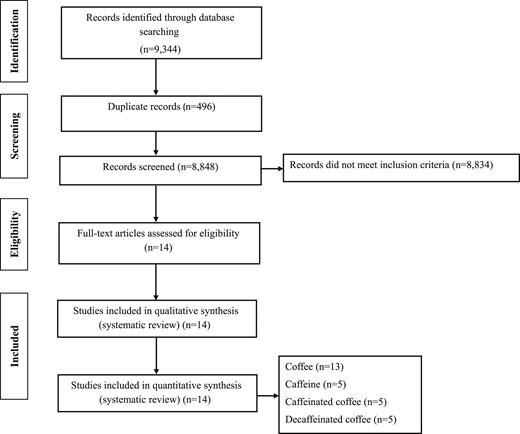
Flowchart of the study selection process.
Data extraction
Two independent reviewers (A.S.M. and A.M.) extracted the data regarding the first author's surname, publication year, country, participant's mean age or age range, sex, follow-up duration, number of cases or cohort size, exposure, outcome, methods used for assessing exposure and outcome, the maximally adjusted ORs, RRs, or HRs with the corresponding 95% CIs, and quality scores (Table 2). Any disagreements between the two reviewers were resolved in consultation with the principal investigator (A.E.).
Main Characteristics of Studies Examining Association Between Caffeine and Type of Coffee Consumption and Risk of Ovarian Cancer
| Investigator | Country | Age Range/Mean Age, y | Follow-Up Duration, y | Cases/Cohort Size, n | Exposure Assessment | Outcome | Outcome Assessment | Comparison | OR, RR, or HR (95% CI) | Quality Score |
|---|---|---|---|---|---|---|---|---|---|---|
| Coffee | ||||||||||
| Lukic et al. (11), 2016 | Norway | 30–70 | 13.1 | 446/91,767 | FFQ | OC | Registries | >7 cups/d vs ≤1 cup/d | HR, 0.87 (0.50–1.51) | 9 |
| Lueth et al. (12), 2008 | USA | 55–69 | 18 | 266/29,060 | FFQ | EOC | Registries | ≥5 cups/d vs 0 cup/d | HR, 1.28 (0.76–2.16) | 9 |
| Braem et al. (13), 2012 | 10 European countriesa | 25–70 | 11.7 | 1244/330,849 | FFQ | EOC | Registries | Q5 vs no intake | HR, 1.05 (0.75–1.46) | 8 |
| Hashibe et al. (14), 2015 | USA | 55–74 | 10 | 162/50,563 | DHQ | OC | Registries | ≥2 cups/d vs < 1 cup/d | RR, 1.17 (0.82–1.67) | 8 |
| Steevens et al. (15), 2007 | Netherlands | 55–69 | 13.3 | 280/2083 | FFQ | EOC | Registries | ≥5 cups/d vs 0 to <1 cup/d | RR, 1.48 (0.82–2.68) | 8 |
| Stensvold et al. (17), 1994 | Norway | 35–54 | 10.1 | 93/21,238 | FFQ | OC | Registries | ≥7 cups/d vs ≤2 cups/d | RR, 2.15 (0.80–5.80) | 6 |
| Jacobsen et al. (18), 1986 | Norway | >20 | 11.5 | 12/2891 | Questionnaire | OC | Registries | ≥7 cups/d vs ≤2 cups/d | RR, 0.77 (0.09–6.60) | 6 |
| Nilsson et al. (19), 2010 | Sweden | 30–60 | 6 | 71/30,639 | FFQ | OC | Registries | ≥4 occasions/d vs <1 occasion/d | HR, 1.41 (0.53–3.74) | 8 |
| Arthur et al. (20), 2018 | Canada | 48–70 | 12.2 | 104/2826 | FFQ | OC | Registries | >3 cups/d vs none | HR, 1.00 (0.54–1.87) | 9 |
| Chang et al. (22), 2007 | USA | <84 | 8.1 | 280/97,275 | FFQ | OC | Registries | Highest vs lowest quintile | RR, 1.02 (0.55–1.90) | 7 |
| Larsson et al., 2005 (23) | Sweden | 40–76 | 15.1 | 301/61,057 | FFQ | OC | Registries | ≥4 cups/d vs <1 cup/d | RR, 1.02 (0.62–1.69) | 8 |
| Silvera et al. (24), 2007 | Canada | 40–59 | 16.4 | 264/48,776 | FFQ | OC | Registries | ≥4 cups/d vs none | HR, 1.62 (0.95–2.75) | 8 |
| Park et al. (25), 2018 | USA | 45–75 | 15.3 | 404/91,082 | FFQ | OC | Registries | ≥4 cups/d vs none | HR, 0.33 (0.17–0.65) | 9 |
| Caffeine | ||||||||||
| Lueth et al. (12), 2008 | USA | 55–69 | 18 | 266/29,060 | FFQ | EOC | Registries | 464–1162 mg/d vs 0–20 mg/d | HR, 1.16 (0.77–1.75) | 9 |
| Hashibe et al. (14), 2015 | USA | 55–74 | 10 | 162/50,563 | DHQ | OC | Registries | >647.25 mg/d vs ≤34 mg/d | RR, 1.25 (0.72–2.15) | 8 |
| Arthur et al. (20), 2018 | Canada | 48–70 | 12.2 | 104/2826 | FFQ | OC | Registries | >319.7 mg/d vs ≤142.1 mg/d | HR, 1.08 (0.74–1.86) | 9 |
| Tworoger et al. (21), 2008 | USA | 30–55 | 24 | 507/80,253 | FFQ | EOC | Registries | >500 mg/d vs ≤136 mg/d | RR, 0.80 (0.60–1.07) | 7 |
| Park et al. (25), 2018 | USA | 45–75 | 15.3 | 404/91,082 | FFQ | OC | Registries | ≥218.8 mg/d vs <28.5 mg/d | HR, 0.57 (0.38–0.84) | 9 |
| Caffeinated coffee | ||||||||||
| Lueth et al. (12), 2008 | USA | 55–69 | 18 | 266/29,060 | FFQ | EOC | Registries | ≥5 cups/d vs 0 cup/d | HR, 1.81 (1.11–2.95) | 9 |
| Braem et al. (13), 2012 | 10 European countriesa | 25–70 | 11.7 | 1244/330,849 | FFQ | EOC | Registries | T3 vs no intake | HR, 1.05 (0.78–1.39) | 8 |
| Arthur et al. (20), 2018 | Canada | 48–70 | 12.2 | 104/2826 | FFQ | OC | Registries | >3 cups/d vs none | HR, 1.41 (0.74–2.67) | 9 |
| Tworoger et al. (21), 2008 | USA | 30–55 | 24 | 507/80,253 | FFQ | EOC | Registries | ≥3 cups/d vs none | RR, 0.75 (0.55–1.02) | 7 |
| Park et al. (25), 2018 | USA | 45–75 | 15.3 | 263/91,082 | FFQ | OC | Registries | ≥4 cups/d vs none | HR, 0.29 (0.11–0.75) | 9 |
| Decaffeinated coffee | ||||||||||
| Lueth et al. (12), 2008 | USA | 55–69 | 18 | 266/29,060 | FFQ | EOC | Registries | ≥5 cups/d vs 0 cup/d | HR, 0.91 (0.37–2.24) | 9 |
| Braem et al. (13), 2012 | 10 European countriesa | 25–70 | 11.7 | 1244/330,849 | FFQ | EOC | Registries | T3 vs no intake | HR, 0.90 (0.61–1.31) | 8 |
| Arthur et al. (20), 2018 | Canada | 48–70 | 12.2 | 104/2826 | FFQ | OC | Registries | >1 cup/d vs none | HR, 0.91 (0.50–1.68) | 9 |
| Tworoger et al. (21), 2008 | USA | 30–55 | 24 | 507/80,253 | FFQ | EOC | Registries | ≥3 cups/d vs none | RR, 0.86 (0.49–1.49) | 7 |
| Park et al. (25), 2018 | USA | 45–75 | 15.3 | 135/91,082 | FFQ | OC | Registries | ≥2 cups/d vs none | HR, 0.48 (0.12–1.87) | 9 |
Abbreviations: DHQ, diet history questionnaire; EOC, epithelial ovarian cancer; FFQ, food frequency questionnaire; OC, ovarian cancer.
Including Denmark, France, Germany, Greece, Italy, Netherland, Norway, Spain, Sweden, and the United Kingdom.
Quality assessment of studies
The quality of the included studies was evaluated using the Newcastle-Ottawa Scale (NOS) (26). Using the NOS method, a maximum score of nine could be awarded to a study. In the present analysis, quality scores greater than six indicated high-quality studies and scores of six or less indicated low-quality studies.
Statistical analysis
All reported ORs, RRs, and HRs and their 95% CIs for the risk of ovarian cancer were used to calculate the log RRs and their SEs. Using a random effects model with consideration of between-study heterogeneity, the overall ES was calculated. Between-study heterogeneity was examined using Cochrane’s Q test and I2. We also performed a linear dose–response meta-analysis per increment of one cup daily of coffee, caffeinated coffee, and decaffeinated coffee intake using generalized least squares trend estimation. A linear dose–response meta-analysis per 100-mg/d increment of caffeine intake was also performed. These methods require the number of cases or person-years and total number of subjects for at least three quantitative exposure categories. The generalized least squares trend estimation also requires a mean intake for each level of the exposure. When the range of coffee, caffeine, caffeinated coffee, and decaffeinated coffee intake was available, rather than mean intake, the midpoint of the upper and lower limits in each category was chosen as the assigned dose. In cases for which the higher category was open-ended, we assumed it to have the same amplitude as the previous category. When the lower limit of the lowest category was open-ended, we considered it to be zero. Next, a two-stage random-effects dose–response meta-analysis was conducted to examine the linear trends between coffee, caffeine, caffeinated coffee, and decaffeinated coffee intake and the risk of ovarian cancer. First, the methods of Greenland and Longnecker (27) and Orsini et al. (28) were used to calculate the correlation within each study. Second, the study-specific estimates were combined using a random-effects meta-analysis.
To examine the nonlinear dose–response relationship between coffee, caffeine, caffeinated coffee, and decaffeinated coffee intake and the risk of ovarian cancer, restricted cubic splines with four knots at 5%, 35%, 65%, and 95% percentiles of the distribution were used (29). A sensitivity analysis was used to explore the extent to which inferences might depend on a particular study or group of studies. Publication bias was assessed by visual inspection of funnel plots. Formal statistical assessment of funnel plot asymmetry was performed using Egger’s regression asymmetry test. Statistical analyses were performed in Stata, version 11.2 (StataCorp). Values of P < 0.05 were considered statistically significant.
Results
Study characteristics
Of 9344 retrieved reports, 14 cohort studies (11–15, 17–21, 22–25) were included in the present systematic review (Table 2). These studies included 940,359 participants aged >20 years. The total number of subjects with ovarian cancer was 4434, varying from 12 to 1244 in the studies. These studies were reported from 1986 to 2018; five were from the United States (12, 14, 21, 22, 25), three from Norway (11, 17, 18), two from Sweden (19, 23), two from Canada (20, 24), one from Europe (13), and one from the Netherlands (15). The median follow-up duration ranged from 6 to 24 years. Of the 14 studies, 13 had examined coffee (11–15, 17–20, 22–25), 5 caffeine (12, 14, 20, 21, 25), 5 caffeinated coffee (12, 13, 20, 21, 25), and 5 decaffeinated coffee (12, 13, 20, 21, 25) as the main exposure. For the exposure assessment, 12 studies had used food frequency questionnaires (11–13, 15, 17, 19–21, 22–25), 1 had collected data on the diet history questionnaire (14), and 1 had used a dietary questionnaire (18). For the outcome assessment, all the included studies had used cancer registries. Based on the NOS, all the included studies were of high quality (Table 2).
Meta-analysis on coffee intake and the risk of ovarian cancer
Nilsson et al. (19) reported coffee intake as occasion per day. Therefore, we considered each occasion per day to be one cup of coffee per day. For the two studies that did not report the 95% CIs (17, 18), the RRs and 95% CIs were calculated using the relevant formulas. Combining 13 ESs from 13 studies (11–15, 17–20, 22–25), we found no statistically significant association between coffee intake and the risk of ovarian cancer (RR, 1.08; 95% CI, 0.89 to 1.33; Fig. 2). We found no statistically significant between-study heterogeneity (I2 = 36.6%; Pheterogeneity = 0.09). A sensitivity analysis showed that no particular study significantly affected the summary effects. In addition, we observed no evidence of publication bias using Egger’s test (P = 0.92).
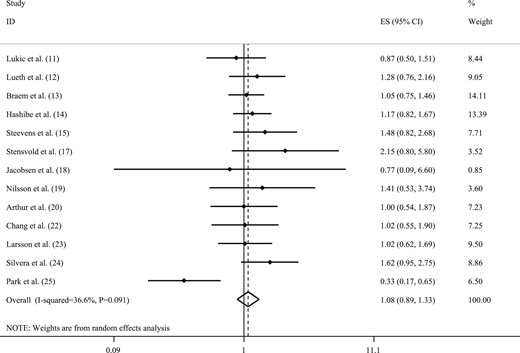
Forest plot of studies that examined the association between coffee intake and the risk of ovarian cancer using a highest vs lowest analysis.
To conduct linear dose–response meta-analysis on coffee intake and the risk of ovarian cancer, one study reported RRs only for the highest vs lowest categories of coffee intake (22). Therefore, that study was excluded from our linear dose–response meta-analysis. One study by Steevens et al. (15) considered the second category as the reference. To conduct the dose–response analyses, the reference category in the study by Steevens et al. (15) was changed to the first category and the RRs were recalculated. Braem et al. (13) reported the mean intake of different types of coffee in 10 European different countries. For that study, we calculated the median intake in each country, and then, combining the median intake across countries, calculated the median intake for the whole population. Finally, assuming each cup of coffee to be equivalent to 8 oz, we calculated the number of cups of coffee consumed per day. Park et al. (25) did not report the number of cases, and Arthur et al. (20) did not report the number of subjects in each category of exposures; therefore, we did not include these studies in our dose–response meta-analysis on either caffeine or different types of coffee consumption and the risk of ovarian cancer. Finally, 10 studies were included in the present linear dose–response meta-analysis (11–15, 17–19, 23, 24). We found that one additional cup per day of coffee consumption was marginally associated with an increased risk of ovarian cancer (RR, 1.02; 95% CI, 0.99 to 1.05; I2 = 0.0%; Pheterogeneity = 0.68). No evidence of a statistically significant nonlinear relationship was observed between coffee intake and the risk of ovarian cancer (Pnonlinearity = 0.06; Fig. 3A).
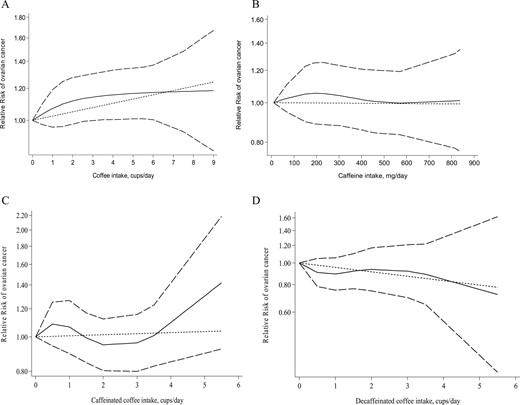
Nonlinear dose–response relationship between (A) coffee intake and the risk of ovarian cancer, (B) caffeine intake and the risk of ovarian cancer, (C) caffeinated coffee intake and the risk of ovarian cancer, and (D) decaffeinated coffee intake and the risk of ovarian cancer.
Meta-analysis on caffeine intake and the risk of ovarian cancer
Five studies examined the association between caffeine intake and the risk of ovarian cancer (12, 14, 20, 21, 25). Combining the five ES, no statistically significant association was observed between caffeine intake and the risk of ovarian cancer (RR, 0.91; 95% CI, 0.69 to 1.19; Fig. 4). The results showed statistically significant between-study heterogeneity (I2 = 56.0%; Pheterogeneity = 0.05). However, owing to the limited number of studies, we did not perform subgroup analyses to find the sources of heterogeneity. We observed no evidence of publication bias (Egger’s test = 0.37).
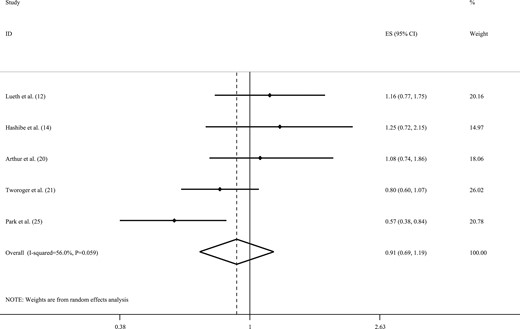
Forest plot of studies that examined associations between caffeine intake and the risk of ovarian cancer using a highest vs lowest analysis.
Three studies were included in the linear dose–response meta-analysis on caffeine intake and the risk of ovarian cancer (12, 14, 21). We found that each additional 100-mg per day of caffeine intake was not associated with the risk of ovarian cancer (RR, 0.99; 95% CI, 0.96 to 1.03; I2 = 40.7%; Pheterogeneity = 0.18). In the nonlinear dose–response meta-analysis, we observed no statistically significant association between caffeine intake and the risk of ovarian cancer (Pnonlinearity = 0.95; Fig. 3B).
Meta-analysis on caffeinated coffee intake and the risk of ovarian cancer
Combining five ESs from five studies (12, 13, 20, 21, 25), we observed no statistically significant association between caffeinated coffee intake and the risk of ovarian cancer (RR, 0.98; 95% CI, 0.65 to 1.49; Fig. 5). However, statistically significant between-study heterogeneity was found (I2 = 75.9%; Pheterogeneity = 0.002). Owing to the limited number of studies, we did not perform subgroup analyses to identify the sources of heterogeneity. In addition, no evidence of a statistically significant publication bias was found (Egger’s test = 0.90).
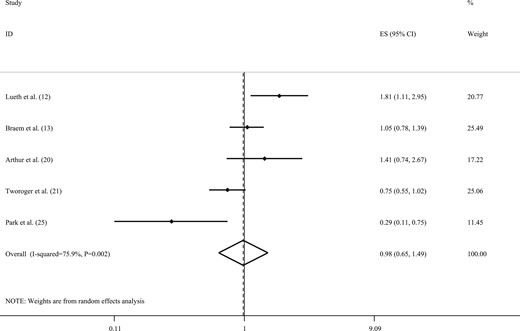
Forest plot of studies that examined the association between caffeinated coffee intake and the risk of ovarian cancer using a highest vs lowest analysis.
Three studies were included in the linear dose–response meta-analysis on caffeinated coffee intake and the risk of ovarian cancer (12, 13, 21). The consumption of one additional cup of caffeinated coffee per day was not associated with the risk of ovarian cancer (RR, 1.00; 95% CI, 0.91 to 1.10; I2 = 62.0%; Pheterogeneity = 0.07). No evidence was found of a nonlinear dose–response relationship between caffeinated coffee intake and the risk of ovarian cancer (Pnonlinearity = 0.80; Fig. 3C).
Meta-analysis on decaffeinated coffee intake and the risk of ovarian cancer
The overall ES from five studies (12, 13, 20, 21, 25) indicated no statistically significant association between decaffeinated coffee intake and the risk of ovarian cancer (RR, 0.87; 95% CI, 0.67 to 1.14; Fig. 6). We also found no evidence of statistically significant between-study heterogeneity (I2 = 0.0%; Pheterogeneity = 0.941) or publication bias (Egger’s test = 0.17).
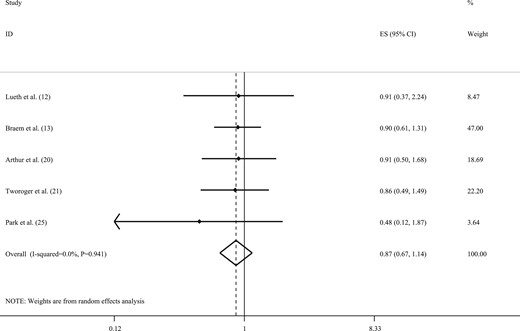
Forest plot of studies that examined the association between decaffeinated coffee intake and the risk of ovarian cancer using a highest vs lowest analysis.
Based on the three studies in the linear dose–response meta-analysis on the association of decaffeinated coffee intake and the risk of ovarian cancer (12, 13, 21), we observed that the consumption of one additional cup of decaffeinated coffee per day was not associated with the risk of ovarian cancer (RR, 0.93; 95% CI, 0.86 to 1.02; I2 = 0.0%; Pheterogeneity = 0.82). In the nonlinear dose–response meta-analysis, no statistically significant association was found between decaffeinated coffee intake and the risk of ovarian cancer (Pnonlinearity = 0.28; Fig. 3D).
Discussion
The findings from the present systematic review and meta-analysis of 13 prospective studies showed no statically significant association between coffee intake and the risk of ovarian cancer. In addition, the consumption of one additional cup of coffee per day was marginally associated with an increased risk of ovarian cancer. We did not observe statistically significant associations between caffeine and different types of coffee consumption and the risk of ovarian cancer.
Ovarian cancer is among the more prevalent cancers in women (1). Among several factors that might influence the risk of ovarian cancer, diet plays an important role. The association between dietary intake and the risk of ovarian cancer has been extensively examined in previous studies. Particular attention has been given to the various types of coffee in relation to the risk of ovarian cancer. In the present study, we conducted a dose–response meta-analysis to summarize the findings from relevant prospective studies. We found no statistically significant association between coffee consumption and the risk of ovarian cancer. Our findings are in agreement with previous studies reporting such associations. A case-control study showed no substantial association between coffee consumption and the risk of ovarian cancer (30). In contrast to our results, two case-control studies found a statistically significant reduction in the risk of ovarian cancer with coffee intake (31, 32). Another case-control study showed that coffee intake might increase the odds of ovarian cancer among premenopausal women (33). However, it must be remembered that case-control studies are susceptible to selection and/or recall bias. Therefore, these findings regarding the association between coffee intake and the risk of ovarian cancer should not be regarded as conclusive. Our meta-analysis was conducted with the inclusion of prospective studies, enhancing the credibility of our findings.
We found no statistically significant association between caffeine intake and the risk of ovarian cancer. This finding is consistent with the results of a population-based study among US women, in whom caffeine intake was not associated with the risk of ovarian cancer (34). In contrast to these findings, some investigators found an inverse association between caffeine intake and the risk of ovarian cancer. In a case-control study, the total caffeine intake was associated with a decreased risk of ovarian cancer (4). In addition, Jordan et al. (32) reported that caffeine intake was inversely associated with the risk of ovarian cancer. Another case-control study revealed increased odds of ovarian cancer with higher intake of caffeine (30). We also observed no statistically significant association between caffeinated and decaffeinated coffee intake and the risk of ovarian cancer. Similarly, a population-based study found no statistically significant association between caffeinated coffee and decaffeinated coffee consumption and the odds of ovarian cancer (34). In contrast to our findings, a hospital-based case-control study showed that individuals who had consumed two or more cups of decaffeinated coffee daily had a lower risk of ovarian cancer (35). However, a limited number of prospective studies have assessed these associations between caffeine, caffeinated and decaffeinated coffee consumption, and the risk of ovarian cancer. Considering the paucity of such studies, further research is required to reach a definitive conclusion.
The reported effects of coffee consumption on health-related outcomes have been inconsistent. Caffeine has been associated with increased blood pressure and insulin resistance (36–38). In the past, coffee was considered an unhealthy beverage because of its caffeine content. However, recent studies have shown that coffee might have beneficial effects on human health owing to its bioactive compounds, which have antioxidant properties. These bioactive compounds have been linked to a decreased risk of cancer (39). It has been reported that the bioactive compounds in coffee might counteract carcinogenesis through several mechanisms. These components improve insulin sensitivity, and prohibit the production of free radicals. In addition, they can suppress the production of inflammatory mediators and aromatase, through which they can help in minimizing oxidative stress and DNA damage (20).
The present study had some strengths and limitations. Our study included 14 cohort studies with 940,359 participants. Such a large sample can provide sufficient power to detect associations between caffeine and different types of coffee consumption with the risk of ovarian cancer. The reported association in the present study resulted from combining the data from prospective studies, minimizing the possibility of recall or selection bias. In addition, we conducted a dose–response meta-analysis, which will provide more accurate results than a highest vs lowest analysis. Despite these strengths, some points should be considered when interpreting our findings. Our meta-analysis on caffeine (n = 5), caffeinated coffee (n = 5), and decaffeinated coffee (n = 5) intake included a relatively small number of studies; therefore, these results must be interpreted with caution. In addition, for most included studies, the exposure variable was assessed using food frequency questionnaires. Therefore, measurement error and misclassification of the study participants in terms of exposure were unavoidable. In addition, the cup size of coffee intake across the studies could have differed, which could have, in turn, influenced the observed association. The calculation of the RRs and their 95% CIs in some studies could have provided other sources of bias in our study. Finally, the present review included studies that had enrolled subjects from different countries with different dietary habits and racial factors, which could be associated with different risks of ovarian cancer.
Conclusion
We observed no statistically significant association between coffee intake and the risk of ovarian cancer. In addition, one additional cup per day of coffee consumption was marginally significantly associated with an increased risk of ovarian cancer. However, no statistically significant associations were observed between caffeine and the different types of coffee consumption with the risk of ovarian cancer.
Acknowledgments
Financial Support: The present study was funded by the Tehran University of Medical Sciences, Tehran, Iran (code no. 97-01-161-38178).
Clinical Trial Information: PROSPERO registration no. CRD42018089073 (registered 20 February 2018).
Author Contributions: A.S.M. contributed to the conception, design, literature search, statistical analyses, interpretation of the data, and drafting of the manuscript. A.M. contributed to the statistical analyses and interpretation of the data. P.J.S. contributed to the manuscript drafting. B.L. contributed to the design, conception, and drafting of the manuscript. A.E. contributed to the conception, design, statistical analyses, interpretation of the data, and drafting of the manuscript. A.E. supervised the study. All the authors approved the final manuscript before submission.
Additional Information
Disclosure Summary: The authors have nothing to disclose.
Data Availability: Data sharing is not applicable to this article as no datasets were generated or analyzed during the current study.
