


Abstract
Cold exposure increases energy expenditure (EE) and could have a role in combating obesity. To understand this potential, we determined the capacity for cold-induced thermogenesis (CIT), the EE increase above the basal metabolic rate at the individualized coldest tolerable temperature before overt shivering.
During a 13-day inpatient protocol, we quantitated the EE of 12 lean men and 9 men with obesity at various randomly ordered ambient temperatures in a room calorimeter. Subjects underwent brown fat imaging after exposure to their coldest tolerable temperature.
CIT capacity was 300 ± 218 kcal/d (mean ± SD) or 17 ± 11% in lean men and 125 ± 146 kcal/d or 6 ± 7% in men with obesity (P = 0.01). The temperature below which EE increased, lower critical temperature (Tlc), was warmer in lean men than men with obesity (22.9 ± 1.2 vs 21.1 ± 1.7°C, P = 0.03), but both had similar skin temperature (Tskin) changes and coldest tolerable temperatures. Whereas lean subjects had higher brown fat activity, skeletal muscle activity increased synchronously with CIT beginning at the Tlc in both groups, indicating that muscle is recruited for CIT in parallel with brown fat, not sequentially after nonshivering thermogenesis is maximal.
Despite greater insulation from fat, men with obesity had a narrower range of tolerable cool temperatures available for increasing EE and less capacity for CIT than lean men, likely as a result of greater basal heat production and similar perception to Tskin cooling. Further study of the reduced CIT capacity in men with obesity may inform treatment opportunities for obesity.
Obesity is the result of long-term energy imbalance, whereby energy intake exceeds energy expenditure (EE). Although there is a major focus on the understanding of energy intake and how to reduce it, there has been less investigation of EE, with most efforts focused on physical activity and how to increase it. EE can also be increased by exposure to a cold environment.
Kleiber (1) and Scholander et al. (2) provided a theoretical model for studying thermal biology by plotting EE vs ambient temperature (Ta). The thermoneutral zone is the range of Ta at which the EE is at its minimum; this is the basal metabolic rate (BMR) when measured in the resting, postabsorptive state. The lower boundary of the thermoneutral zone is the lower critical temperature (Tlc). At the Tlc, heat-conserving mechanisms have been maximized, so at Ta below the Tlc, heat production must be increased to maintain core body temperature (Tcore) to fulfill the “thermostatic heat requirement” (1). The required EE above the BMR is cold-induced thermogenesis (CIT). At Ta below Tlc, CIT increases linearly, and extrapolation of this line to EE = 0 yields the defended Tcore (1, 2). The magnitude of CIT is greater in smaller animals, as a result of larger surface-to-volume ratios, which increase heat loss (3, 4). For instance, in a mouse, CIT can be sustained at as high as four times the BMR (5, 6).
In larger endotherms, such as human adults, CIT is of a smaller magnitude relative to BMR. The reported sustainable CIT ranges widely from 0% to 280% of BMR (7). The higher magnitudes were reported in studies of human cold exposure in extreme environments, such as cold-water immersion (8–10), which causes shivering and stress responses. The lower CIT magnitudes were mainly from studies of physiological regulation of heat loss in humans (11–18).
Body fat provides the thermal insulation necessary for some species to inhabit colder environments (2, 19, 20). Thus, it is assumed that adults with obesity are more protected from cold than are lean adults (21). However, there are limited data that compare the CIT response of lean subjects with obesity (8, 22–24). To investigate this, we studied the effect of typical indoor Ta conditions on whole-body metabolism and additional thermal physiology in lean men and men with obesity. We found that the lean men and men with obesity had similar changes to skin temperature (Tskin) with cooling and similar cold tolerance, but men with obesity had a lower Tlc, likely because of greater basal heat production. Thus, the men with obesity had a narrower range of tolerable cool temperatures for increasing EE and a lower CIT capacity than the lean men.
Methods
Protocol design
To quantitate responses to Ta, healthy men participated in a 13-day inpatient protocol. Fasted subjects stayed in a room calorimeter from 0800 to 1300 hours at a Ta that was different each day (16°C to 31°C), in random order, blinded to the subjects [Fig. 1(a)]. To minimize biological variability in the absence of informative prior research, we studied healthy, young, sedentary white men between the ages of 18 and 35 years with a body mass index (BMI) of 18.5 to 24.9 kg/m2 (lean cohort) and 30.0 to 40.0 kg/m2 (cohort with obesity). Subjects were recruited through ClinicalTrials.gov and attended an initial screening visit at the Hatfield Clinical Research Center, National Institutes of Health, to determine eligibility following a 12-hour fast with ad libitum water intake. After the subjects providing written, informed consent, they underwent standard screening tests, including Chem 20, lipid panel, complete blood count with differential, thyroid-stimulating hormone, ferritin, ECG, and urinalysis. Twelve lean, young men (BMI 23.2 ± 1.9 kg/m2) and nine young men with obesity (BMI 34.4 ± 1.9 kg/m2) completed the study. Subject characteristics are described in Table 1. The study protocol was approved by the Institutional Review Board of the National Institute of Diabetes and Digestive and Kidney Diseases (NIDDK). For further details, see ClinicalTrials.gov (number NCT01568671).
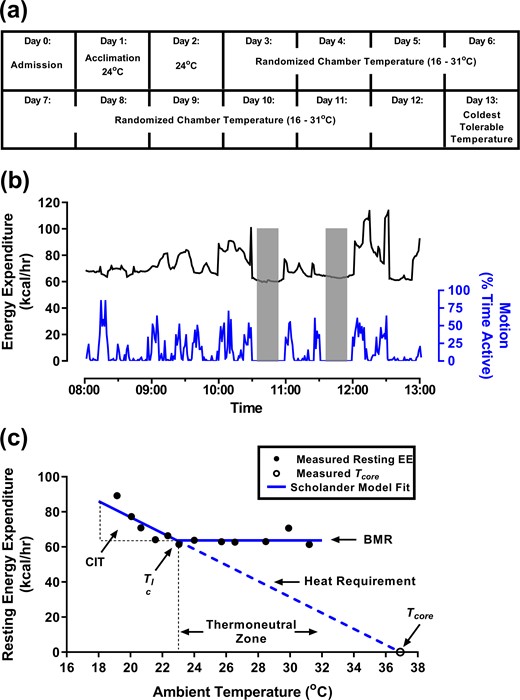
Protocol design outline with an example subject. (a) Study timeline. (b) Representative example of 1 day in the room calorimeter showing EE (black) and motion (blue), including two resting measurement periods (shaded). (c) The Scholander plot is used to determine BMR, CIT, Tlc, and insulation (inverse of the slope of the heat requirement). The set point for Tcore is where the heat requirement line intersects the Ta axis. The thermoneutral zone starts at the Tlc. Data (black circles) obtained from one lean subject and analyzed by branch-chain regression (blue lines) are included as an example.
Subject Characteristics
| Lean | Obese | P | |
|---|---|---|---|
| n | 12 | 9 | |
| Age, years | 22.5 ± 4.9 | 29.4 ± 4.9 | 0.005 |
| Weight, kg | 77.8 ± 8.8 | 113.7 ± 14.7 | <0.001 |
| Height, cm | 183.0 ± 7.0 | 181.8 ± 7.7 | 0.7 |
| BMI, kg/m2 | 23.2 ± 1.9 | 34.4 ± 3.4 | <0.001 |
| Body surface area, m2 | 1.99 ± 0.14 | 2.33 ± 0.19 | <0.001 |
| Lean soft tissue mass, kg | 57.8 ± 6.3 | 65.6 ± 7.5 | 0.02 |
| Fat mass, kg | 16.1 ± 5.4 | 44.2 ± 9.3 | <0.001 |
| Body fat, % | 20.6 ± 5.7 | 38.8 ± 4.5 | <0.001 |
Results are means ± SD. Boldface indicates significant P values.
During the 13-day calorimeter measurements, clothing was standardized to one pair of undershorts, one sleeveless form-fitting cotton shirt, one pair of form-fitting shorts, and one pair of light socks; a combined thermal insulation of 0.36 clo (25). The calorimeter Ta was incremented by ∼1.4°C over the thermal comfort range for healthy individuals with light clothing, 16°C to 31°C (26, 27). The Ta for days 1 and 2 was 24°C to determine reproducibility at standard room temperature. Day 1 was treated as an acclimation day, and data were not used in the final analysis. Remaining Ta was randomly ordered on days 3 to 12. If a subject reported intolerable shivering, then that day’s session was stopped, and Ta of future sessions was modified such that no colder Ta was studied. On day 13, subjects were re-exposed to their coldest tolerable Ta with minimal shivering, or 16°C if no shivering was reported, and underwent imaging for brown adipose tissue (BAT) by 18F-fluorodeoxyglucose (18F-FDG) positron emission tomography (PET) and CT.
In the calorimeter, subjects were asked to remain awake and minimize activity while semireclined in a mesh chair. Two monitored, motionless resting periods (1030 to 1100 hours and 1130 to 1200 hours) were used for the primary analysis [Fig. 1(b)]. Blood pressure was measured before and after each calorimeter study. On day 13, subjects received a 370-mBq dose of 18F-FDG at 1200 hours, remained in the calorimeter until 1300 hours, and were transported to the National Institutes of Health Clinical Center Department of Nuclear Medicine via wheelchair and underwent PET/CT scanning with a Biograph mCT (Siemens Healthcare, GmbH, Erlangen, Germany) by 1330 hours.
When outside the calorimeter, participants were housed in a temperature-controlled (23°C to 25°C) inpatient room and fed a weight maintenance, caffeine-free diet with a macronutrient distribution of 55% carbohydrate, 15% protein, and 30% fat and a caloric content of 1.4 times estimated resting EE (28), adjusted if body weight changes were detected during the study. Each day, they completed 30 minutes of treadmill walking at a constant, self-selected pace outside the calorimeter and were not allowed food from midnight until the conclusion of the calorimeter study at 1300 hours.
Room calorimeters
Air drawn from seven equidistant sample points on the ceiling of the 30,000 L aluminum-lined interior at a constant, mass flowmeter-measured rate of ∼60 L/min (Teledyne Hastings Instruments, Hampton, VA) was passively replaced by a mixture of conditioned outside air and medical-grade air entering from a small opening several inches from the floor. An air-handling unit mixes air in the calorimeter and provides a stable internal temperature (±0.2°C) and relative humidity (30% to 50%), which is continuously monitored (Optica; GE Sensing, Billerica, MA). A small quantity (1 L/min) of effluent and supply airstreams was dried (PD-Series Nafion; Perma Pure, Toms River, NJ) and measured for CO2 (AO2000; ABB Automation Products GmbH, Frankfort, Germany) and O2 (Oxymat 6E; Siemens AG, Munich, Germany) concentration. Two microwave-based sensors (Museum Technology Source, Inc., Wilmington, MA) on the ceiling detected the presence or absence of motion each second. Data from all sensors were recorded each minute (CalRQ; MEI Research, Edina, MN) and used to compute O2 consumption and CO2 production (29) using customized software (Matlab; MathWorks, Natick, MA). EE was computed using the weir equation (30). Gas analyzers were calibrated weekly and between-analyzer differences were corrected before each study. Monthly propane combustion or gas infusion tests demonstrated no substantial differences in the accuracy of the three calorimeters (<1.5% for O2 consumption and CO2 production) when temperature was maintained within 0.2°C. Greater detail can be found in Brychta et al. (29) and Celi et al. (31).
Physiological sensors
Before subjects entered the room calorimeter, they were instrumented with a Holter monitor (Evo recorder; Spacelabs Healthcare, Snoqualmie, WA) to record ECG, wireless surface electromyogram (EMG) electrodes (Trigno; DelSys Inc., Boston, MA), and wireless thermistor probes (iButton; Maxim Inc., Sunnyvale, CA) to record Tskin. The ECG was analyzed for heart-rate variability using power-spectrum analyses of the very low frequency (0.004 to 0.04 Hz), low frequency (0.04 to 0.15 Hz), and high frequency (0.15 to 0.4 Hz) bands (31–33). Raw EMG signals (2000 Hz) were recorded from four muscle groups shown to significantly contribute to whole-body shivering (34–36): right biceps brachii, pectoralis major, rectus femoris muscles, and left upper fibers of the trapezius. EMG contamination was removed with a Butterworth filter (45 to 500 Hz) (37), and root mean squared (RMS) was computed with overlapping 50 ms periods (38) in Matlab. Tskin sensors were attached using surgical tape (Medipore; 3M, St. Paul, MN) on the left deltoid (upper arm), supraclavicular fossae, upper inner arm (underarm), dorsal hand, pectoralis major (chest), anterior thigh (upper leg), and shin (lower leg) and logged temperature each minute. Triaxial accelerometers (ActiGraph GT3X+; ActiGraph LLC, Pensacola, FL), worn on the wrist and hip, recorded physical activity, quantified as 1-second, three-dimensional vector magnitude of manufacturer-specific activity counts (ActiLife version 6.12.0; ActiGraph LLC) and hip-step count. Tcore was measured every 30 minutes with a hand-held infrared tympanic thermometer (PRO4000; Braun, Melsungen, Germany) by participants after staff training. Tympanic measurement was chosen to minimize subject burden, as it closely approximates nasopharyngeal temperature (39) and is well correlated with rectal temperature (9).
Data from the room calorimeter were time aligned with all physiological sensors during postprocessing. Data from the 20 consecutive minutes of the lowest microwave-detected activity for each rest period (1030 to 1100 hours and 1130 to 1200 hours) were averaged for primary analysis. Data from 0830 to 1230 hours were used for the total study.
BAT
Using the PET/CT Viewer plugin (40) for ImageJ (41), trained technicians created regions of interest on each axial slice of the coregistered PET/CT images from the C3 to the L3 vertebrae, carefully avoiding regions that were not metabolically active fat to minimize false-positive detections. Voxels in the regions of interest with a CT density of −300 to −10 Hounsfield units and PET standardized uptake value (SUV) above 1.2 g/mL/lean soft-tissue mass (42) were used to compute BAT volume, activity, SUVmean, and SUVmax. Greater detail is reported in Leitner et al. (43).
Self-reported shivering and hunger
Volunteers rated shivering and hunger level using an electronic visual analog scale from 0 to 100, administered on an iPAD (Apple, Cupertino, CA) at 0800, 0900, and 1200 hours. Results of the 1200-hours self-assessment are reported in this manuscript.
Body composition assessment
Weight (Scale-Tronix 5702 digital balance; Welch Allyn, Carol Stream, IL) and height (242 stadiometer; Seca, Hanover, MD) were taken before and after each calorimeter study. Body composition, including body fat mass, lean soft-tissue mass, and fat percentage, was measured by dual-energy X-ray absorptiometry (iDXA scanner with Encore 11.10 software; GE Healthcare, Madison, WI).
Statistical analysis
Statistical analyses were performed using R software, version 3.1.2 (www.r-project.org) and Prism version 7.04 (GraphPad, La Jolla, CA). All data are presented as means ± SD. Nonparametric Spearmen regression was used to determine the presence of associations between single-point measurements. Linear mixed-effect models were used to analyze repeated measures separately for lean and obese groups. The conditional coefficient of determination (R2) reflects the proportion of the variance explained by both fixed and random effects, and the marginal coefficient of determination () describes the proportion of the variance explained by the fixed effects alone. Differences between lean and obese groups were assessed using nonparametric Wilcoxon signed-rank tests for single-point measurements and linear mixed-effect models with post hoc analysis for repeated measures or where covariates were incorporated. The number of subjects was informed by data from a prior study where a 6.0 ± 4.4% was measured in 25 participants (men and women, BMI 23.2 ± 2.2 kg/m2) wearing hospital scrubs (∼0.7 clo) during 12 hours in 19°C vs 24°C (31). For analyses of exploratory outcomes, we adjusted for multiple comparisons using the Bonferroni method.
Results
Quantification of the increase in resting EE with environmental cooling
Preliminary analyses demonstrated no difference in EE between the two resting periods, so the average was used. Resting EE was plotted vs Ta for each individual, and branched regression was used to fit the data with the two lines of the Scholander plot, which will be referred to as the BMR line and the heat-requirement line [Fig. 1(c) and Fig. 2(a) and 2(b)]. The measured Tcore for each subject was used to anchor the heat-requirement line (1, 2, 22). The BMRs were higher in the group with obesity, as expected from body size and composition (44) (Table 2).
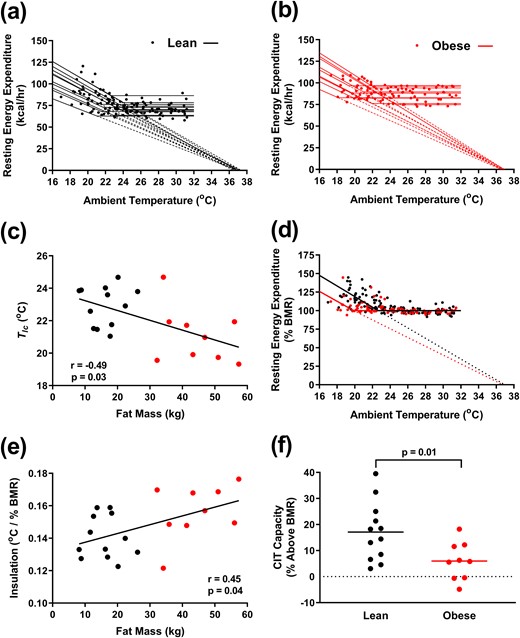
Analysis of resting EE vs Ta. (a and b) Resting EE as a function of Ta with individual Scholander model fits for (a) 12 lean men (black) and (b) 9 men with obesity (red). (c) Tlc inversely correlates with fat mass. (d) Resting EE normalized to BMR as a function of Ta. (e) Insulation positively correlates with fat mass. (f) CIT capacity, the resting EE at the coldest tolerable temperature, is greater in lean men than men with obesity.
Parameters From Scholander Analysis
| Lean | Obese | P | |
|---|---|---|---|
| BMR, kcal/h | 72.0 ± 6.5 | 86.3 ± 8.7 | <0.001 |
| BMR, kcal/h/m2 | 36.1 ± 2.9 | 37.0 ± 2.1 | 0.5 |
| Tlc, °C | 22.9 ± 1.2 | 21.1 ± 1.7 | 0.03 |
| Insulation, °C/kcal/h | 0.20 ± 0.03 | 0.18 ± 0.02 | 0.3 |
| Insulation, °C /% BMR | 0.14 ± 0.01 | 0.16 ± 0.02 | 0.04 |
| Insulation, °C/kcal/h/m2 | 0.39 ± 0.04 | 0.42 ± 0.06 | 0.3 |
Results are means ± SD. Boldface indicates significant P values.
The lean men had a higher Tlc than the men with obesity (22.9 ± 1.2°C vs 21.1 ± 1.7°C, P = 0.03; Table 2), and Tlc was inversely correlated to fat mass [Fig. 2(c)]. Thus, lean men increase their EE at warmer Ta than do men with obesity.
The slope of the heat-requirement line is the heat conductance, and the inverse of the slope is the insulation (1). We plotted resting EE normalized to BMR vs Ta to compare insulation between lean subjects and subjects with obesity (2) [Fig. 2(d)]. The insulation was lower in lean men (Table 2); directly related to total fat mass [Fig. 2(e)], percent fat, and body volume; and inversely related to the surface-to-volume ratio (not shown). These data indicate that men with obesity have more insulation than lean men.
To examine if lean men and men with obesity have different cold tolerance, we measured the coldest Ta before subjects reported being uncomfortable from shivering. This “coldest tolerable Ta” was similar in the lean subjects and subjects with obesity (21.2 ± 1.5 vs 20.3 ± 1.6°C, respectively, P = 0.20; Table 3). Thus, despite more insulation, the men with obesity did not report tolerating significantly cooler Ta.
Comparison of Lean Men and Men With Obesity at Individualized Coldest Tolerable Ta
| Lean | Obese | P | |
|---|---|---|---|
| Coldest tolerable Ta, °C | 21.2 ± 1.5 | 20.3 ± 1.6 | 0.2 |
| REE, kcal/h | 84.5 ± 13.4 | 91.9 ± 11.3 | 0.2 |
| CIT (REE at coldest tolerable Ta − BMR), kcal/h | 12.5 ± 9.1 | 5.2 ± 6.1 | 0.04 |
| REE, % BMR | 117.1 ± 11.2 | 106.0 ± 7.3 | 0.01 |
| REE/BSA, kcal/h/m2 | 42.3 ± 5.6 | 39.2 ± 3.8 | 0.2 |
| Respiratory quotient | 0.89 ± 0.04 | 0.83 ± 0.04 | 0.001 |
| Core temperature, °C | 36.4 ± 0.4 | 36.4 ± 0.5 | 0.8 |
| Mean Tskin, °C | 29.9 ± 0.8 | 29.4 ± 0.9 | 0.2 |
| Average EMG activity, μV | 3.9 ± 2.0 | 2.1 ± 0.4 | 0.01 |
| Self-reported shivering, % | 41.4 ± 36.3 | 49.7 ± 28.2 | 0.6 |
| Heart rate, beats/min | 59.6 ± 6.3 | 64.6 ± 9.5 | 0.1 |
| BAT volume, mL | 334 ± 188 | 143 ± 138 | 0.01 |
| BAT activity, mL ⋅ g/mL | 1890 ± 1277 | 651 ± 681 | 0.01 |
| BAT SUVmean, g/mL | 4.9 ± 1.6 | 4.0 ± 1.0 | 0.1 |
| BAT SUVmax, g/mL | 54.7 ± 27.6 | 26.7 ± 18.5 | 0.01 |
Results are means ± SD. Boldface indicates significant P values.
Abbreviation: REE, resting EE.
The respiratory quotient, the ratio of CO2 produced to O2 consumed, reflects fuel type. At cooler Ta, both lean subjects and subjects with obesity showed trends toward a lower resting respiratory quotient, indicating greater relative fat oxidation (Table 4). At the coldest tolerable temperature, subjects with obesity had a lower respiratory quotient than lean subjects (P = 0.001; Table 3).
Results of Mixed-Effects Model Analysis
| Lean | Obese | Lean Vs Obese | |||||||
|---|---|---|---|---|---|---|---|---|---|
| β ± SE | R2 | P | β ± SE | R2 | P | P | |||
| Room calorimeter | |||||||||
| Resting EE vs Ta | −1.51 ± 0.15 | 0.24 | 0.69 | <0.001 | −0.72 ± 0.12 | 0.09 | 0.75 | <0.001 | <0.001 |
| Resting EE vs average EMG | 3.31 ± 0.34 | 0.32 | 0.68 | <0.001 | 8.04 ± 0.97 | 0.19 | 0.81 | <0.001 | <0.001 |
| Total EEa vs Ta | −1.87 ± 0.13 | 0.27 | 0.84 | <0.001 | −1.44 ± 0.15 | 0.16 | 0.82 | <0.001 | <0.001 |
| Total EEa vs micro acta | 1.73 ± 0.29 | 0.31 | 0.58 | <0.001 | 1.09 ± 0.19 | 0.29 | 0.80 | <0.001 | <0.001 |
| Total EEa vs hip acta | 0.11 ± 0.03 | 0.14 | 0.54 | <0.001 | 0.13 ± 0.02 | 0.20 | 0.80 | <0.001 | <0.001 |
| Total EEa vs wrist acta | 0.005 ± 0.004 | 0.01 | 0.56 | 0.21 | 0.016 ± 0.003 | 0.14 | 0.73 | <0.001 | <0.001 |
| Resting RQ vs Ta | 0.003 ± 0.001 | 0.07 | 0.58 | <0.001 | 0.001 ± 0.001 | 0.01 | 0.77 | 0.07 | <0.001 |
| Total RQa vs Ta | 0.003 ± 0.001 | 0.09 | 0.73 | <0.001 | 0.001 ± 0.001 | 0.01 | 0.92 | 0.007 | <0.001 |
| Physical activity | |||||||||
| Micro acta vs Ta | −0.07 ± 0.05 | 0.004 | 0.73 | 0.16 | −0.20 ± 0.09 | 0.01 | 0.82 | 0.03 | 0.02 |
| Hip acta vs Ta | −0.56 ± 0.60 | 0.002 | 0.63 | 0.35 | −3.58 ± 0.91 | 0.07 | 0.55 | <0.001 | 0.48 |
| Wrist acta vs Ta | −1.24 ± 4.86 | 0.000 | 0.65 | 0.80 | −22.13 ± 6.65 | 0.07 | 0.35 | 0.001 | 0.04 |
| Stepsa vs Ta | −0.003 ± 0.003 | 0.003 | 0.59 | 0.34 | −0.019 ± 0.005 | 0.07 | 0.51 | <0.001 | 0.01 |
| Hunger | |||||||||
| Hungerb vs Ta | 0.38 ± 0.32 | 0.16 | 0.58 | 0.23 | 0.64 ± 0.43 | 0.17 | 0.70 | 0.15 | 0.003 |
| Muscle activity and shivering | |||||||||
| Pectoralis EMG vs Ta | −0.40 ± 0.08 | 0.10 | 0.20 | <0.001 | −0.10 ± 0.02 | 0.01 | 0.24 | <0.001 | 0.09 |
| Trapezius EMG vs Ta | −0.38 ± 0.06 | 0.10 | 0.48 | <0.001 | −0.07 ± 0.02 | 0.15 | 0.25 | <0.001 | 0.07 |
| Biceps EMG vs Ta | −0.09 ± 0.02 | 0.08 | 0.33 | <0.001 | −0.02 ± 0.01 | 0.03 | 0.27 | 0.21 | 0.03 |
| Femoris EMG vs Ta | −0.09 ± 0.02 | 0.20 | 0.27 | <0.001 | −0.03 ± 0.02 | 0.09 | 0.34 | 0.04 | <0.001 |
| Average EMG vs Ta | −0.24 ± 0.03 | 0.21 | 0.45 | <0.001 | −0.06 ± 0.01 | 0.18 | 0.37 | <0.001 | 0.003 |
| Average EMG vs shiver | 0.03 ± 0.00 | 0.21 | 0.52 | <0.001 | 0.01 ± 0.00 | 0.21 | 0.35 | <0.001 | 0.01 |
| Shiver vs Ta | −5.41 ± 0.53 | 0.38 | 0.55 | <0.001 | −4.80 ± 0.51 | 0.44 | 0.48 | <0.001 | 0.77 |
| Skin and core temperatures | |||||||||
| Tcore vs Ta | 0.07 ± 0.01 | 0.37 | 0.73 | <0.001 | 0.03 ± 0.01 | 0.11 | 0.59 | <0.001 | 0.42 |
| Chest Tsk vs Ta | 0.26 ± 0.01 | 0.77 | 0.92 | <0.001 | 0.38 ± 0.01 | 0.83 | 0.90 | <0.001 | <0.001 |
| Upper arm Tsk vs Ta | 0.59 ± 0.01 | 0.93 | 0.95 | <0.001 | 0.55 ± 0.01 | 0.90 | 0.94 | <0.001 | 0.02 |
| Upper leg Tsk vs Ta | 0.49 ± 0.01 | 0.83 | 0.95 | <0.001 | 0.55 ± 0.02 | 0.83 | 0.92 | <0.001 | 0.14 |
| Hand Tsk vs Ta | 1.01 ± 0.03 | 0.86 | 0.92 | <0.001 | 0.90 ± 0.02 | 0.90 | 0.93 | <0.001 | <0.001 |
| Lower leg Tsk vs Ta | 0.61 ± 0.01 | 0.92 | 0.95 | <0.001 | 0.49 ± 0.02 | 0.76 | 0.88 | <0.001 | <0.001 |
| Supraclavicular Tsk vs Ta | 0.13 ± 0.01 | 0.56 | 0.86 | <0.001 | 0.19 ± 0.01 | 0.57 | 0.87 | <0.001 | <0.001 |
| Underarm Tsk vs Ta | 0.31 ± 0.02 | 0.50 | 0.80 | <0.001 | 0.18 ± 0.02 | 0.36 | 0.58 | <0.001 | <0.001 |
| Mean Tsk vs Ta | 0.48 ± 0.01 | 0.96 | 0.98 | <0.001 | 0.49 ± 0.01 | 0.93 | 0.97 | <0.001 | 0.67 |
| Tcore − mean Tsk vs Ta | −0.40 ± 0.01 | 0.91 | 0.95 | <0.001 | −0.46 ± 0.01 | 0.89 | 0.95 | <0.001 | 0.39 |
| Upper arm − hand Tsk vs Ta | −0.43 ± 0.03 | 0.57 | 0.73 | <0.001 | −0.35 ± 0.02 | 0.60 | 0.70 | <0.001 | <0.001 |
| Cardiovascular measures | |||||||||
| Heart rate vs Ta | 1.19 ± 0.09 | 0.28 | 0.79 | <0.001 | 0.67 ± 0.11 | 0.05 | 0.88 | <0.001 | 0.06 |
| VLF power vs Ta | −457 ± 64.17 | 0.07 | 0.81 | <0.001 | −335 ± 63.76 | 0.08 | 0.73 | <0.001 | 0.53 |
| LF power vs Ta | −123 ± 20.14 | 0.09 | 0.68 | <0.001 | −124 ± 19.86 | 0.09 | 0.78 | <0.001 | 0.96 |
| HF power vs Ta | −71 ± 8.55 | 0.17 | 0.68 | <0.001 | −98 ± 19.99 | 0.04 | 0.86 | <0.001 | 0.42 |
| LF/HF vs Ta | 0.15 ± 0.02 | 0.14 | 0.76 | <0.001 | 0.08 ± 0.02 | 0.02 | 0.84 | 0.001 | 0.68 |
| Total power vs Ta | −652 ± 85.72 | 0.10 | 0.79 | <0.001 | −557 ± 90.66 | 0.09 | 0.79 | <0.001 | 0.75 |
| Diastolic BPb vs Ta | −0.32 ± 0.14 | 0.01 | 0.69 | 0.02 | −0.12 ± 0.17 | 0.10 | 0.31 | 0.47 | 0.30 |
| Systolic BPb vs Ta | −0.47 ± 0.16 | 0.03 | 0.64 | 0.004 | −0.01 ± 0.18 | 0.03 | 0.39 | 0.94 | 0.69 |
Abbreviations: BP, blood pressure; HF, high frequency; hip act, hip accelerometer activity; LF, low frequency; LF:HF, LF to HF ratio; micro act, microwave activity; RQ, respiratory quotient; Tsk, Tskin; VLF, very low frequency; wrist act, wrist accelerometer activity.
Average from 0830 to 1230 hours; all other values are averaged from motionless periods (1030 to 1100 hours and 1130 to 1200 hours). Boldface indicates significant P values.
Controlling for pretest values.
We defined the capacity for CIT as the increase in resting EE above the BMR at the coldest tolerable Ta. In lean men, the CIT capacity was 300 ± 218 kcal/d or 17.1 ± 11.2% (range 3.1% to 39.5%) above their BMR. In contrast, the CIT capacity in the men with obesity was substantially lower at 6.0% ± 7.3% [range −4.8 to 18.2%, P = 0.01 vs lean men; Fig. 2(f)], corresponding to 125 ±146 kcal/d (P = 0.04 vs lean men; Table 3). These results suggest that men with obesity have less capacity for CIT.
Effect of environmental cooling on core and Tskin
Whereas Tcore changed minimally with changes in Ta [Fig. 3(a)], Tskin tracked linearly with Ta, with distal sites having greater dynamic range [Fig. 3(b)–3(f) and Table 4]. For example, in lean men, hand Tskin changed 1.01 ± 0.03°C per degree Celsius of Ta, whereas supraclavicular Tskin changed only 0.13 ± 0.01°C per degree Celsius of Ta. In the men with obesity at cooler Ta, distal sites (hand, lower leg) were relatively warmer, and proximal sites (chest, supraclavicular) were relatively cooler than in lean men [Fig. 3(b)–(f) and Table 4]. Despite the regional Tskin differences, the weighted mean Tskin (45) varied similarly with Ta in both the lean group and the group with obesity [Fig. 3(g) and Table 4].
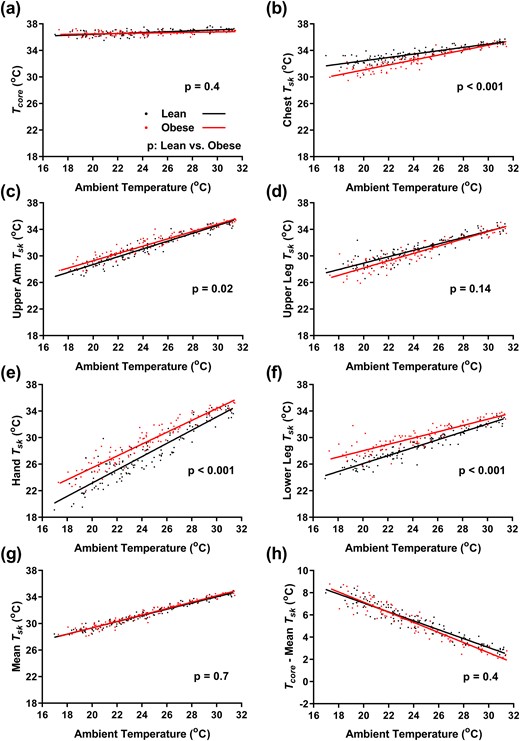
Effect of Ta on core and Tskin. Linear regression of the indicated temperatures of lean men (black, n = 12) and men with obesity (red, n = 9) as a function of Ta. (a) Tcore and Tskin (Tsk) of the (b) chest, (c) upper arm, (d) upper leg, (e) hand, (f) lower leg, and (g) weighted mean. (h) Gradient from the core to skin. P values are results of mixed-effects model post hoc tests for differences between lean men and men with obesity.
In contrast to the EE-vs-Ta relationship, none of the Tskin-vs-Ta lines changed slope at the Tlc. The slope of the Tcore − Tskin gradient with Ta was similar in the lean group and the group with obesity [−0.40 ± 0.01°C per degree Celsius of Ta in lean men vs −0.46 ± 0.01°C per degree Celsius of Ta in men with obesity, P = 0.4; Fig 3(h) and Table 4]. Thus, whereas Tcore was tightly defended, Tskin depended on Ta, with proximal sites staying warmer than distal. The lower chest and higher distal Tskin in the men with obesity may indicate a shift toward greater peripheral heat loss as a result of greater trunk insulation from adipose tissue.
Muscle electrical activity and self-reported shivering
To investigate the role of nonvoluntary muscle activity in CIT, we measured surface EMG. The more proximal muscles (pectoralis, trapezius) increased EMG activity at relatively warmer Ta and with greater magnitudes compared with more peripheral muscles [rectus femoris, biceps brachii; Fig. 4(a)–4(d)]. The average EMG activity increased at cooler Ta and was more pronounced in the lean cohort than the cohort with obesity [Fig. 5(a) and Table 4].
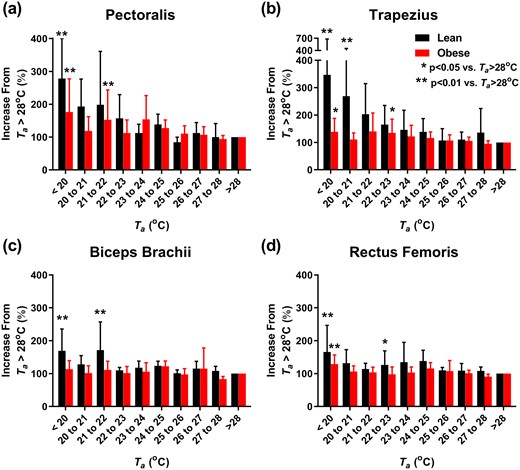
Individual muscle response to Ta. (a–d) Nonvoluntary muscle activity, as quantitated by the RMS surface EMG during motionless periods at the indicated Ta and expressed as a percentage of average EMG activity at Ta > 28°C. Muscle groups are the following: (a) pectoralis major, (b) trapezius, (c) biceps brachii, and (d) rectus femoris. Lean subjects (n = 12) in black; subjects with obesity (n = 9) in red. Significant differences from Ta > 28°C are indicated for *P < 0.05 and **P < 0.01.
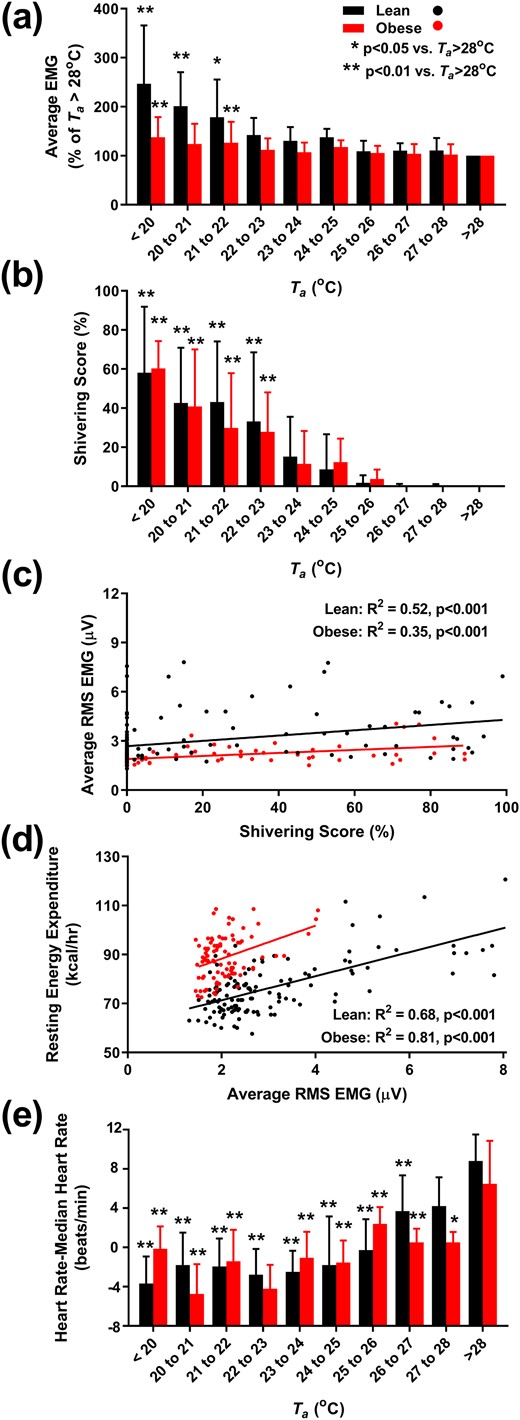
Muscle and heart rate response to Ta. (a) Nonvoluntary muscle activity, as quantitated by the RMS surface EMG, averaged from four muscle groups (pectoralis major, trapezius, biceps brachii, and rectus femoris) during motionless periods at the indicated Ta and expressed as a percentage of average EMG activity at Ta > 28°C. (b) Dependence of self-reported shivering on Ta, measured after 4 hours of exposure. (c) Positive correlation between average EMG activity and shivering score. (d) Positive correlation between EMG activity and resting EE. (e) Resting heart rate (expressed as change from individual median heart rate) is higher at warmer Ta. Lean subjects (n = 12) in black; subjects with obesity (n = 9) in red. (a, b, and e) Significant differences from Ta > 28°C are indicated for *P < 0.05 and **P < 0.01. (c and d) R2 and P values are results of mixed-effects models with subject identifier as the random effect.
Self-reported perception of shivering was measured using a visual analog scale. In both the lean subjects and the subjects with obesity, shivering was reported at Ta warmer than those where EMG activity first increased [Fig. 5(b)]. The subjective shivering score and the average EMG increase were positively correlated [R2 = 0.52 for lean men, and R2 = 0.35 for men with obesity, both P < 0.001; Fig. 5(c)].
To explore the contribution of muscle activity to CIT, we examined the relationship between EMG activity and resting EE. In the lean men, EE increased 3.31 ± 0.34 kcal/h/µV (R2 = 0.68, P < 0.001) and in the men with obesity, 8.04 ± 0.97 kcal/h/µV [R2 = 0.81, P < 0.001; Fig. 5(d) and Table 4]. These data suggest that there is a graded increase in muscle activity with increasing cold exposure.
Heart rate and variability
At cooler Ta, vascular resistance increases, reflexively causing a reduced heart rate. In both lean subjects and subjects with obesity, resting heart rate decreased with Ta to a minimum near 23°C to 24°C [Fig. 5(e)]. Below ∼24°C, the group mean heart rate was approximately constant, albeit with considerable individual variability.
Heart rate variability provides information on autonomic regulatory mechanisms (46). All components of the power spectra were higher at cooler Ta, consistent with increased cardiac input from both autonomic branches (Table 4). The low/high frequency ratio was lower at cooler Ta, suggesting a greater contribution from parasympathetic tone in the cold.
Hunger
Hunger was assessed by visual analog scale before and during the calorimeter measurement period each day. The hunger perception scores increased from 0800 to 1200 hours (P < 0.01 for both groups), but neither lean subjects nor subjects with obesity demonstrated increased hunger at cooler Ta (Table 4).
BAT
BAT activity was measured at the coldest tolerable temperature using 18F-FDG PET/CT (42, 43). The lean men had higher BAT activity than the men with obesity [1890 ± 1277 mL ⋅ SUVmean ⋅ g/mL vs 651 ± 681 mL ⋅ SUVmean ⋅ g/mL, P = 0.03; Fig. 6(a) and Table 3]. There was no significant correlation among BAT activity and CIT capacity, coldest tolerable Ta, insulation [Fig. 6(b)–6(d)], Tlc, EMG activity, reported shivering, Tskin, coldest tolerable Ta, or Tcore (not shown).
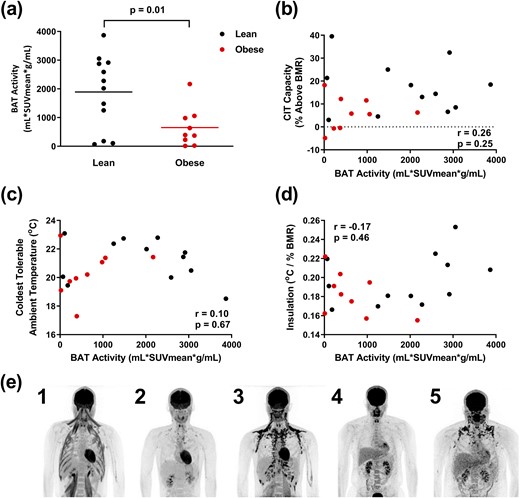
BAT activity measurement by 18F-FDG PET/CT. (a) BAT activity is greater in lean subjects (black, n = 12) than subjects with obesity (red, n = 9). (b–d) BAT activity is not correlated with (b) capacity of CIT, (c) coldest tolerable temperature, or (d) insulation. (e) Examples of PET/CT scans demonstrating variable 18F-FDG uptake by BAT and skeletal muscle in lean subjects (1–3) and subjects with obesity (4 and 5). In subject 1, note the lack of BAT 18F-FDG uptake despite 18F-FDG signal in muscle, indicative of shivering.
The subjects were not prescreened for detectable BAT. The absence of detectable BAT activity in some subjects was not a result of inadequate cold exposure. For example, one subject without detectable BAT had 18F-FDG uptake into the sternocleidomastoid, psoas, and intercostal muscles [Fig. 6(e), subject 1], indicative of shivering. These results suggest that the proportion of CIT that is contributed by BAT varies among the subjects.
Discussion
We found that lean men can increase metabolic rate by a substantial amount (17% above BMR; 300 kcal/day) in response to cold before overt shivering. Men with obesity, whereas having greater insulation, suffer from a physiological “trap”: their coldest tolerable temperature was similar to lean men, but their bodies did not initiate additional thermogenesis until reaching a lower temperature. In both lean men and men with obesity, thermogenesis from BAT and skeletal muscle contraction was recruited in parallel, not sequentially, and variably contributed to CIT.
Induction and capacity for CIT
We quantified the “capacity” for CIT by measuring EE in Ta that resemble indoor living conditions (47, 48). The magnitudes of increase in resting EE in men with obesity and lean men are clinically meaningful and compare favorably to pharmacologic agents, which typically increase EE by 3% to 10% (49–52). Prior studies of lean men under these conditions, including some that allowed shivering, have reported smaller increases (median 5.5%, range 0% to 14%) (7). Possible reasons for the larger CIT capacity observed here include identification of an individually optimized coldest tolerable Ta to capture the full effect, rigid enforcement of resting during the measurement periods, and avoidance of the thermic effect of food.
The CIT capacity of the men with obesity (6% above BMR; 125 kcal/day) was markedly lower than that of the lean men. Others have also reported that men with overweight and obese BMIs tended to have less CIT (8, 22, 24), with one exception (23). There are several potential contributors to the reduced CIT capacity in the men with obesity. First, the subjects with obesity started to increase their EE at lower Ta (i.e., a lower Tlc), perhaps as a result of their higher basal heat production (22). Second, subjects with obesity had greater insulation (i.e., a lower heat requirement slope) than lean subjects. This indicates that the greater adiposity in men with obesity allows proportionally greater retention of heat produced compared with lean men. Finally, despite a lower Tlc and greater insulation, men with obesity did not have a lower coldest tolerable temperature. With the consideration of the similar changes in mean Tskin and a self-reported shivering pattern with Ta for lean subjects and subjects with obesity, cold tolerance may be the result of the surface Tskin reaching a cold sensitivity threshold despite greater subcutaneous fat, which insulates deeper tissues. Together, these findings suggest men with obesity have a narrower range of tolerable cool temperatures available for increasing EE.
Clinical significance
If the CIT observed in lean men can be maintained chronically, then it could be beneficial for the prevention of obesity. The lower CIT capacity in men with obesity suggests that mild cold exposure might be less effective for treating obesity acutely. However, repeated exposure to cold can increase CIT and BAT activity in men who are overweight with type 2 diabetes (53) and metabolically healthy men with obesity (54), suggesting that this question requires further investigation.
BAT and muscle contribute to CIT
Whereas BAT is a major thermogenic source for CIT in small mammals, the amount of BAT and its contribution to CIT in adult humans are unclear (55). Acute exposure to tolerable cold can activate ∼300 mL BAT in healthy lean men (43), and chronic cold can increase its volume (56) and oxidative capacity (57).
It has been proposed that CIT begins with BAT activation, which is followed in sequence by shivering, once BAT is maximally activated (58, 59). However, we detected the onset of involuntary EMG activity near the Tlc, coupled with increased intensity and additional muscle recruitment at cooler Ta. The presumption that BAT activation begins at the Tlc suggests that CIT occurs via parallel, graded responses to cold by both BAT and skeletal muscle.
Some subjects have robust CIT, despite not having detectable BAT. Consistent with this, and in contrast to other studies (36, 60–62), BAT glucose uptake did not correlate with CIT. In these subjects, the thermogenesis may be a result of unmeasured BAT, muscle (contractile or noncontractile) (63), or possibly other thermogenic mechanisms.
Vasoconstriction as an insulator
In addition to the insulation from subcutaneous fat, vasoconstriction can reduce heat loss. The difference between Tcore and weighted mean Tskin (23, 64, 65) or proximal and distal Tskin (23, 66) has been used as an indicator of vasoconstriction. However, the difference between Tcore and mean Tskin is a linear function of Ta, without a slope change at Tlc. As vasoconstriction is hypothesized to reach a maximum at the Tlc, the Tcore − Tskin gradient, whereas a correlate of vasoconstriction, likely measures additional physiological processes.
Vasoconstriction increases blood pressure and produces a reflex reduction in heart rate. The decreasing heart rate with increasing EE during cold exposure contrasts with the response to exercise, where increasing heart rate predicts increasing EE (67). Thus, the effect of cold on the heart rate–EE relationship should be incorporated into algorithms using heart rate to predict metabolic demand.
Study limitations
We have undertaken a careful investigation of CIT in a small sample of young, white men. The conclusions would be expanded by examination of women, diverse populations, and older subjects. Likewise, a larger sample would provide greater support for our findings. To limit radiation exposure, BAT was measured at only one Ta. The direct measurement of BAT amount and activity at multiple Ta would strengthen the results but is not possible with the current methodology. Lastly, we studied EE only under fasted conditions, which limited the assessment of compensatory increases in food intake that accompany increases in EE (68, 69). The understanding of the coupling of CIT, BAT activation, and food intake will be important to discern the use of cold exposure for the prevention and/or treatment of obesity.
Conclusion
Lean men have a robust CIT capacity (17% of BMR). In contrast, men with obesity have a CIT capacity of only 6% of BMR, as a result of the combination of a similar cold tolerance but with cooler threshold for inducing CIT. CIT is generated in both BAT and muscle, likely with parallel induction. To treat obesity rationally, it will be important to understand the causes of the reduced induction of CIT in men with obesity.
Acknowledgments
The authors thank Peter Herscovitch, William Dieckmann, and Corina Millo of the Department of Positron Emission Tomography in the National Institutes of Health Clinical Center for administering PET/CT scans. We also thank Ranganath Muniyappa [staff clinician, National Institute of Diabetes and Digestive and Kidney Diseases (NIDDK)], Monica Skarulis (former staff clinician, NIDDK), Laura Musse (former research nurse, NIDDK), and the nursing staff and dietetic technicians of the Clinical Metabolic Research Unit at the National Institutes of Health Clinical Center for their contributions to patient care. Finally, we thank the participants for their involvement in the study.
Financial Support: This work was supported by the Intramural Research Program of the National Institute of Diabetes and Digestive and Kidney Diseases [Grants Z01 DK071014 (to K.Y.C.) and DK075116 (to A.M.C.)]. J.W. was supported by Beijing Sports University (Beijing China), and S.H. was supported by Fudan University (Shanghai, China) during predoctoral work. Both J.W. and S.H. also received fellowships from the China Scholarship Council.
Clinical Trial Information: ClinicalTrials.gov no. NCT01568671 (registered 2 April 2012).
Author Contributions: Conceptualization was done by K.Y.C. and M.L.R. Methodology was performed by R.J.B., A.M.C., and K.Y.C. Validation was carried out by R.J.B., J.W., C.R.I., R.P.W., and K.Y.C. Analysis was achieved by R.J.B., S.H., J.W., B.P.L., L.A.F., and K.Y.C. Data collection and curation were done by R.J.B., S.H., J.W., B.P.L., J.D.H., S.L.B., L.A.F., R.P.W., C.R.I., C.J.D., S.M., and K.Y.C. Clinical resources were garnered by S.M., A.B.C., and S.B.B. Original manuscript was written by R.J.B., M.L.R., A.M.C., and K.Y.C. Review and editing were performed by R.J.B., S.H., B.P.L., J.D.H., S.L.B., L.A.F., R.P.W., C.R.I., C.J.D., A.B.C., S.B.B., M.L.R., A.M.C., and K.Y.C. Supervision was provided by R.J.B. and K.Y.C.
Additional Information
Disclosure Summary: The authors have nothing to disclose.
Data Availability:
The datasets generated during and/or analyzed during the current study are not publicly available but are available from the corresponding author on reasonable request.
Abbreviations:
- 18F-FDG
18F-fluorodeoxyglucose
- BAT
brown adipose tissue
- BMI
body mass index
- BMR
basal metabolic rate
- CIT
cold-induced thermogenesis
- EE
energy expenditure
- EMG
electromyogram
- NIDDK
National Institute of Diabetes and Digestive and Kidney Diseases
- PET
positron emission tomography
- R2
conditional coefficient of determination; R2M
- marginal coefficient of determination
RMS
- root mean squared
SUV
- standardized uptake value
Ta
- ambient temperature
Tcore
- core body temperature
Tlc
- lower critical temperature
Tskin, skin temperature
