


Abstract
N-glycosylation and glycan composition of human TSH molecules modulate the biological properties of TSH in different physiological and clinical situations. The degree of sialylation of serum TSH was reported to be very low in normal third-trimester fetuses compared with normal adults. The circulating TSH glycoforms and their glycan compositions in young children have hitherto not been determined.
To characterize N-glycosylation and glycan composition of circulating TSH molecules in young children.
Serum samples were obtained from euthyroid individuals: 33 children, age 2 weeks to 3 years, and 264 adults. The di-glycosylated TSH and tri-glycosylated TSH glycoforms were determined and characterized with respect to sialylation and sulfonation. The TSH N-glycosylation was also examined in pituitary extracts of 75 individuals.
In children up to 18 months of age, most TSH molecules were low-N-glycosylated, high-sulfonated, and low-sialylated compared with older children and adults. The degree of N-glycosylation was similar in serum and pituitary extracts up to 3 months of age and after that was higher in serum than in pituitary extracts.
Children up to age 18 months had low-sialylated TSH molecules, similar to those reported for third-trimester fetuses. Most TSH molecules in young children were of smaller size and less negatively charged, favoring transport into their target tissues. The low sialylation favors a high biopotency at thyroid and extrathyroidal TSH receptors. A delayed development of the liver SO3-N-acetylgalactosamine receptor function after birth is a likely explanation of the highly sulfonated TSH molecules in serum samples of infants.
The glycosylation and the glycan composition of the human TSH molecules modulate the biological properties of the hormone in different physiological and clinical situations (1–3). The degree of N-glycosylation decides both size and charge of the TSH molecules, which are expected to affect transport of the molecules within different tissues. The glycan decorations on the circulating TSH molecules modulate both clearance rates in the circulation and their biopotencies at the target cells (3). Moreover, it was reported that in normal third-trimester fetuses the sialylation of serum TSH was low and that this was associated with highly bioactive TSH isoforms (3). To our knowledge, the glycosylation pattern on TSH molecules in young children has hitherto not been examined.
TSH, a pituitary glycoprotein hormone, is a heterodimer of two polypeptides consisting of an α subunit common to TSH, FSH, and LH and a non–covalently linked β subunit, which confers specificity. The N-glycosylation of the polypeptides takes place cotranslationally in the rough endoplasmic reticulum (ER). N-glycans (oligosaccharides) are covalently attached to asparagine (Asn) residues by N-glycosidic bonds. TSH circulates as two glycoforms: tri-glycosylated TSH (TSHtri) and di-glycosylated TSH (TSHdi) (4). TSHtri is fully N-glycosylated, with two N-glycans on the α-polypeptide and one on the β-polypeptide. TSHdi, termed low-glycosylated, has two N-glycans on the α-polypeptide and none on the β-polypeptide.
The TSH molecules are posttranslationally modified in the Golgi apparatus within the cell where the branching of the N-glycans and their decoration with the terminal anionic monosaccharide (AMS) residues occurs. Sialic acid (SA) and sulfonated N-acetylgalactosamine (SU) are two AMS residues that can be attached to the TSH N-glycans; in this study, the processes are described as sialylation and sulfonation of TSH. The major steps of the N-glycosylation in the ER and of the N-glycan modifications in the Golgi were illustrated in a schematic drawing elsewhere (5).
Both SA and SU regulate biological properties of TSH. For example, decreased SA increases the metabolic clearance rate of TSH and also increases its intrinsic biological effect at the target cell (3). Pituitary glycoprotein hormones with two or more SU residues are quickly removed from blood circulation because of an SO3-N-acetylgalactosamine (SU) receptor in the liver (6–9). TSHdi and TSHtri are secreted as spectra of a very large number of forms differing in glycan structure determined by the actual number of terminal SA and SU residues per molecule. Our studies indicate that all these different TSH isoforms are present in serum of all the euthyroid individuals. The relative abundance of the two glycoforms and of the more or less sialylated and sulfonated glycoforms in circulation vary both within and between individuals and are related to different clinical and physiological situations. The different forms are cleared from the circulation according to their individual metabolic rate.
We have developed methods to characterize the circulating TSH molecules with respect to degrees of N-glycosylation, sulfonation, and sialylation (4). These three modifications of TSH molecules have not yet been determined for circulating TSH in euthyroid children. The aim of the current study was to characterize the N-glycosylation and glycan composition of the TSH molecules in serum samples from very young euthyroid children. Their glycosylation-related patterns were compared with those in sera of children age 2 to 3 years and of adults.
The frequency of TSHdi vs TSHtri in the circulation is governed by both the secretion of the two TSH glycoforms from the pituitary and the elimination rates of these molecules from the circulation. To explore this, the relative frequency of the two TSH glycoforms was estimated in pituitary extracts of individuals from 3 days to 90 years of age and compared with the frequency in serum samples from individuals of corresponding ages.
Participants and Methods
Participants
One serum sample was obtained from each of 50 patients (33 children and 17 adults) and 247 medical students from 1998 to 2011. All 297 individuals were euthyroid and had TSH and free FT4 serum levels within the reference ranges for healthy individuals when initially analyzed with the clinical chemical routine methods. Hospital ward medical records for patients and health declarations from the medical students made at the time the serum samples were taken, studied by one of us (L.W.), revealed that none of the 297 individuals had a known thyroid or pituitary disease, which could have been disqualifying for inclusion in the study. The surplus serum samples were kept at −20°C until the TSH molecules were characterized with the methods described below from 2002 to 2012. The study was conducted according to the approval of the Ethics Committee of the Medical Faculty of Uppsala University (Ups 01-367, 2001-09-13; still valid) for use of surplus serum samples in clinical chemistry.
The serum samples from the medical students were obtained as previously described (10). Their donations of serum samples were accompanied by health declarations, signed by each student, and with informed consent according to the Declaration of Helsinki of ethical principles for medical research and with the approval of the local ethics committee.
The participants were divided into six groups; the age, sex, and number of individuals of each group are presented in Table 1. The serum samples from the preterm children were obtained at a “postconceptional” age of 30 to 37 weeks.
Participant Characteristics
| Source | Mean Age (Range) | Participants, n | Female/Male, n/n |
|---|---|---|---|
| Serum samples | |||
| Preterm, 24–32 wk, infants | 7.0 (2–12) wk | 12 | 12/0 |
| Full-term infants | 6.7 (2–13 wk | 8 | 4/4 |
| Children | 11.3 (6–18) mo | 8 | 6/2 |
| Children | 2.25 (2–3) y | 5 | 3/2 |
| Women | 28.7 (21–80) y | 153 | 153/0 |
| Men | 27.7 (21–87) y | 111 | 0/111 |
| Pituitaries | |||
| Children | 1.5 (0.1–3) mo | 7 | 4/3 |
| Children | 8.2 (4–20) mo | 6 | 5/1 |
| Children | 10.0 (3–15) y | 8 | 4/4 |
| Adults | 48.1 (16–90) y | 54 | 30/24 |
Pituitaries from 75 individuals were collected at autopsy at the Department of Forensic Medicine and Department of Pathology, Uppsala University, Uppsala, Sweden, in the 1980s (11, 12). The bodies were kept at 5°C until autopsy, and the mean interval between death and autopsy was 4 days (range, 1 to 7 days). The pituitaries were kept at −20°C for an average of 10 (range, 1 to 20) weeks until extracts were prepared. The cause of death was accidental for all children and younger adults and most of the older adults. Patients with pituitary tumors were not included. The participants were divided into four groups; the age, sex, and number of individuals of each group are presented in Table 1.
The collection of pituitaries for hormone analyses in the 1980s was approved by the local ethics committee.
Immunoassay of serum TSH
The concentrations of TSH in serum samples and in separated fractions after electrophoresis were measured by using a time-resolved sandwich fluoroimmunoassay (Delfia, PerkinElmer-Wallac Oy, Turku, Finland). The Delfia assay is highly specific for the TSH polypeptide heterodimer. The method permitted room-temperature measurements of the hormone directly in the 0.075 M veronal (Sigma-Aldrich Chemie Gmbh, Darmstadt, Germany) buffer at a pH of 8.7 eluted from electrophoreses. The TSH values were expressed in mIU/L using the Third International TSH Standard, National Institute for Biological Standards and Control code 81/565, as a reference. The detection limit of the hormone in fractions from electrophoresis was about 100 attogram (100 × 10−18 g).
The serum samples had been kept deep-frozen for a period ranging from 2 weeks to 5 years and then were thawed for electrophoretic analyzes. Most serum samples were thawed only once. Many serum samples were used for quality control of the reagents and equipment and thereby subjected to several freeze-thaw cycles when reanalyzed by electrophoreses. We found in these studies that the TSH molecules were stable and retained their electrophoretic distributions.
Frequency of glycoforms of TSH and AMS residues per glycoform molecule
All serum samples and pituitary extracts were analyzed with an electrophoresis technique using a 0.10% agarose suspension in veronal buffer at a pH of 8.7 (4). The mobilities were expressed in relation to that of human serum albumin as albumin mobility units. The area under the curve for eluted TSH was resolved into peaks at the positions for different numbers of AMS residues per molecule. The frequencies of the two glycoforms of TSH in the serum samples and the median numbers of AMS residues per glycoform molecule were calculated from the distribution by electrophoresis using the TSH algorithm as described (4).
Neuraminidase treatment
The terminal SA residues were removed from the TSH molecules, both in serum samples and in separated fractions after electrophoresis, by neuraminidase treatment of 24 hours at 37°C, leaving the SU as the only AMS remaining on the molecules, as described (4). The immunological TSH activities measured before and after neuraminidase treatment of serum samples were not significantly different when measured with the Delfia immunoassay.
Determination of SU and SA on glycoforms
The number of SU residues and the percentage of SU out of the AMS were determined for each glycoform as described (4). The ratio of percentage SU out of total AMS per molecule on low vs fully N-glycosylated glycoforms was used in the formula to calculate the number of SU and SA per glycoform molecule. The mean ratio of percentage SU on TSHdi vs percentage SU on TSHtri was 1.23 (SD, 0.031; range, 1.19 to 1.31; n = 21).
Extraction and assay of TSH in pituitary extracts
The anterior pituitary lobe of each pituitary was weighed and cut into pieces and homogenized in 2 mL 0.03 M phosphate buffer, pH of 5.7, and kept at 4°C for 24 hours. The extracts were then centrifuged and the supernatants were stored at −20°C until analyzed (11, 12). The concentrations of TSH in the pituitary extracts and in separated fractions after electrophoresis were measured with a solid-phase competitive binding radioimmunoassay (13). The antibodies, which were of human origin directed against bovine TSH, had a very high affinity to the human TSH molecules on the solid phase and to TSH in serum samples. A noncompetitive time-resolved sandwich fluoroimmunoassay for TSH, similar to the Delfia assay method described above, was developed in our laboratory in parallel with these studies on pituitary extracts in the 1980s. The TSH concentrations and the elution patterns of TSH activity after electrophoresis of pituitary extracts were close to identical when measured with the competitive and the noncompetitive TSH immunoassay. All electrophoreses of the pituitary extracts were made in the 1980s with the same method as used for serum samples in the current study.
Statistical analyses
Data are presented in the tables as mean values, with coefficient of variation (CV) in percent, and in the figures as mean ± SEM. Statistical comparisons were made by using a nonparametric Mann-Whitney test. The ratios between number of SU and SA residues per molecule were log-transformed and presented in the figures as geometric mean ± SEM values. A difference with a P value < 0.05 was considered significant.
Results
Degree of N-glycosylation of circulating TSH
The degree of N-glycosylation, expressed as frequency of fully glycosylated circulating TSH molecules (TSHtri) for the six groups of individuals in relation to the TSH serum concentrations, is illustrated in Fig. 1A. All groups of children had a significantly (P < 0.001) lower degree of N-glycosylation than found in adults. The lowest degree of N-glycosylation, expressed as percentage TSHtri, was found in children up to age 3 months and with similar values for preterm and full-term children. Their mean value was 23.3 ± 1.56, which was significantly (P < 0.01) lower than that for each of the two older groups of children.

(A) Percentage TSHtri vs total TSH serum concentration in children and adults. (B) TSHtri vs TSHdi serum concentration in children and adults. Values are expressed as mean ± SEM. Number of individuals and age range are indicated.
The four groups of children had serum concentrations of TSH with mean values between 3 and 4 mIU/L, whereas both men and women had mean values of ∼2 mIU/L (Fig. 1A). The serum concentrations of TSHdi and TSHtri of the six groups of individuals are presented in Fig. 1B. This diagram illustrates that the mean TSHtri levels in children and adults were similar, whereas the mean TSHdi levels were higher in all the groups of children compared with those of the two groups of adults.
For statistical comparisons, the results for the 28 youngest children, up to age 18 months, were combined into one group. The mean value of this combined group was statistically compared with that of children age 2 to 3 years and that of a pooled group of all adults. The P values for different variables related to glycosylation of the TSH molecules are presented in Table 2. The group of children with age up to 18 months had mean concentrations of both TSHdi and TSHtri similar to those of children age 2 to 3 years. The mean TSHdi level of the children up to age 18 months was significantly (P < 0.001) higher than that of the adults, whereas the mean TSHtri levels were not significantly different.
N-Glycosylation and Glycan Modifications of Circulating TSH Molecules in Euthyroid Children and Adults
| Variable | Age Group A 28 Children: 22 F, 6 M Age 0.5–18 mo Mean; CV% | Age Group B 5 Children: 4 F, 1 M Age 2–3 y Mean; CV% | Age Group C 264 Adults: 153 F, 111 M Age 21–87 y Mean; CV% | P Value for A vs Ba | P Value for A vs Ca | P Value for B vs Ca |
|---|---|---|---|---|---|---|
| N-glycosylation | ||||||
| TSHdi, mIU/L | 2.61; 54.3 | 2.25; 47.0 | 1.09;41.2 | NS | b | b |
| TSHtri, mIU/L | 0.92; 63.0 | 1.36; 46.0 | 1.05; 40.6 | NS | NS | NS |
| Percentage TSHtri | 26.1; 10.8 | 37.7; 4.70 | 49.2; 8.76 | c | b | b |
| Glycan modifications | ||||||
| SU per TSHdi molecule | 2.94; 4.80 | 2.56; 9.87 | 2.67; 5.28 | c | b | NS |
| SA per TSHdi molecule | 0.76; 16.3 | 1.08; 18.7 | 1.13; 12.1 | c | b | NS |
| SU per TSHtri molecule | 3.20; 4.02 | 2.91; 8.53 | 2.91; 4.34 | c | b | NS |
| SA per TSHtri molecule | 1.92; 8.08 | 2.35; 10.8 | 2.37; 7.36 | b | b | NS |
| Ratio SU/SA on TSHdi | 4.01; 22.2 | 2.47; 27.7 | 2.40; 17.4 | c | b | NS |
| Ratio SU/SA on TSHtri | 1.68; 10.2 | 1.25; 18.4 | 1.24; 11.4 | c | b | NS |
| AMS per glycan on TSHdi | 1.85; 2.38 | 1.82; 1.97 | 1.90; 1.51 | NS | b | d |
| AMS per glycan on TSHtri | 1.71; 2.53 | 1.75; 1.67 | 1.76; 1.69 | d | b | NS |
Abbreviations: F, female; M, male; NS, not significant (P > 0.05).
Nonparametric Mann-Whitney tests.
P < 0.001.
P < 0.01.
P < 0.05.
Degree of N-glycosylation of TSH in individual pituitary extracts compared with that in serum samples from individuals of corresponding age
The degree of N-glycosylation, expressed as percentage of fully glycosylated TSH (percentage TSHtri), in extracts from pituitaries of individuals of four different age groups, are presented in Table 3. The three groups of children up to age 15 years had mean percentage TSHtri values that were not significantly different from each other. The pituitary extracts of the adults, age 16 to 90 years, had a significantly (P < 0.001) higher mean percentage TSHtri value than did the three groups of children.
N-Glycosylation of TSH, Expressed as Percentage TSHtri, in 75 Pituitary Extracts
| Group Source | Age Range | Individuals, n | Percentage TSHtri Mean; CV% | P Value: Serum vs Pituitarya |
|---|---|---|---|---|
| Age group A | ||||
| Pituitary extracts | 0.1–3 mo | 7 | 20.1; 3.37 | |
| Serum samples | 0.5–3 mo | 20 | 23.3; 9.13 | NS |
| Age group B | ||||
| Pituitary extracts | 4–20 mo | 6 | 23.1; 3.49 | |
| Serum samples | 6–18 mo | 8 | 33.3; 8.04 | <0.01 |
| Additional group of pituitary extracts | 3–15 y | 8 | 25.1; 11.2 | |
| Age group C | ||||
| Pituitary extracts | 16–90 y | 54 | 32.5; 9.33 | |
| Serum samples | 21–87 y | 264 | 49.2; 8.76 | <0.0001 |
Comparison of N-glycosylation of TSH in pituitary extracts and in serum samples from individuals of similar age.
Abbreviation: NS, not significant.
Nonparametric Mann-Whitney tests.
N-glycosylation of TSH in pituitary extracts and in serum samples from individuals of similar age are compared for three age groups in Table 3. In children up to age 3 months, the difference was not significant between the mean percentage TSHtri value in pituitaries and that found for serum samples. In the age group 4 to 20 months, the mean percentage TSHtri in the circulation was significantly (P = 0.001) higher than in the pituitary extracts, 33 vs 23. In the adults, this difference in mean percentage TSHtri values between serum samples and pituitary extracts was more pronounced, 49 vs 33; P < 0.0001.
Terminal sialylation and sulfonation of N-glycans on serum TSHdi and TSHtri molecules
The mean ± SEM numbers of SA and SU residues per TSHdi and TSHtri molecule for the six groups of individuals are presented in Fig. 2A and 2B, respectively. The mean ± SEM ratios of SU/SA for TSHdi and TSHtri for the six groups are presented in Fig. 3A. The three groups of children with an age up to 18 months had fewer SA residues per molecule, more SU residues per molecule, and a higher SU/SA ratio on both the TSHdi and TSHtri compared with the group of children age 2 to 3 years and the two groups of adults. For statistical comparisons, the results of the 28 children with an age up to 18 months were combined into one group and compared with the group of children age 2 to 3 years and a combined group of all adults. The mean values for children up to age 18 months were significantly (P < 0.01 or P < 0.001) different from those of children age 2 to 3 years and of adults concerning number of SA and SU residues per molecule and ratio of SU/SA for both TSHdi and TSHtri molecules (Table 2).

(A) Sialic acid (SA) vs SU residues per TSHdi molecule and (B) per TSHtri molecule in children and adults. Values are expressed as mean ± SEM. Number of individuals and age range are indicated.
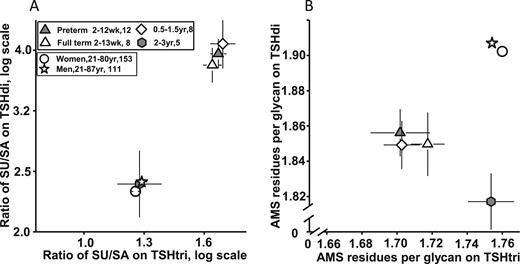
(A) Ratio of SU/SA residues on TSHtri vs on TSHdi in children and adults. (B) AMS residues per glycan on TSHtri vs on TSHdi in children and adults. Values are expressed as mean ± SEM. Number of individuals and age range are indicated.
The sum of the numbers of SA plus SU residues per glycan, expressed as AMS residues per glycan, on TSHdi and TSHtri molecules are presented for the six groups of individuals, as mean ± SEM values, in Fig. 3B. The three groups of children age up to 18 months had significantly (P < 0.001) fewer AMS residues per glycan on both TSHdi and TSHtri compared with adults (Table 2). The mean number of AMS residues per glycan of the group of children age 2 to 3 years was also significantly (P < 0.001) lower than that in adults for TSHdi but similar to that in adults for the TSHtri molecules.
Discussion
We report in this study that the glycosylation pattern on most TSH molecules in serum samples of children up to 18 months of age is different from that in children 2 to 3 years of age and that in adults. These differences concern the N-glycosylation of the TSH β polypeptide with the formation of the TSHdi and TSHtri glycoforms and the decorations of the N-glycans with SA and SU residues.
Persani et al. (3) reported that in normal third-trimester fetuses, the degree of sialylation of serum TSH was low. In the current study, the lowest degree of sialylation was found in the neonates and in children up to age 18 months. This indicates that the low degree of sialylation on TSH molecules in the third-trimester fetuses persists on the TSH molecules after birth through age 18 months.
The compositions of the spectra of isoforms of the two TSH glycoforms analyzed in a serum sample represent the isoforms circulating at the moment the blood sample was taken. In the physiological and clinical studies, we assume that this composition is close to that reaching the target cells, in this case the TSH receptors on both thyroidal and extrathyroidal tissues, as, for example, fat and bone tissues. The biological effect of such spectra of isoforms will be the combined effect of all the multiple isoforms. Therefore, in our physiological and clinical studies, we have chosen to express the number of AMS, SU, and SA residues per glycoform molecule, or per glycan, as the median value of that of the multiple isoforms (4).
The lowest degree of N-glycosylation was found in children up to age 3 months, and there was no significant difference between preterm or full-term children. The study also revealed that the higher TSH serum levels found in children as compared with those in adults were exclusively due to higher levels of the TSHdi glycoforms. The TSHtri levels were similar in children and adults. The age-related changes in the serum samples in degree of N-glycosylation, estimated as %TSHtri, may be due to changes in the pituitary secretion of the two TSH N-glycoforms and/or to changes in elimination rates from the circulation for TSHdi and TSHtri glycoforms. To further explore these alternatives, the degree of N-glycosylation in pituitary extracts was compared with that in serum samples from individuals of similar age. In children up to 3 months of age, the mean percentage TSHtri values were similar, about 20 to 23, in the pituitary extracts and in the serum samples. The degree of N-glycosylation, expressed as percentage TSHtri, in the pituitary extracts remained low throughout childhood and then increased to a higher level in adults up to old age. The percentage TSHtri in the serum samples started to increase in children age 6 to 24 months and then remained higher than in the pituitary extracts throughout life. These results suggest that from 6 months of age TSHdi molecules are eliminated from the circulation faster than are TSHtri molecules. A most likely explanation is that the mannose/sulfonated N-acetylgalactosamine–specific receptor (SU receptor) in the liver starts to mature between 3 and 6 months of age and plays an increasing role in the elimination of TSHdi from the circulation in children from 2 years of age and in adults.
In children up to age 18 months, most of the circulating TSH molecules had a unique distribution with respect to sulfonation and sialylation of the N-glycans. The number of SU residues per molecules was high and that of SA residues low on both TSHdi and TSHtri compared with that in children of age 2 to 3 years and in adults. The SU/SA ratio in children up to age 18 months was ∼4 on the TSHdi molecules compared with 1.7 on the TSHtri molecules.
TSH molecules with two or more SU residues per molecule are expected to be rapidly removed by the SU receptor in the liver (6–9). The high serum concentration of the SU-rich TSH isoforms in the youngest group of children strongly indicates that the SU receptor is not fully developed at that early age. Indeed, all the age-related changes we have detected for AMS, SU, and SA residues on circulating TSH molecules can be explained by a delayed development of the liver SU receptor function in the infants, starting to mature at 3 to 6 months of age and being fully effective from about 2 years of age.
The significantly (P < 0.001) lower values for AMS per glycan on both TSHdi and TSHtri in the youngest group of children compared with adults can be explained by the suggested delayed maturation of the liver SU receptor and/or by a slightly lower synthesis capacity of the Golgi apparatus in the TSH-producing pituitary cell in the young children.
A significant negative correlation was reported by Persani et al. (3) for the ratio of in vitro biological to immunological activity of TSH vs the degree of sialylation. This is in analogy with our findings for FSH where the low N-glycosylated forms, FSHtri, with fewer SA residues, had about three times greater biopotency at the target cells than the fully glycosylated forms, tetra-glycosylated FSH (5).
In the current study the mean number of SA residues per TSHdi and TSHtri molecule in the circulation of children up to age 18 months was significantly (P < 0.001) lower than the corresponding mean values in adults. The low mean number of SA per TSHdi molecule in the young children is therefore expected to favor a high biological activity at the target cells. Accordingly, the lower number of SA on TSHtri in the young children vs adults suggests that these circulating molecules had a higher biological activity than the TSHtri molecules in the adults.
The imprecision of the estimated means of different variables was in this study expressed as CV in percentages. The high values for the TSH glycoform concentration of 40% to 63%, the number of SA residues of 7% to 19%, and the ratio of SU/SA residues of 10% to 27% were most likely an effect of the pulsatile TSH release from the pituitary. In contrast, the imprecision of the estimates of number of AMS residues per glycan was very low (1.5% to 2.5%), indicating a low variation both within and between individuals.
What is the physiological significance of the findings presented in this study? Several previously reported observations can be used as clues. The TSH receptor is expressed in a variety of extrathyroidal tissues, such as the immune system, bone marrow and peripheral blood cells, white and brown adipose tissue, and bone tissue (14, 15). The presence of such extrathyroidal TSH receptors in the human body has been known for several decades. However, the physiological significance of these extrathyroidal TSH receptor expressions in euthyroid individuals has not been established. The discovery presented in this study on circulating unique TSH molecular composition in the young euthyroid children is suggested to be associated with a physiological role of extrathyroidal TSH receptor expressions. The molecular structures of the TSH molecules circulating in the young children render them properties that are favorable for both biological potency at the target cells and transport within different tissues.
Most circulating TSH molecules were smaller and less negatively charged because of a lower degree of N-glycosylation. The smaller size and lower negative charge are properties expected to facilitate the transport of molecules into different tissues. Furthermore, the TSH molecules were equipped with a low content of SA residues, expected to favor a high biopotency of the TSH molecules at the target cells. This combination of a low degree of sialylation and a very high intrinsic bioactivity was reported for third-trimester fetal TSH isoforms (3). This molecular similarity of TSH isoforms before and after birth suggests that possible physiological functions of these TSH molecules in fetal life may persist after birth up to ∼18 months of age.
The TSH molecules had a high content of SU residues. Such TSH molecules will normally be rapidly removed from the circulation by an SU receptor in the liver (6–9). A delayed maturation of the SU receptor in the liver, together with a lower degree of TSH N-glycosylation in the ER, can explain why the TSH molecules with high contents of SU and low of SA residues survive and accumulate in increased concentration in the circulation of the very young children. This study did not examine the posttranslational process of the TSH synthesis. However, the unique TSH molecular pattern in the circulation of the very young children could be fully explained without any change in the posttranslational process of the TSH synthesis in their anterior pituitaries.
TSH has a lipolytic effect on fat cells isolated from neonates (16, 17). The neonatal fat cells displayed a much more sensitive TSH receptor function than fat cells from adults. These findings prompted the current study, with the question of whether the lipolytic TSH effect was associated with a different TSH molecular composition in the circulation of neonates. Marcus et al. (17) found that a concentration of TSH (in their report designated as “physiological”) could induce a lipolytic effect with the neonatal fat cells, measured as release of glycerol, whereas a considerably higher TSH concentration was needed to induce lipolysis on fat cells from adults. This highly sensitive lipolytic effect of TSH was observed for fat cells isolated from preterm and full-term infants with a “postconceptional” age of 37 to 41 weeks regardless of time of birth (17). When the full-term infants were 4 to 10 weeks old, the adipocytes had lost almost all their high sensitivity to low concentrations of TSH.
In the current study, the unique molecular composition of TSH was detected in all serum samples obtained from children from 2 weeks up to 18 months of age. The circulating TSH molecules may exert a lipolytic effect in the group of the preterm born infants with a “postconceptional” age of 30 to 37 weeks, a period when isolated fats cell were reported to be highly sensitive for TSH-induced lipolysis (17). However, it is a large discrepancy between the short age period suggested for a lipolytic effect of TSH and the 18-month-long period, during which the TSH molecules with the unique molecular composition were found in the circulation. Other extrathyroidal tissues with TSH receptors, such as bone tissue, should therefore also be examined.
It is noteworthy that the unique TSH molecular composition in the circulation disappeared after about 18 months of age. At this age, the child has usually started to walk, which means that the mechanical stimulus for bone formation becomes more important for the development of structure and mass of bone (18). A direct TSH effect on bone tissue may be present already during late fetal life and then last until the child stands up and walks. Studies in adults suggest that the direct effects of TSH on bone tissues are both an inhibition of bone resorption and an attenuation of osteoblast response (19).
In conclusion, the circulating TSH molecules in children up to age 18 months have a unique glycobiology compared with TSH circulating later in life. The young children had TSH molecules with a low degree of sialylation favoring a high biopotency. These molecules have a structural similarity to the third-trimester fetal TSH isoforms found to have high intrinsic bioactivity (3). This indicates that the low degree of sialylation on TSH molecules in the third-trimester fetuses persists on the TSH molecules after birth up to 18 months of age. The degree of sulfonation is high, which normally should lead to a rapid clearance of such TSH molecules from the circulation by the SU receptors in the liver. A delayed development of the SU receptor function in the liver can explain why the highly sulfonated TSH molecules remain in the circulation in infants. The results indicate that this liver SU receptor function starts to mature at 3 to 6 months of age and is fully effective from about 2 years of age. The physiological significance of the circulating TSH molecules in the young children on extrathyroidal tissues equipped with sensitive TSH receptors remains to be explored.
Acknowledgments
Financial Support: This study was sponsored by a grant (467320301) from the Uppsala University (L.W.).
Additional Information
Disclosure Summary: The authors have nothing to disclose.
Data Availability:
All data generated or analyzed during this study are included in this published article or in the data repositories listed in References.
Abbreviations:
- AMS
anionic monosaccharide
- CV
coefficient of variation
- ER
endoplasmic reticulum
- SA
sialic acid
- SU
SO3-N-acetylgalactosamine
- TSHdi
di-glycosylated TSH
- TSHtri
tri-glycosylated TSH
