


Abstract
The effect of antidepressant (ATD) use on mortality in patients with diabetes mellitus (DM) has not yet been sufficiently studied, although comorbid depression is common in this population.
To explore the impact of ATDs on mortality among DM patients.
A retrospective cohort study in a national database.
This population-based study used the National Health Insurance Research Database in Taiwan. Since 2000, we identified 53,412 cases of newly diagnosed patients with DM and depression. Patient cases were followed for assessing mortality until 2013.
The association between mortality and ATD use was explored adjusting for cumulative dosing.
Using the time-dependent Cox regression model, ATD use was associated with significantly reduced mortality among patients with DM [in the highest dose group: hazard ratio (HR), 0.65; 95% CI, 0.59 to 0.71]. Further analysis showed that differences in mortality existed across ATD categories: selective serotonin reuptake inhibitors (HR, 0.63; 95% CI, 0.56 to 0.71), serotonin-norepinephrine reuptake inhibitors (HR, 0.58; 95% CI, 0.44 to 0.78), norepinephrine-dopamine reuptake inhibitors (HR, 0.20; 95% CI, 0.07 to 0.63), mirtazapine (HR, 0.60; 95% CI, 0.45 to 0.82), tricyclic/tetracyclic antidepressants (HR, 0.73; 95% CI, 0.54 to 0.97), and trazodone (HR, 0.52; 95% CI, 0.29 to 0.91). However, reversible inhibitor of monoamine oxidase A (RIMA) was found to be associated with an increase, rather than a decrease, in total mortality (HR, 1.48; 95% CI, 1.09 to 1.99).
Most ATDs, but not RIMA, were associated with significantly reduced mortality among a population with comorbid DM and depression.
Diabetes mellitus (DM) is a highly prevalent chronic disease associated with increased mortality (1). DM significantly raises the incidence of mortality, ischemic attacks, and heart failure in patients with established or high-risk atherosclerosis in a recent 4-year large cohort (2). A study in China analyzing mortality in DM patients (n = 2654) from 2002 to 2012 also reported increased mortality largely due to cardiovascular-related events (3). The reduction of mortality in individuals with DM remains a critically important and unmet need.
The incidence of major depressive disorders among individuals with DM is significantly greater than in the general population (4–6). Independently, depression is associated with significant excess mortality resulting from suicide, accidental or violent causes, and diseases (7). Consequently, DM and depression each independently contribute to increasing total mortality (8–11). Therefore, assessing the impact of antidepressants (ATDs) on mortality in patients with comorbid depression and DM has significant clinical relevance.
Several studies have reported an association between ATD use and increased risk of DM diagnosis (12–14). These findings suggest a deleterious effect of certain ATDs on insulin/glucose homeostasis, including tricyclic ATDs, selective serotonin reuptake inhibitors (SSRIs), and serotonin antagonist and reuptake inhibitors. To our knowledge, the effect of ATD use on mortality in DM patients has not yet been sufficiently studied. In the current study, we sought to determine the effect of ATD on mortality in persons with diabetes and depression.
Methods
This study was based in part on National Health Insurance Research Database (NHIRD) data provided by the Administration of National Health Insurance, Ministry of Health and Welfare, Taiwan. The interpretation and conclusions contained herein do not represent positions of the Administration of National Health Insurance. The Institutional Review Board of the Chang Gung Memorial Hospital approved this study (No. CGMH 104-7528B).
Cases were identified from the Taiwan NHIRD (see Fig. 1 for flowchart) (15). The current study applied a specific data subset for all patients with mental disorders [International Statistical Classification of Diseases, ninth revision (ICD-9) codes 290 to 319] for 1998 to 2013. The subset data included patients who had at least one psychiatric admission or three psychiatric outpatient visits and the diagnosis was made by psychiatrists (16). From the data set, newly diagnosed DM patients (ICD-9 code 250) for 2000 to 2013, who combined a later new diagnosis of depression, including major depressive disorder or dysthymic disorder (ICD-9 codes 296.2, 296.3, 300.4, and 311), were selected in this study. Toward establishing the validity of a DM diagnosis in the Taiwan NHIRD, diagnostic accuracy has been reported previously as 74.6% (17). Subjects with ATD use prior to the diagnosis of DM were excluded. The cumulative dose of ATDs was measured during the time of follow-up.
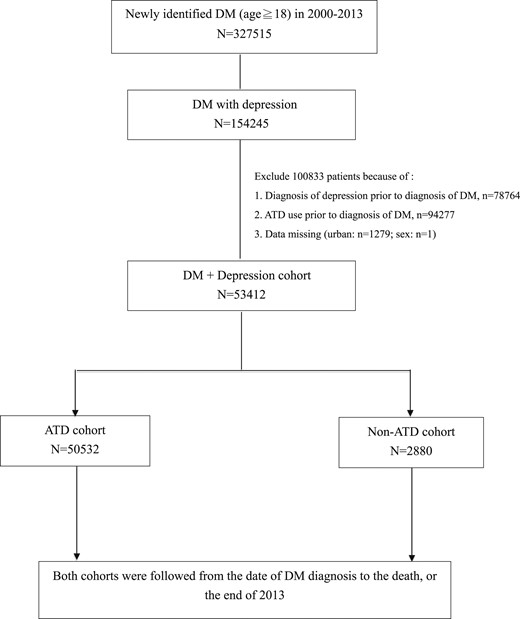
Flowchart of the study design.
Of the 53,412 enrollees, there were 50,532 people using ATDs and 2880 people not using ATDs (Table 1). There was an attempt to determine whether there were any characteristics (e.g., sociodemographic) that differentiate the two groups (i.e., those taking ATDs and those not taking ATDs). Urbanization and financial status were divided into four levels. Four comorbid chronic diseases [heart failure, end-stage renal disease (ESRD), chronic obstructive pulmonary disease (COPD), malignancy] that were known to increase the mortality of patients with depression were included as possible confounding variables (18). The adapted diabetes complication severity index, indicating the severity of DM complication for each patient, was also counted in Young et al. (19).
Demographic and Clinical Characteristics of ATD Use and Non–ATD Use Cases
| Variables | Total | ATD Use (N = 50,532) | Non–ATD Use (N = 2880) | P Value | |||
|---|---|---|---|---|---|---|---|
| n | % | n | % | n | % | ||
| Sex | 0.0135 | ||||||
| Male | 23,903 | 44.75 | 22,550 | 44.63 | 1353 | 46.98 | |
| Female | 29,509 | 55.25 | 27,982 | 55.37 | 1527 | 53.02 | |
| Age, y | <0.0001 | ||||||
| 18–44 | 10,974 | 20.55 | 10,529 | 20.84 | 445 | 15.45 | |
| 45–64 | 26,243 | 49.13 | 25,022 | 49.52 | 1221 | 42.40 | |
| ≥65 | 16,195 | 30.32 | 14,981 | 29.65 | 1214 | 42.15 | |
| Urbanization level | <0.0001 | ||||||
| 1 (City) | 16,324 | 30.56 | 15,519 | 30.71 | 805 | 27.95 | |
| 2 | 24,179 | 45.27 | 22,944 | 45.40 | 1235 | 42.88 | |
| 3 | 8811 | 16.50 | 8268 | 16.36 | 543 | 18.85 | |
| 4 (Villages) | 4098 | 7.67 | 3801 | 7.52 | 297 | 10.31 | |
| Income | 0.0003 | ||||||
| 0 | 10,327 | 19.33 | 9717 | 19.23 | 610 | 21.18 | |
| 1–15,840 | 9456 | 17.70 | 8963 | 17.74 | 493 | 17.12 | |
| 15,841–25,000 | 23,843 | 44.64 | 22,518 | 44.56 | 1325 | 46.01 | |
| >25,000 | 9786 | 18.32 | 9334 | 18.47 | 452 | 15.69 | |
| Comorbidities | |||||||
| Heart failure | 9223 | 17.27 | 8645 | 17.11 | 578 | 20.07 | <0.0001 |
| ESRD | 1921 | 3.60 | 1813 | 3.59 | 108 | 3.75 | 0.6494 |
| COPD | 21,502 | 40.26 | 20,322 | 40.22 | 1180 | 40.97 | 0.4209 |
| Malignancy | 9882 | 18.50 | 9325 | 18.45 | 557 | 19.34 | 0.2333 |
| Adapted DCSI (mean ± SD) | 0.45 ± 0.90 | 0.45 ± 0.90 | 0.53 ± 0.99 | <0.0001 | |||
Abbreviations: COPD, chronic obstructive pulmonary disease; DCSI, Diabetes Complications Severity Index; ESRD, end-stage renal disease.
Later, we analyzed the individual effect of these covariates on mortality (Table 2), with adjustment for multiple confounding variables including sex, age, urbanization, income, comorbidity, the severity of DM, and the total ATD dose [cumulative defined daily dose (cDDD)] (20). Additionally, the ATDs were further analyzed as a function of seven different classes adjusting for other covariates [i.e., SSRI, serotonin-norepinephrine reuptake inhibitor (SNRI), norepinephrine-dopamine reuptake inhibitor (NDRI), mirtazapine, trazodone, tricyclic/tetracyclic ATDs, and reversible inhibitor of monoamine oxidase A (RIMA)]. Each category of ATDs was divided into three groups according to cumulative dose exposure. Risk of mortality was evaluated by comparing the highest dose group (cDDD of ≥84) to the lowest dose group (cDDD of <28). All-cause mortality was analyzed using a repeated measures time-dependent Cox regression model. ATD prescriptions were measured each year during the study period. Dosages of ATD prescriptions per year served as the main exposure variable. The risk of mortality during the follow-up period was calculated through survival analysis (21). To explore the influence of time since diagnosis of diabetes and duration of ATD use, we also carried out the sensitivity analysis by a time-fixed model (22).
Time-Dependent Cox Regression Analysis of Mortality in Patients With DM and Depressive Disorder
| Variables | Crude HR | Adjusted HRa | ||||||
|---|---|---|---|---|---|---|---|---|
| HR | 95% CI | P Value | HR | 95% CI | P Value | |||
| ATD drug use, cDDD | ||||||||
| <28 | 1.00 | Reference | 1.00 | Reference | ||||
| 28–83 | 0.92 | 0.84 | 1.01 | 0.0818 | 0.91 | 0.83 | 1.00 | 0.0478 |
| ≥84 | 0.60 | 0.55 | 0.66 | <0.0001 | 0.65 | 0.59 | 0.71 | <0.0001 |
| Sex | ||||||||
| Female | 1.00 | Reference | 1.00 | Reference | ||||
| Male | 1.78 | 1.70 | 1.87 | <0.0001 | 1.71 | 1.63 | 1.80 | <0.0001 |
| Age, y | ||||||||
| 18–44 | 1.00 | Reference | 1.00 | Reference | ||||
| 45–64 | 1.82 | 1.66 | 2.00 | <0.0001 | 1.58 | 1.44 | 1.74 | <0.0001 |
| ≥65 | 5.34 | 4.88 | 5.84 | <0.0001 | 3.44 | 3.13 | 3.78 | <0.0001 |
| Urbanization level | ||||||||
| 1 (City) | 0.69 | 0.63 | 0.76 | <0.0001 | 0.75 | 0.69 | 0.83 | <0.0001 |
| 2 | 0.78 | 0.72 | 0.85 | <0.0001 | 0.83 | 0.76 | 0.91 | <0.0001 |
| 3 | 0.91 | 0.83 | 1.00 | 0.0536 | 0.90 | 0.82 | 0.99 | 0.0282 |
| 4 (Villages) | 1.00 | Reference | 1.00 | Reference | ||||
| Income | ||||||||
| 0 | 1.00 | Reference | 1.00 | Reference | ||||
| 1–15,840 | 1.09 | 1.02 | 1.17 | 0.0177 | 1.00 | 0.93 | 1.07 | 0.9265 |
| 15,841–25,000 | 0.77 | 0.73 | 0.82 | <0.0001 | 0.87 | 0.81 | 0.93 | <0.0001 |
| >25,000 | 0.55 | 0.51 | 0.60 | <0.0001 | 0.67 | 0.61 | 0.73 | <0.0001 |
| Comorbidities | ||||||||
| Heart failure | 2.52 | 2.40 | 2.65 | <0.0001 | 1.45 | 1.37 | 1.52 | <0.0001 |
| ESRD | 3.26 | 3.02 | 3.51 | <0.0001 | 2.73 | 2.53 | 2.96 | <0.0001 |
| COPD | 1.75 | 1.67 | 1.84 | <0.0001 | 1.07 | 1.02 | 1.12 | 0.0105 |
| Malignancy | 3.93 | 3.75 | 4.12 | <0.0001 | 3.16 | 3.01 | 3.32 | <0.0001 |
| Adapted DCSI | 1.37 | 1.34 | 1.39 | <0.0001 | 1.18 | 1.15 | 1.20 | <0.0001 |
Abbreviation: DCSI, Diabetes Complications Severity Index.
Adjusted for sex, age, urbanization, income, comorbidities, and adapted DCSI.
Results
Comparing the demographic data between the ATD use and non–ATD use groups, there were more males and elderly individuals in the non–ATD use group (P < 0.05) (Table 1). The ATD use group had a younger age distribution, higher degree of urbanization, and better socioeconomic state, which may be due to their greater accessibility to psychotropic medication. In the non–ATD use group, there was a higher rate of heart failure (P < 0.001); no significant differences were detected between groups with respect to the other three comorbid diseases. Furthermore, the non–ATD use group had more severe DM complications than did the ATD use group, which may reflect insufficient personal health care or insufficient drug adherence. Duration between diagnosis of DM to death or censored was 7.4 ± 3.4 years in the death group and 10.0 ± 3.3 years in the non-death group. Duration between ATD first prescription to death or censored was 4.4 ± 3.2 years in the death group and 6.3 ± 3.7 years in the non-death group (22). For the time-fixed Cox regression model, the cohort was divided into three subgroups: <28 DDDs (n = 10,317), 28 to 84 DDDs (n = 9771), and 84 to 364 DDDs (n = 33,324) (Fig. 2). The mean follow-up duration among different groups ranged from 9.2 years to 9.9 years. The incidence rate of death events ranged from 1113.7 per 100,000 person-years (95% CI, 1078.4 to 1150.3) in highest dose group to 1963.7 per 100,000 person-years (95% CI, 1876.8 to 2054.7) in lowest dose group (log-rank test, P < 0.001) (22).
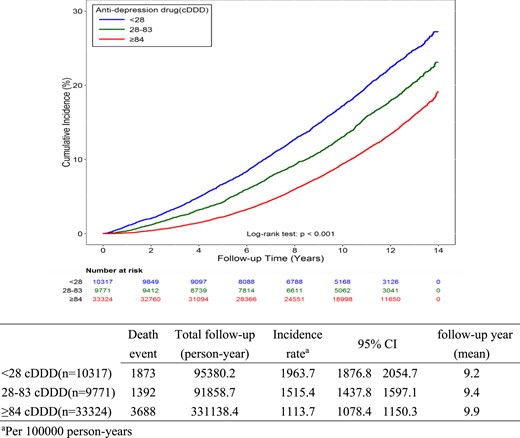
The incidence rate of death per 100,000 person-years between three exposure subgroups (time-fixed model).
After adjustment (Table 2), it was determined that as total cumulative dose increased, total mortality decreased; statistical significance was noted when cDDD was >28 (HR, 0.91; 95% CI, 0.83 to 1.00). When cDDD ≥84, the statistical significance was greater (HR, 0.65; 95% CI, 0.59 to 0.71). The results from different sensitivity analyses by considering duration of diagnosis of DM or prescription of ATDs also showed similar findings (22). Males were at greater risk for mortality compared with females (HR, 1.71; 95% CI, 1.63 to 1.80). Compared with individuals living in rural areas, those in urban areas exhibited a lower risk of mortality (in highest urbanization group: HR, 0.75; 95% CI, 0.69 to 0.83). Moreover, higher financial status was associated with reduced mortality (in the best economic group: HR, 0.67; 95% CI, 0.61 to 0.73). Four comorbid diseases (i.e., heart failure, ESRD, COPD, and malignancy) independently contributed to increased mortality (P < 0.05). The greater overall severity of DM complications was associated with a higher mortality (HR, 1.18; 95% CI, 1.15 to 1.20).
In Table 3, we further analyze seven ATDs to ascertain the effect of each respective ATD class/agent ATD on mortality. When cDDD <83, there was no significant effect detected on overall mortality. When cDDD ≥84, there was a significant reduction in DM mortality: SSRI (HR, 0.63; 95% CI, 0.56 to 0.71), SNRI (HR, 0.58; 95% CI, 0.44 to 0.78), NDRI (HR, 0.20; 95% CI, 0.07 to 0.63), mirtazapine (HR, 0.60; 95% CI, 0.45 to 0.82), tricyclic/tetracyclic ATDs (HR, 0.73; 95% CI, 0.54 to 0.97), trazodone (HR, 0.52; 95% CI, 0.29 to 0.91). In contrast, mortality of the RIMA group was increased in both the low-dose (HR, 1.91; 95% CI, 1.39 to 2.61) and high-dose groups (HR, 1.48; 95% CI, 1.09 to 1.99).
Time-Dependent Cox Regression Analysis of Mortality in Patients With DM and Depressive Disorder: Specific ATD Subgroup Analysis
| Crude HR | Adjusted HRa | |||||||||
|---|---|---|---|---|---|---|---|---|---|---|
| N | % | HR | 95% CI | P Value | HR | 95% CI | P Value | |||
| SSRI, cDDD | ||||||||||
| <28 | 21,923 | 41.05 | 1.00 | Reference | 1.00 | Reference | ||||
| 28–83 | 8631 | 16.16 | 0.88 | 0.78 | 0.99 | 0.0367 | 0.97 | 0.86 | 1.10 | 0.6465 |
| ≥84 | 22,858 | 42.8 | 0.56 | 0.50 | 0.63 | <0.0001 | 0.64 | 0.57 | 0.71 | <0.0001 |
| SNRI, cDDD | ||||||||||
| <28 | 46,638 | 87.32 | 1.00 | Reference | 1.00 | Reference | ||||
| 28–83 | 2338 | 4.38 | 0.65 | 0.46 | 0.92 | 0.0138 | 0.81 | 0.57 | 1.14 | 0.2182 |
| ≥84 | 4436 | 8.31 | 0.47 | 0.35 | 0.64 | <0.0001 | 0.59 | 0.44 | 0.80 | 0.0005 |
| NDRI, cDDD | ||||||||||
| <28 | 50,894 | 95.29 | 1.00 | Reference | 1.00 | Reference | ||||
| 28–83 | 1170 | 2.19 | 0.43 | 0.23 | 0.83 | 0.0121 | 0.56 | 0.29 | 1.08 | 0.0855 |
| ≥84 | 1348 | 2.52 | 0.15 | 0.05 | 0.47 | 0.0011 | 0.20 | 0.07 | 0.63 | 0.0056 |
| Mirtazapine, cDDD | ||||||||||
| <28 | 47,322 | 88.6 | 1.00 | Reference | 1.00 | Reference | ||||
| 28–83 | 2276 | 4.26 | 0.96 | 0.70 | 1.30 | 0.7724 | 1.01 | 0.75 | 1.38 | 0.9282 |
| ≥84 | 3814 | 7.14 | 0.59 | 0.44 | 0.80 | 0.0008 | 0.60 | 0.45 | 0.82 | 0.0011 |
| Tricyclic/tetracyclic ATDs, cDDD | ||||||||||
| <28 | 46,144 | 86.39 | 1.00 | Reference | 1.00 | Reference | ||||
| 28–83 | 3728 | 6.98 | 1.04 | 0.87 | 1.25 | 0.681 | 0.89 | 0.75 | 1.07 | 0.2314 |
| ≥84 | 3540 | 6.63 | 0.78 | 0.58 | 1.04 | 0.0886 | 0.73 | 0.54 | 0.97 | 0.0311 |
| SARI (trazodone), cDDD | ||||||||||
| <28 | 45,344 | 84.89 | 1.00 | Reference | 1.00 | Reference | ||||
| 28–83 | 4088 | 7.65 | 0.76 | 0.63 | 0.92 | 0.004 | 0.80 | 0.66 | 0.96 | 0.0189 |
| ≥84 | 3980 | 7.45 | 0.42 | 0.24 | 0.75 | 0.0029 | 0.52 | 0.29 | 0.91 | 0.0230 |
| RIMA (moclobemide), cDDD | ||||||||||
| <28 | 51,838 | 97.05 | 1.00 | Reference | 1.00 | Reference | ||||
| 28–83 | 673 | 1.26 | 2.01 | 1.47 | 2.76 | <0.0001 | 1.91 | 1.39 | 2.61 | <0.0001 |
| ≥84 | 901 | 1.69 | 1.69 | 1.25 | 2.29 | 0.0006 | 1.48 | 1.09 | 1.99 | 0.0111 |
Abbreviation: SARI, serotonin antagonist and reuptake inhibitor.
Adjusted for seven types of ATDs, age, sex, urbanization, income, comorbidities, and adapted Diabetes Complications Severity Index.
Discussion
To our knowledge, this is the first large population-based cohort study to identify an inverse association between ATD use and mortality among individuals diagnosed with DM and comorbid depression. A higher dose of ATD use was linked to lower mortality. The inverse effect existed across different types of ATDs.
There are studies that have reported on the association between ATD use and mortality in other chronic disease states. For example, Qian et al. (23) reported that ATD use significantly reduced total mortality in persons with COPD (HR, 0.55; 95% CI, 0.44 to 0.68). Separate and contradictory findings were reported in persons with cardiac disease. For example, a single large study assessed 121,252 patients with heart failure and found that ATD use increased total mortality, with depression (n = 2568; HR, 1.21) and without a diagnosis of depression (n = 16,780; HR, 1.24) (24). Another study evaluated 19,411 patients surviving their first hospitalization for heart failure, reporting that tricyclic ATDs and SSRI use increased the risk of both overall death and cardiovascular death (25). In our study we found directionally opposite findings, that is, ATD use reduces all-cause mortality, with a dose-dependent effect.
The mediators of mortality reduction in our sample are not known but are hypothesized to be due to disparate factors, including but not limited to inflammation (26). It is possible that proinflammatory cytokines could be meditational. Cytokines and their signaling pathways have multiple downstream effects that influence the metabolism (i.e., synthesis, release, reuptake) of a variety of neurotransmitters, including serotonin, dopamine, and glutamate (27). Additionally, alterations in the innate immunoinflammatory system are also well documented in diabetes and have been associated with increased level of IL-6 and C-reactive protein (28). The foregoing observation provides the framework for hypothesizing that modulating inflammatory systems with ATD use in patients with DM could have an anti-mortality effect.
A separate non–mutually exclusive hypothesis is that ATDs exerted a salutary effect on the coagulation profile in individuals with DM and depression. Carmassi et al. (29) studied 40 insulin-dependent patients with DM and found an impairment of the homeostatic balance, possibly a hypercoagulable state. As is well known, SSRI and SNRI have shown the ability to inhibit platelet adhesion and consequently influence coagulation and possibly the atherosclerotic pathway (30).
These data provide a further rationale for the screening and treating of depression in persons who have DM (31). In future research, the different effects of ATDs among various diseases should be further clarified, as should the present opposite effects found in patients with DM and heart failure.
There are several limitations to our study and to the interpretation of our results. For instance, the specific cause of death for each individual was not known, especially unnatural deaths or cardiovascular deaths (32). Having this information may help to understand a mechanistic pathway wherein ATDs reduce mortality (a direct effect through anti-depression or a possible indirect effect through antiinflammation). Notwithstanding the use of specific data subsets (registry for the psychiatric illness patient database), the validity of the diagnosis of depression remains a limitation to this database study. Furthermore, we did not include comorbid conditions (e.g., smoking, obesity) that may potentially be confounding factors (33). Finally, the results may not be generalized to the population beyond patients with DM in Taiwan. Further studies are warranted to explore whether the findings can be replicated among patients without DM or in other countries with different prescription patterns for ATDs. Notwithstanding these limitations, there are several strengths in our study. We used a nationwide database with a large sample size, and selection bias was minimized. Moreover, the large national database makes it possible to analyze seven classes of ATDs. We limited the assessment to persons who had a relatively recent diagnosis of diabetes, which minimizes the influence of their DM course on the mortality. Additionally, we limited the enrollment in our sample to those with a recent diagnosis of depression, which provided the opportunity to evaluate cumulative-dose calculation and the time-dependent model.
These data provide a further rationale for screening and treating depression in persons who have DM (33). In future research, the different effects of ATDs among different diseases should be further clarified, as should the present opposite effect found in patients with DM and heart failure.
Acknowledgments
The authors thank the staff of the Health Information and Epidemiology Laboratory, Chang Gung Memorial Hospital, Chia-Yi Branch, for their comments and assistance in data analysis.
Financial Support: This work was supported by Changhua Christian Hospital, Taiwan, Grant 104-CCH-ICO-003. The funder had no role in the design and conduct of the study; collection, management, analysis, and interpretation of the data; preparation, review, or approval of the manuscript; and decision to submit the manuscript for publication.
Additional Information
Disclosure Summary: The authors have nothing to disclose.
Data Availability:
Data sharing is not applicable to this article as no datasets were generated or analyzed during the current study.
Abbreviations:
- ATD
antidepressant
- cDDD
cumulative defined daily dose
- COPD
chronic obstructive pulmonary disease
- DM
diabetes mellitus
- ESRD
end-stage renal disease
- HR
hazard ratio
- ICD-9
International Statistical Classification of Diseases
- ninth revision
NDRI
- norepinephrine-dopamine reuptake inhibitor
NHIRD
- National Health Insurance Research Database
RIMA
- reversible inhibitor of monoamine oxidase A
SNRI
- serotonin-norepinephrine reuptake inhibitor
SSRI, selective serotonin reuptake inhibitor
References and Notes
Author notes
M.-C.H. and V.C.-H.C. contributed equally to this work.
