


Abstract
Although the role of iron in the development of type 2 diabetes (T2D) has long been a concern, prospective studies directly linking body iron stores to T2D risk in a sex-dependent context have been inconsistent.
A systematic meta-analysis was conducted to explore the sex-specific association of circulating ferritin with T2D risk.
We searched PubMed, Web of Science, and EMBASE databases to identify available prospective studies through 1 August 2018.
Fifteen prospective studies comprising 77,352 participants and 18,404 patients with T2D, aged 20 to 80 years, and with ∼3 to 17 years of follow-up were identified. For each 100-μg/L increment in ferritin levels of overall participants, T2D risk increased by 22% (RR, 1.22; 95% CI, 1.14 to 1.31). Of note, major heterogeneities by sex were identified, with increased ferritin level having an apparently greater effect on T2D risk in women (RR, 1.53; 95% CI, 1.29 to 1.82) than in men (RR, 1.21; 95% CI, 1.15 to 1.27) after exclusion of a study with high heterogeneity (41,512 men and 6974 women for sex-specific analyses; P = 0.020 for sex difference). Further nonlinear analysis between circulating ferritin and T2D risk also showed sex-dimorphic association in that the T2D risk of women was twice as strong in magnitude as that of men at the same ferritin level.
Greater circulating ferritin levels were independently associated with increased T2D risk, which appeared stronger among women than men. Our findings provide prospective evidence for further testing of the utility of ferritin levels in predicting T2D risk in a sex-specific manner.
Although the hypothesis that iron may play a substantial role in type 2 diabetes (T2D) can be traced back to the end of the 19th century, to date it remains unsettled (1, 2). Previous observational studies conducted mainly in the United States have directly associated T2D risk with higher iron stores, characterized by higher circulating levels of ferritin (3–7). However, controversies abound concerning the large heterogeneities and inconsistent findings across diverse populations (5, 8–10). Recently, an increasing number of prospective studies from Asian and European countries have also reported a major relationship between ferritin level and T2D risk (10–19), highlighting the important implications of iron in the health of both individuals and populations.
As an essential element, iron is fundamental in maintaining many physiological functions, including that of pancreatic β cells (2, 20). Nevertheless, iron can also behave like a reactive metal, causing oxidative damage that impairs β-cell function and secretion (21, 22). An important association between ferritin level and T2D risk has been reported in previous meta-analyses (23–26). Ferritin is a spherical heteropolymer composed of 24 heavy- and light-chain subunits that plays a pivotal role in iron storage (27). Clinically, circulating levels of ferritin are commonly used to reflect an individual’s iron status and for separate risk stratification for men and women (28–30). It has been suggested that variations in ferritin levels may contribute to different oxidative stress levels between the sexes (31), and variations have been reported in serum ferritin and T2D associations across men and women from different ethnic populations (32). Accumulating studies have observed sex-specific associations of ferritin levels with insulin resistance and T2D prevalence. Nevertheless, the results have been conflicting (9, 33–38). Circulating ferritin levels differ significantly according to sex, suggesting a sex-dependent relationship for ferritin and T2D risk. However, systematic reviews and meta-analytical assessments of observational studies have not directly evaluated sex-related heterogeneities potentially linking ferritin levels to T2D risk.
We therefore conducted a systematic and comprehensive meta-analysis of available prospective studies investigating the relationship between circulating ferritin levels and T2D risk. In particular, we investigated potential heterogeneities by sex and geographic location.
Methods
We followed the Meta-analysis Of Observational Studies in Epidemiology protocol in the design, implementation, analysis, and reporting of findings in the current meta-analysis (39). The protocol for our systematic review was registered with the International Prospective Register of Systematic Reviews (registration number CRD42018115036).
Search strategy
We used the keywords (“iron” OR “ferritin”) AND “diabetes” AND (“cohort” OR “prospective” OR “follow up” OR “longitudinal” OR “population” OR “nested case control” OR “case cohort”) to systematically search PubMed, EMBASE, and Web of Science for prospective cohort studies published through 1 August 2018. In addition, the references cited in the retrieved articles were reviewed to identify relevant studies.
Study selection, data extraction, and quality assessment
We used a two-step process to identify suitable studies that satisfied four criteria: (i) prospective study design, (ii) circulating levels of ferritin as exposure of interest, (iii) incident T2D, and (iv) relative risk (RR) estimates reported with standard errors or 95% CIs. First, two investigators (L.J. and K.W.) independently conducted an initial screening of all titles and/or abstracts; the full text of relevant articles was then evaluated. Data were then extracted using a standardized data collection form. Any discrepancies were resolved through group discussion. The following information was extracted from each publication: first author, year of publication, geographic location, study name, sex, age, duration of follow-up (mean/median), sample size (number of T2D cases and total number of cohort participants), method of assessing ferritin concentration (immunoturbidimetric assay, fluoroimmunoassay, radioimmunoassay, chemiluminescence immunoassay, electrochemiluminescence immunoassay, or sandwich enzyme-linked immunosorbent assay), criteria for T2D (self-report, symptoms, oral glucose tolerance testing, antidiabetic medication, fasting or nonfasting glucose, glycated hemoglobin, or other), covariates adjusted for in the multivariable analysis, categories of ferritin concentration, and corresponding risk estimates with 95% CIs. If risk estimates were reported with several multivariate-adjusted models in the original studies, the most fully-adjusted models were extracted.
Quality assessment was performed according to the Newcastle-Ottawa scale for cohort studies (40). This scale assigns a maximum of nine items to each study: four items for the selection of participants and measurement of exposure, two items for comparability, and three items for assessment of outcomes and adequate follow-up.
Statistical analysis
RRs and 95% CIs were used as the common measure of association across studies. Studies that stratified data by sex were treated as two separate reports. We used a random-effects model (DerSimonian-Laird method) to calculate the summarized RRs and their corresponding 95% CIs for comparison of the highest and lowest categories (41).
Dose-response analysis
Because of the relatively wide range of definitions for the exposure categories, we also performed dose-response analyses to evaluate the specific ferritin-T2D relationship. Using the method recommended by Greenland and Longnecker (42), we modeled ferritin levels in 100-μg/L increments associated with T2D risk. If the total number of cases or participants (or person-years) was reported (but not the distribution), we estimated the distribution according to the definitions of the quantiles. When neither median nor mean values were reported, we used the midpoint value in each category. If the highest or lowest category was open-ended, the midpoint of the category was estimated by assuming that the width of the category was the same as the width of the next adjacent category. In addition, we evaluated the nonlinear association between exposure and risk of outcomes using restricted cubic spline analysis, with three knots at the 10th, 50th, and 90th percentiles of the distribution (43, 44). Apart from the P value for trend, a P value for curve nonlinearity was calculated by testing the null hypothesis that the second coefficient of the spline was equal to zero.
Heterogeneity analysis
Heterogeneity among the studies was estimated using the I2 statistic, with cutoff values representing low (25%), moderate (50%), and high (75%) degrees of heterogeneity (45). To explore the significance of the difference in RR and the possible influence of residual confounding factors, we performed subgroup analyses and meta-regression analyses on possible sources of heterogeneity, including sex (men or women), geographic region (United States, Europe, or Asia), sample size, follow-up duration (mean/median), ferritin assay (immunoturbidimetric assay and chemiluminescence immunoassay), study design (cohort, nested case-control, or case cohort), blood sample source (serum or plasma), diabetes criteria, and adjustment by risk factors related to body mass index (BMI), smoking and alcohol, family history of diabetes, physical activity, liver enzymes, and metabolic syndrome components (yes or no).
Sensitivity analysis and publication bias
Sensitivity analyses were performed by omitting one study at a time and calculating a pooled estimate for the remainder of the studies to evaluate whether the results were affected markedly by a single study. We also conducted a cumulative meta-analysis to assess the change in pooled risk over time and the robustness of our quantitative estimates (46). Specifically, the pooled estimate was calculated by adding one study at a time according to the year of publication.
Publication bias was evaluated using contour-enhanced funnel plots, Egger linear regression test, and Begg rank correlation test, with significance set to P < 0.10 (47‒49). When a possible publication bias was identified, we used the trim and fill method for adjustment (50). All statistical analyses were performed using Stata software (version 11.0; Stata Corp, College Station, TX) and R software (version 3.4.0; R Foundation, Vienna University of Economics and Business, Vienna, Austria). Except where noted otherwise, all tests were two tailed, and statistical significance was defined as P < 0.05.
Results
Study characteristics
Of the 6545 articles identified (1231 from PubMed, 2143 from Web of Science, and 3171 from EMBASE), we excluded duplicates and studies that did not fulfill the aforementioned criteria (Fig. 1). The final sample in the current meta-analysis included 15 studies with 17 reports (3–7, 10–19). The descriptive characteristics of included studies are presented in Table 1 and in an online repository (51), as is the BMI range and age information (51). These prospective studies were published from 2004 through 2017, with mean/median follow-up ranging from 2.8 to 16.8 years. Four of these studies were performed in the United States (4–7), five in Europe (3, 11, 12, 14, 17), and six in Asia (10, 13, 15, 16, 18, 19). The studies included a total of 77,352 participants (52,723 men and 24,629 women) and 18,404 T2D cases. Study quality scores ranged from 6 to 9, and the mean quality score was 7.7 (51).
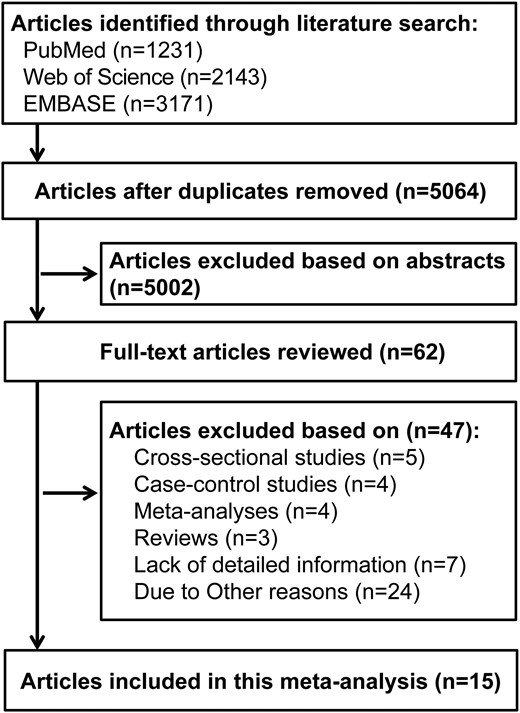
Flowchart depicting the literature search and selection strategy.
Characteristics of Studies (n = 15) Included in the Systematic Meta-Analysis of Association Between Circulating Ferritin Level and Type 2 Diabetes Risk
| Author(s), Year | Study Design | Location | Study Name | Sex | Age (y) | Follow-Up (y) | Case (Sample Size) | Quality Score |
|---|---|---|---|---|---|---|---|---|
| Akter et al., 2017 (10) | Nested case-control | Japan | Hitachi Health Study (HHS) | 90% M | 51.4 ± 7.3 | 5 | 327 (968) | 8 |
| Aregbesola et al., 2013 (11) | Cohort | Finland | Kuopio Ischaemic Heart Disease Risk Factor (KIHD) study | M | 52.5 ± 5.7 | 16.8 | 331 (1613) | 9 |
| Arija et al., 2014 (12) | Nested case-control | Spain | Prevención con Dieta Mediterránea (PREDIMED) | 47% M | 55–80 | 6 | 153 (459) | 7 |
| Forouhi et al., 2007 (3) | Nested case-control | United Kingdom | European Prospective Investigation of Cancer (EPIC), Norfolk Study | 58% M | 40–74 | 5.1 | 360 (1118) | 8 |
| Gao et al., 2017 (13) | Cohort | China | Chinese Multi-Provincial Cohort Study (CMCS) ‒ Beijing Project | 41% M | 40–74 | 10 | 205 (1660) | 9 |
| Huth et al., 2015 (14) | Cohort | Germany | Cooperative Health Research in the Region of Augsburg (KORA) F4 study | 47% M | 25–74 | 7 | 315 (2414) | 7 |
| Jehn et al., 2007 (4) | Case cohort | United States | Atherosclerosis Risk in Communities (ARIC) study | 40% M | 45–64 | 7.9 | 599 (1190) | 9 |
| Jiang et al., 2004 (5) | Nested case-control | United States | Nurses’ Health Study (NHS) | W | 30–55 | 10 | 698 (1414) | 7 |
| Jung et al., 2013 (15) | Cohort | Korea | Not available | M | 51.2 ± 8.4 | 4 | 186 (2029) | 8 |
| Kim et al., 2015 (16) | Cohort | Korea | Not available | M | 42.9 ± 7.2 | 3.75 | 2655 (30,002) | 7 |
| Le et al., 2008 (6) | Cohort | United States | Aerobics Center Longitudinal Study (ACLS) | M | 48.1 ± 9.2 | 4.6 | 167 (3615) | 6 |
| W | 48.6 ± 9.9 | 4.5 | 53 (1686) | |||||
| Podmore et al., 2016 (17) | Case cohort | Denmark, France, Germany, Greece, Italy, Netherlands, Norway, Spain, Sweden, United Kingdom | European Prospective Investigation into Cancer and Nutrition (EPIC), InterAct study | 38% M | 20–80 | 11.7 | 11,052 (25,456) | 8 |
| Rajpathak et al., 2009 (7) | Nested case-control | United States | Diabetes Prevention Program (DPP) | 36% M | 50.4 ± 0.6 | 2.8 | 280 (560) | 6 |
| Sun et al., 2013 (19) | Cohort | China | Nutrition and Health of Aging Population in China (NHAPC) study | 43% M | 50–70 | 6 | 538 (2198) | 8 |
| Wang et al., 2017 (18) | Nested case-control | Singapore | Singapore Chinese Health Study (SCHS) | 44% M | 45–74 | 6.5 | 485 (970) | 8 |
Age: mean ± STD or range; Follow-up: mean/median; Case (Sample Size): number.
Abbreviations: M, Men; W, Women.
Circulating ferritin levels and T2D risk
Compared with patients in the lowest category, both men and women in the highest category had a 54% increased risk of T2D associated with circulating levels of ferritin (RR, 1.54; 95% CI, 1.32 to 1.79) (51). When treated as a continuous variable, each 100-μg/L increment in ferritin concentration had an RR of 1.22 (95% CI, 1.14 to 1.31) (Fig. 2A). However, there was some moderate between-study heterogeneity (I2 = 59.6% and I2 = 73.6% for categorical and dose-response analyses, respectively). In addition, we observed a significant positive trend for a linear association using the restricted cubic splines model (P = 0.041 for trend; P = 0.065 for nonlinearity) (Fig. 2B).
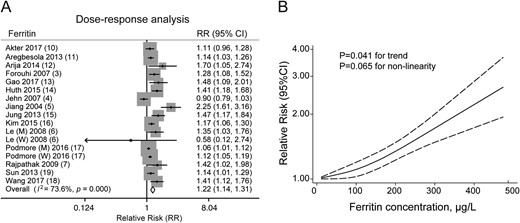
Circulating ferritin levels and the overall combined risk of type 2 diabetes in men and women. (A) Forest plot of type 2 diabetes risk per 100-μg/L increase in ferritin level. Sizes of gray diamond represent the statistical weight that each study contributed to the overall estimate. (B) Dose-response analyses of the nonlinear association between circulating ferritin concentration and the risk of type 2 diabetes.
Sex-specific analyses of circulating ferritin levels and T2D risk
Considering the physiological sex difference in circulating ferritin levels, we further investigated the sex-stratified dose-response relationship. Analyses in 12 studies involving 51,064 men and 22,878 women revealed that for each 100-μg/L increment in ferritin concentration among men, T2D risk increased by 20% (11 studies; RR, 1.20; 95% CI, 1.12 to 1.27) (Fig. 3A), with moderately high heterogeneity (I2 = 57.0%) (Fig. 3A). In contrast, with the same ferritin increment in women, T2D risk increased by 45% (nine studies; RR = 1.45; 95% CI, 1.22 to 1.72) (Fig. 3B), with high heterogeneity (I2 = 75.6%). According to the meta-regression, the sex difference for each 100-μg/L increment in circulating ferritin was insignificant (P = 0.089 for sex difference).
![Sex-specific analysis of circulating ferritin levels and type 2 diabetes risk. (A and B) Forest plots of type 2 diabetes risk per 100-μg/L increase in circulating ferritin level in (A) men and (B) women. (C and D) Forest plots of type 2 diabetes risk per 100-μg/L increase in circulating ferritin level in (C) men and (D) women [excluding the study by Podmore et al. (17)]. Sizes of gray diamond represent the statistical weight that each study contributed to the overall estimate. (E) Sex-specific dose-response analysis of the nonlinear association between circulating ferritin concentration and the risk of type 2 diabetes. Green dashed line represents reference line that RR=1.](https://oup.silverchair-cdn.com/oup/backfile/Content_public/Journal/jcem/104/10/10.1210_jc.2019-00495/1/m_jc.2019-00495f3.jpeg?Expires=1747876323&Signature=nNxq7x9kI41CDQczUl5b6TzeLzn4BaxHjtBdfdzFCZrAjwrlcXD~6q95mhRoB8e2aFkL8iAGqHL06fVg0-PoAcvTL8clsFLhuqsNqqZ0pltxfEIMo0eAKY3ZjW0NxIr9vNBONt1NhYxI-41urRlQeF4IIXJObeCWWDWBiI~BstxmFzeYmo-vWY3~rMN~VI~rU0zaXlm3Q1P-KM7wBkxXoOASLZGe~87mxSa7gHoiiTJIqWsbjGLf94zjFdS9JE1x-iNPyRaVGYjuheo4~4LCLvtg~MXkjfyApN3lxMBKBISk2zjHy96gNA4j-f9V3cqTwZJ0UQG57RTCoajrMH9gSw__&Key-Pair-Id=APKAIE5G5CRDK6RD3PGA)
Sex-specific analysis of circulating ferritin levels and type 2 diabetes risk. (A and B) Forest plots of type 2 diabetes risk per 100-μg/L increase in circulating ferritin level in (A) men and (B) women. (C and D) Forest plots of type 2 diabetes risk per 100-μg/L increase in circulating ferritin level in (C) men and (D) women [excluding the study by Podmore et al. (17)]. Sizes of gray diamond represent the statistical weight that each study contributed to the overall estimate. (E) Sex-specific dose-response analysis of the nonlinear association between circulating ferritin concentration and the risk of type 2 diabetes. Green dashed line represents reference line that RR=1.
Sensitivity analyses and sex difference in circulating ferritin level and T2D risk
To explore the sources of heterogeneity, we conducted further sensitivity analyses. In the sensitivity analyses, omitting a single study did not substantially alter the magnitude of the association and the significance of the primary results except for Podmore et al. (17) [see online repository (51)]. The heterogeneity decreased substantially after this study was excluded, from 57.0% to 8.9% in men and from 75.6% to 54.6% in women (51). In the remaining studies involving 41,512 men and 6974 women, each 100-μg/L increment in ferritin concentration had an RR of 1.21 (95% CI, 1.15 to 1.27) in men (Fig. 3C) and 1.53 (95% CI, 1.29 to 1.82) in women (Fig. 3D), consistent with the results before exclusion of a study with high heterogeneity (Fig. 3A and 3B). Furthermore, the sex difference for circulating ferritin level became significant from meta-regression (P = 0.020 for sex difference). In addition, the magnitude of association and heterogeneity did not change substantially after exclusion of a large-scale study that included only male participant (16).
Meanwhile, in the plots of the cumulative meta-analysis by year of publication, we observed significant and consistent trends toward increased T2D risk with high ferritin level over time (51). For the comparison between highest and lowest categories, the cumulative association was significant beginning in 2013 (i.e., after the addition of Agregbesola et al. 2013) (51). A similar pattern was observed for the combined dose-response analysis (51). When the dose-response analysis was stratified by sex, the magnitude of the association decreased over time for analyses conducted among women but remained statistically significant (51). In men and women, both trends stabilized even earlier (i.e., before 2013) (51).
Restricted cubic spline analysis
Nonlinear analyses also revealed a significant sex-specific association in the dose-response pattern. A positive trend for a nonlinear association that ranged from 30 to 600 μg/L was observed among men (P = 0.033 for trend; P = 0.018 for nonlinearity) (Fig. 3E). Of note, the lower confidence limit values were very close to the reference line with the ferritin level below 140 μg/L; they then rose obviously when the ferritin level was >140 μg/L (51). In contrast, among women a stronger linear association for ferritin was observed from the pooled RR estimates. In a linear association that ranged from 10 to 300 μg/L (P = 0.008 for trend; P = 0.932 for nonlinearity) (Fig. 3E), the estimated RRs with corresponding 95% CIs rose monotonically and were consistently higher than in men with the same ferritin levels. The lower confidence limit distinctly deviated from the reference line almost from the start of the curve (51).
Subgroup analyses
With the exception of the sensitivity analyses, we conducted subgroup analyses and meta-regression analyses based on the results of dose-response analyses to determine potential sources of heterogeneity (Table 2 and Table 3). Among overall participants, subgroup analyses showed no apparent regional differences among United States, European, and Asian populations in these studies (Table 2). In sex-specific analyses, the geographic location of studies modified the association between ferritin levels and the risk for T2D in women (P = 0.022 for interaction). Positive associations in women were significant in the Asian (RR, 1.29; 95% CI, 1.13 to 1.47) and European (RR, 1.61; 95% CI, 1.34 to 1.94) studies, but not in the US studies (RR, 1.43; 95% CI, 0.41 to 5.00). This may be attributed to the observed heterogeneity of US studies in the sex-stratified result for women (I2 = 64.4%) (Table 3). Further subgroup analyses were conducted on follow-up duration, ferritin assay, study design, study size, blood sample source, diabetes diagnosis criteria, and adjustments for many other potential confounders including age, BMI, smoking, alcohol, physical activity, hypertension and family history of diabetes, liver enzymes, and metabolic syndrome components. The pooled estimates for the associations of circulating ferritin level and risk of T2D did not substantially change (Tables 2 and 3).
Subgroup Analyses of Associations Between Circulating Ferritin Level and T2D Risk in Overall Participants (per 100 μg/L Increase in Ferritin Level)
| Overall Participants | |||||
|---|---|---|---|---|---|
| N | RR (95% CI) | I2 (%) | P Value | ||
| Location | 0.940 | ||||
| United States | 5 | 1.32 (0.90–1.95) | 87.1 | ||
| Europe | 6 | 1.17 (1.08–1.27) | 69.0 | ||
| Asia | 6 | 1.23 (1.12–1.34) | 42.8 | ||
| Sample size | 0.203 | ||||
| ≥10,000 | 3 | 1.10 (1.05–1.16) | 46.5 | ||
| <10,000 | 14 | 1.29 (1.16–1.44) | 73.5 | ||
| Follow-up time, y | 0.921 | ||||
| ≥10 | 5 | 1.21 (1.08–1.35) | 83.1 | ||
| <10 | 12 | 1.23 (1.12–1.36) | 66.2 | ||
| Ferritin assessment | 0.908 | ||||
| Immunoturbidimetric assay | 5 | 1.33 (1.02–1.73) | 87.5 | ||
| Chemiluminescence immunoassay | 7 | 1.18 (1.09–1.28) | 70.2 | ||
| Other | 5 | 1.23 (1.12–1.36) | 18.9 | ||
| Study design | 0.143 | ||||
| Cohort | 8 | 1.24 (1.14–1.34) | 38.2 | ||
| Nested case-control | 6 | 1.42 (1.18–1.71) | 70.6 | ||
| Case cohort | 3 | 1.04 (0.96–1.14) | 76.2 | ||
| Blood sample | 0.780 | ||||
| Serum | 12 | 1.20 (1.12–1.28) | 60.5 | ||
| Plasma | 5 | 1.32 (1.02–1.69) | 87.8 | ||
| Diabetes criteria | 0.921 | ||||
| NDDG-1979 + ADA-1997 | 1 | 2.25 (1.61–3.16) | NA | ||
| ADA-1997 or WHO-1999 | 12 | 1.21 (1.11–1.33) | 65.1 | ||
| Unspecified | 4 | 1.15 (1.05–1.26) | 69.5 | ||
| Adjusted body mass index | 0.118 | ||||
| Yes | 14 | 1.19 (1.11–1.27) | 73.7 | ||
| No | 3 | 1.50 (1.26–1.78) | 0.0 | ||
| Adjusted smoking and alcohol | 0.388 | ||||
| Yes | 13 | 1.20 (1.12–1.29) | 77.5 | ||
| No | 4 | 1.39 (1.17–1.65) | 0.0 | ||
| Adjusted family history | 0.165 | ||||
| Yes | 9 | 1.32 (1.18–1.48) | 67.2 | ||
| No | 8 | 1.15 (1.05–1.25) | 74.5 | ||
| Adjusted physical activity and exercise | 0.437 | ||||
| Yes | 13 | 1.23 (1.15–1.33) | 72.7 | ||
| No | 4 | 1.16 (0.84–1.60) | 77.6 | ||
| Adjusted liver enzymes | 0.452 | ||||
| Yes | 9 | 1.18 (1.11–1.26) | 65.0 | ||
| No | 8 | 1.34 (1.09–1.65) | 81.1 | ||
| Adjusted hypertension | 0.414 | ||||
| Yes | 7 | 1.18 (1.05–1.33) | 75.0 | ||
| No | 10 | 1.27 (1.15–1.40) | 75.3 | ||
| Adjusted metabolic syndrome multicomponents | 0.924 | ||||
| Yes | 11 | 1.23 (1.11–1.37) | 69.4 | ||
| No | 6 | 1.21 (1.09–1.35) | 80.1 | ||
P value for heterogeneity between subgroups with meta-regression analysis.
Abbreviations: ADA, American Diabetes Association; N, study number; NA, not available; NDDG, National Diabetes Data Group; WHO, World Health Organization.
Subgroup Analyses of Associations Between Circulating Ferritin Level and T2D Risk in Men and Women (per 100 μg/L Increase in Ferritin Level)
| Men | Women | |||||||
|---|---|---|---|---|---|---|---|---|
| N | RR (95% CI) | I2 (%) | P Value | N | RR (95% CI) | I2 (%) | P Value | |
| Location | 0.610 | 0.022 | ||||||
| United States | 1 | 1.35 (1.03–1.76) | NA | 2 | 1.43 (0.41–5.00) | 64.4 | ||
| Europe | 4 | 1.21 (1.13–1.31) | 13.4 | 3 | 1.61 (1.34–1.94) | 0.0 | ||
| Asia | 5 | 1.21 (1.11–1.31) | 29.8 | 3 | 1.29 (1.13–1.47) | 0.0 | ||
| Study design | 0.622 | 0.302 | ||||||
| Cohort | 6 | 1.20 (1.13–1.28) | 24.2 | 3 | 1.35 (0.98–1.87) | 64.4 | ||
| Nested case-control | 4 | 1.23 (1.13–1.35) | 0.0 | 5 | 1.64 (1.36–1.98) | 28.7 | ||
| Blood sample | 0.850 | 0.912 | ||||||
| Serum | 8 | 1.21 (1.15–1.28) | 11.4 | 5 | 1.56 (1.32–1.85) | 0.0 | ||
| Plasma | 2 | 1.22 (1.04–1.42) | 48.2 | 3 | 1.54 (1.12–2.15) | 82.1 | ||
| Diabetes criteria | 0.474 | 0.641 | ||||||
| NDDG-1979 + ADA-1997 | 0 | NA | NA | 1 | 2.25 (1.61–3.16) | NA | ||
| ADA-1997 or WHO-1999 | 8 | 1.20 (1.13–1.27) | 18.4 | 5 | 1.42 (1.12–1.80) | 45.7 | ||
| Unspecified | 2 | 1.26 (1.12–1.41) | 0.0 | 2 | 1.47 (1.22–1.77) | 0.0 | ||
| Adjusted family history | 0.362 | 0.923 | ||||||
| Yes | 6 | 1.19 (1.11–1.28) | 22.9 | 5 | 1.56 (1.20–2.03) | 67.9 | ||
| No | 4 | 1.24 (1.16–1.33) | 0.0 | 3 | 1.55 (1.28–1.88) | 5.2 | ||
| Adjusted liver enzymes | 0.867 | 0.074 | ||||||
| Yes | 7 | 1.21 (1.14–1.28) | 20.5 | 5 | 1.40 (1.23–1.60) | 26.1 | ||
| No | 3 | 1.23 (1.10–1.38) | 13.8 | 3 | 1.99 (1.28–3.11) | 28.7 | ||
| Adjusted hypertension | 0.730 | 0.702 | ||||||
| Yes | 6 | 1.20 (1.13–1.27) | 8.3 | 4 | 1.58 (1.34–1.86) | 0.0 | ||
| No | 4 | 1.24 (1.12–1.37) | 30.1 | 4 | 1.48 (1.06–2.07) | 75.6 | ||
| Adjusted metabolic syndrome multicomponents | 0.519 | 0.909 | ||||||
| Yes | 8 | 1.23 (1.15–1.31) | 21.9 | 5 | 1.56 (1.32–1.84) | 0.0 | ||
| No | 2 | 1.17 (1.07–1.28) | 0.0 | 3 | 1.55 (1.10–2.18) | 82.0 | ||
P value for heterogeneity between subgroups with meta-regression analysis.
Abbreviations: ADA, American Diabetes Association; N, study numbers; NA, not available; NDDG, National Diabetes Data Group; WHO, World Health Organization.
Publication bias
Using Egger linear regression test and Begg rank association test, we found evidence of publication bias, which was consistent with the results shown by funnel plots (51). Therefore, we used the trim and fill method to recalculate the risk estimate. Recalculated estimates were similar to original results and remained statistically significant, suggesting that the observed publication bias did not likely affect the overall results (51).
Discussion
In this meta-analysis of 15 prospective studies comprising a total of 555,912 person-years (77,352 participants and 18,404 T2D cases), higher circulating ferritin levels were directly associated with greater T2D risk. These results are consistent with those reported in previous meta-analyses (23–26). In addition, we observed significant sex differences for the association between circulating ferritin levels and risk of T2D (41,512 men and 6974 women for sex-specific analyses) after excluding a study that introduced high heterogeneity (17). Elevated ferritin levels appeared to increase T2D risk in a dose-response manner, particularly in women whose T2D risk was twice as strong as that of men at the same ferritin increment.
Previous studies on the influence of sex on the association between serum ferritin level and diabetes are rather inconsistent. Some studies suggested that these discrepancies may be the result of differences in the ethnic composition of study populations (8, 32). After systematic evaluation of previous prospective studies investigating the relationship between circulating ferritin levels and T2D risk, our results showed no apparent difference of geographic locations on the association between circulating ferritin and T2D risk in overalll participants. However, subgroup heterogeneity was observed in women with stratification by study region, which significantly modified the association between ferritin and T2D risk in women but not in men. Compared with heterogeneous US studies (I2 = 64.4%), European and Asian study groups showed no heterogeneity (I2 = 0%) in the sex-stratified result in women. The moderately high heterogeneity in the US study group may partially explain the observed geographic effect on ferritin and T2D risk in women. Ethnic differences across populations could also be a reason for the regional effect, in that the association between serum ferritin level and T2D has been reported to differ significantly between ethnic groups among women but not among men (32). Because of the relatively small number of studies included in these subgroup analyses, genetic or other factors may also play a role. In any event, additional large cohort studies are warranted to validate these findings. The ferritin-T2D associations were robust in various sensitivity analyses and persisted with stratification by multiple study characteristics, including adjustment for potential confounders; this suggests that elevated circulating ferritin level was probably an independent risk factor for T2D in both men and women.
Evidence indicated that inflammation plays an important role in the regulation of ferritin synthesis and secretion (52), which was regarded as a major confounder in previous studies (3, 5, 53). All 15 studies included in our meta-analysis were adjusted for inflammatory markers (including C-reactive protein, fibrinogen, adiponectin, IL-6, IL-18, and white blood cells), which supports the notion that the direct relationship between circulating ferritin level and T2D risk is independent of inflammation. Moreover, liver enzymes (γ-glutamyl transpeptidase, aspartate aminotransferase, and alanine aminotransferase), metabolic syndrome components (triglycerides, cholesterol, high-density lipoprotein cholesterol, low-density lipoprotein cholesterol, waist circumference, hypertension, fasting glucose level, and fasting triglyceride level), and BMI could be potential confounders in the risk estimation for T2D (4, 54, 55). The positive association between circulating ferritin levels and T2D risk was not attenuated by liver enzymes, metabolic factor, and BMI adjustments, also suggesting that the observed association was independent of these factors. Cumulative meta-analysis showed that the pooled association between ferritin and T2D risk became significant from 2013 onward and even earlier when the results were stratified by sex, indicating that the differential extent of ferritin on T2D risk by sex may mask the association and delay the discovery of this clinically important finding.
From a clinical perspective, circulating ferritin level may be a means for predicting diabetes risk among men and women in the future. For most people, circulating levels of the iron storage protein ferritin are usually proportional to body iron stores (28). The consistent finding of significant associations of circulating ferritin with T2D development, even after adjustment for multiple confounders, suggests possible clinical applications of circulating ferritin level to provide predictive information beyond body iron status.
Sex differences have been reported in the association of serum ferritin level with fasting glucose level and insulin resistance (5, 8, 9, 56). Several studies have associated serum ferritin levels with insulin resistance and T2D risk in men and postmenopausal women (34, 57). The reference levels for serum ferritin are wide, from 30 to 300 µg/L in men and from 15 to 200 µg/L in women. Ferritin levels increase from childhood into adulthood, reaching a plateau in adult men of ∼120 µg/L. Values remain low in women, around 30 µg/L until menopause, when the values increase to ∼80 µg/L (58, 59). The production of estrogen declines during menopause, when menstrual blood loss ceases, resulting in a rise in ferritin levels and oxidative stress that may increase T2D risk (60). Therefore, women have physiologically lower levels of ferritin, especially in the premenopausal period. That may partially explain our sex-specific dose-response results, which showed that at the same dose increment, circulating ferritin levels apparently were associated with higher risk of T2D among women than among men. In the restricted cubic spline analysis, a nonlinear relationship was observed in men, with the risk increasing slowly around a ferritin level of 140 μg/dL and more steeply at higher ferritin levels. In contrast, for women T2D risk rose monotonically from the starting point, with a linear shape always over the curve for men, indicating a stronger association in women.
Specific mechanisms linking body iron stores to T2D risk remain incompletely understood, although at least four main pathways have been proposed. First, iron induces hydroxyl radicals that attack pancreatic β cells, leading to impaired insulin synthesis and excretion (61). Second, iron accumulation in the liver may trigger liver insulin resistance by impairing hepatic insulin extraction and increasing hepatic glucose output (62, 63). Third, excess iron may diminish glucose utilization in muscle and influence glucose uptake in adipose tissue, leading to insulin resistance (64, 65). Finally, ferroptosis is a recently identified form of cell death that is morphologically, biochemically, and genetically distinct from other types of cell death. It is defined mainly as the iron-dependent accumulation of lipid reactive oxygen species (66). Although the role of ferroptosis in diabetes development has yet to be defined, prior preclinical studies have provided crucial clues. For example, pancreatic β cells are particularly susceptible to oxidative stress because of their weak antioxidant defense; this could be rescued, however, by overexpressing the ferroptosis regulatory gene GPX4 (67–69). In a recent study, human islets were shown to be susceptible to ferroptosis-inducing agents, and this effect could be abolished by ferroptosis inhibitors (70). These results suggest that ferroptosis exists in reactive oxygen species‒induced β-cell dysfunction.
The exact biological mechanisms for sex-dimorphic associations between circulating ferritin level and risk of T2D remain to be determined; however, some studies have suggested that sex differences may exist because of differences in iron accumulation in the peripheral muscles, which may cause derangement of muscle glucose uptake due to muscle damage (71, 72). Elevated plasma ferritin concentration has also been shown to contribute to insulin resistance in women with obesity by increasing systemic fatty acid availability (72). Furthermore, as we mentioned previously, increased circulating ferritin levels may represent accumulation of body iron, which could bring about oxidative stress. Animal experiments have reported that under obesogenic diet treatment, brown adipose tissue of male rats showed enhanced mitochondrial functionality and oxidative capacity, which could improve protection against oxidative damage and impairment of insulin signaling relative to that of females (73, 74). Variations in the ferritin level between sexes are thought to contribute to variability in oxidative stress level, and female athletes are more susceptible to oxidative stress (31). Taken together, evidence from laboratory experiments and observational studies in humans seem to support a likely casual sex-dimorphic association between circulating ferritin level and risk of T2D.
Our study included many relevant studies and provided adequate statistical power to assess a potentially modest but true association. Furthermore, the large number of studies permitted us to conduct a sex-specific assessment and explore many sources of between-study heterogeneities. However, several limitations must be kept in mind when interpreting these findings. First, because of limited numbers of included studies containing menopause status, we were unable to reach a conclusion about the effect of menopause status on the ferritin-T2D association. Second, there were substantial heterogeneities in the relationship of ferritin levels to T2D risk across studies, although heterogeneities were substantially reduced in the sex-specific analysis, especially after the exclusion of the study by Podmore et al. (17). Podmore et al. analyzed data from EPIC, which involved a geographically mixed population with an extended age range (20 to 80 years) and variations in the characteristics of study populations, including participants with clinically high ferritin levels (≥1000 µg/L or with hemochromatosis), which may partially explain the heterogeneity (75, 76). Moreover, although only prospective studies were included in this study, the causal effect of iron status on T2D cannot be determined because of inherent limitations with observational data. There was an indication for the presence of publication bias, but it did not appear to affect the overall findings after adjustment by the trim and fill method. Third, insufficient studies precluded further assessment of the relationship between other iron markers and risk of T2D. For instance, serum concentrations of soluble transferrin receptor (sTfR), transferrin, and transferrin saturation have been suggested as optional iron markers in the context of T2D (23, 25). Because TfR could respond to iron deficiency and promote iron uptake via transferrin-TfR complex, the levels of sTfR will be increased in an iron-deficient individual. Circulating sTfR has been suggested as a diagnostic biomarker for iron deficiency, whereas the serum concentration of transferrin is proportional to the total iron-binding capacity, and transferrin saturation (a percentage of the total iron-binding capacity) is a useful indicator of iron overload and iron deficiency (77–81). The intrinsic causal relationships between these iron markers and T2D risk require further clarification in large prospective studies. Lastly, because of relatively small numbers of studies available in the subgroups and high heterogeneity across studies in the evaluation of the association in men and women, the sex-specific association warrants further clarification in more prospective studies.
In conclusion, our meta-analysis showed that increasing circulating ferritin levels obviously heightened the risk of T2D in both sexes. Sex-specific analysis showed that increased levels of ferritin appeared to have a greater effect on T2D risk in women than in men. Our results suggest that circulating ferritin levels may offer a means for prediction of T2D risk in a sex-specific manner. These findings highlight the importance of investigating the sex-specific etiologies of T2D and its associated complications. In the design of future large prospective studies and randomized controlled trials, more attention should be given to sex-dependent relationships to better understand the association of circulating ferritin level with future risk of T2D and to clarify the clinical or public health relevance of the findings in diverse populations. The added predictive power for diabetes when ferritin assessment is put into the clinical risk score also warrants further investigation.
Acknowledgments
We thank Dr. Simin Liu at Brown University for helpful discussions and revisions.
Financial Support: This study was supported by research grants from the National Natural Science Foundation of China (31530034 to F.W.; 31570791 and 91542205 to J.M.) and the National Key Research and Development Program (2018YFA0507802 to F.W.; 2018YFA0507801 to J.M.).
Author Contributions: L.J., K.W., and F.W. conceived and designed the study. L.J. and K.W. performed the database search and checked the results against the inclusion and exclusion criteria. Y.Z., K.W., and H.A. conducted the quality assessment of the included studies. L.J., K.W., L.C., and Z.S. analyzed the data. L.J., K.W., and K.L. wrote the initial draft of the paper. F.W., J.M., A.Y., X.F., and P.A. reviewed and edited the manuscript. J.M. and M.X. revised the manuscript. All authors read and approved the final version.
Disclosure Summary: The authors have nothing to disclose.
Abbreviations:
- BMI
body mass index
- RR
relative risk
- sTfR
soluble transferrin receptor
- T2D
type 2 diabetes
References and Notes
Author notes
L.J., K.W., and K.L. contributed equally to this work.
