


Abstract
Obesity is known to impact reproductive function in adults, but little is known about its effects on reproductive hormones during puberty.
To assess sex differences in effects of obesity on reproductive hormones and their relation to insulin sensitivity and secretion.
Cross-sectional study including anthropometrics, serum and urine reproductive hormone concentrations, and intravenous glucose tolerance testing (IVGTT) to assess acute insulin response to glucose (AIRg), and insulin sensitivity (Si).
Outpatient academic clinical research center.
Girls (52%) and boys (48%) who were normal weight (NW; n = 51, BMI-Z score = −0.11 ± 0.77, age = 11.5 ± 1.7 years) and obese (n = 53, BMI-Z score = 2.22 ± 0.33, age = 10.9 ± 1.5 years), Tanner stage 2 to 3.
Boys with obesity had lower total testosterone (P < 0.0001) and higher concentrations of the urinary estradiol metabolite, E1c, (P = 0.046) than boys with NW. Girls with obesity had higher free androgen index (FAI; P = 0.03) than NW girls. Both boys and girls with obesity had lower sex hormone-binding globulin (SHBG; P < 0.0001) than NW. AIRg was inversely related to SHBG in boys (R = 0.6, P < 0.0001) and girls (R = 0.53, P = 0.0001). Si correlated with higher SHBG in boys (R2 = 0.67, P < 0.0001) and girls (R = 0.5, P = 0.0003), higher total testosterone for boys (R = 0.39, P = 0.01), and lower FAI for girls (R = −0.2, P = 0.04).
Youth with obesity have lower SHBG than youth with NW, but obesity has differential effects on reproductive hormones in girls versus boys, which are apparent early in puberty. Ongoing longitudinal studies will evaluate the impact of obesity on reproductive hormones in girls and boys as puberty progresses.
The prevalence of obesity during puberty has been increasing rapidly (1). Puberty is a critical window in reproductive and metabolic health with long-lasting effects over the lifespan. Therefore, it is critical to understand the impact of obesity during pubertal development as a risk factor for reproductive and metabolic disease. In adults, obesity is associated with reproductive dysfunction, including hypogonadism in males and females, and polycystic ovarian syndrome in females (2, 3). Obesity also appears to impact pubertal development and is known to be associated with earlier puberty in girls in cross-sectional (4, 5) and longitudinal studies (6). Results of studies evaluating the impact of obesity on male pubertal development are mixed, with some studies, primarily European, suggesting that a higher body mass index (BMI) results in earlier puberty (7–9) whereas others, primarily American, suggest later pubertal development associated with obesity (10–12). Results of a limited number of studies, largely cross-sectional, assessing differences in serum testosterone in boys with obesity versus with normal weight (NW) have been mixed, with some studies, including several from our group, showing lower total testosterone in boys with obesity (13–16) and others showing no difference (17). In girls, there is an association between obesity and hyperandrogenemia (18, 19). In addition to lack of clarity about the immediate impact of obesity on sex hormones in youth, the timing of when differences in sex hormones in youth with obesity begin to reflect patterns seen in adults is unclear.
In adolescents with NW, there is a physiologic decrease in insulin sensitivity during puberty that begins at Tanner stage (T) 2, reaches a nadir in mid- to late puberty and returns to near prepubertal levels sometime after puberty is complete (20–22). This pubertal insulin resistance is thought to play an important role in the pathophysiology of youth-onset type 2 diabetes mellitus (T2DM) in youth with obesity, which is a disease that rarely presents prior to puberty (23). Youth-onset T2DM is twice as common in girls as in boys (24), a sex difference not seen in adults. The reasons for this sex difference are unknown and there are additional knowledge gaps in how obesity impacts the relation between reproductive hormones and glucose metabolism in girls and boys, particularly in early puberty. Most studies assessing the effects of obesity on sex steroids, insulin sensitivity, and β-cell function are cross-sectional (16, 18, 25) and few involve youth in early puberty. To address these gaps, studies using rigorous measures of insulin sensitivity, β-cell function, and reproductive hormones, and including all stages of puberty are needed.
Our primary objective was to assess sex differences in the relation between obesity and reproductive hormones in early puberty. We hypothesized that there would be differences in sex steroid patterns between youth with obesity and with NW in early puberty, similar to patterns in adults, with higher bioavailable androgens in girls with obesity than those with NW and lower testosterone in boys with obesity than with NW. Given the known relations among insulin sensitivity, insulin secretion, and sex steroids in adults, we also conducted exploratory analyses to examine associations among insulin sensitivity (Si), insulin secretion [acute insulin response to glucose (AIRg)], and sex steroids in early pubertal youth.
Methods
Participants
Girls and boys with and without obesity in early puberty (T2 to T3) were recruited between 2009 and 2015 for the Health Influences of Puberty (HIP) Study, a longitudinal study evaluating the effects of obesity on glucose metabolism during puberty. Recruitment took place in the primary care and multidisciplinary obesity clinics at Children’s Hospital Colorado, as well as from local pediatric clinics through advertisements. The study was approved by the Colorado Multiple Institutional Review Board and consent and assent were obtained from all participants.
Youth with NW (BMI 5th to 85th percentile) and obesity (BMI ≥95th percentile) who were T2 to T3 and age ≥9 years at the time of enrollment were included. All youth with obesity were screened with an oral glucose tolerance test [1.75 g/kg of glucola (maximum 75g)]; participants with impaired fasting glucose (IFG; fasting glucose 100 to 125 mg/dL), impaired glucose tolerance (IGT; 2-hour glucose 140 to 199 mg/dL), or T2DM (fasting glucose ≥126 mg/dL, 2 hour glucose ≥200 mg/dL) using American Diabetes Association criteria (26) were excluded. Exclusion criteria for all participants also included: specific genetic syndromes or disorders known to affect glucose tolerance other than diabetes; oral steroids within the last 60 days or high-dose inhaled (>1000 μg daily) steroids; medication(s) that are known to cause weight gain or weight loss, including atypical antipsychotics; insulin sensitizer use within the last year; use of anabolic steroids; hypertension or hyperlipidemia requiring pharmacological intervention; proteinuria; weight >300 pounds (because of dual-energy x-ray absorptiometry limits); or other organ system illness or condition (including psychiatric or developmental disorder) that would prevent full participation. Participants without obesity were not screened for IGT, IFG, or T2DM but were excluded for a known diagnosis of diabetes mellitus.
The screening visit also included pubertal staging, performed by a pediatric endocrinologist. Puberty was assessed using the standards of Tanner and Marshall for breast development in girls (using inspection and palpation), genital development in boys, and pubic hair in boys and girls (27, 28). Because of the subjectivity of Tanner genital staging for boys, testicular volume was also assessed using a Prader orchidometer and assigned a Tanner stage equivalent as follows: T1 < 4 mL; T2 ≥ 4 mL and < 8; T3 ≥ 8 and < 12 mL; T4 ≥ 12 and ≤ 15 mL; T5 > 15 mL. Girls and boys needed to be T2 or more for breast development or testicular volume, respectively, and no more than T3 for breast development, testicular volume, or pubic hair to be eligible for study entry. Breast development and testicular volume took priority over pubic hair for assignment of Tanner stage.
Research visit
Approximately three weeks after the screening visit, participants were admitted to the Children’s Hospital Colorado Clinical and Translational Research Center after a three-day standard macronutrient diet (55% carbohydrates, 30% fat, and 15% protein) provided by the metabolic kitchen and after three days of restriction of vigorous physical activity. Participants fasted overnight prior to admission. Height was measured on a Harpenden stadiometer and weight on a digital electronic scale. Height and weight were recorded to the nearest 0.1 cm and kilogram, respectively. Serum and plasma were drawn on a morning fasting sample for the following assays: glucose, insulin, dehydroepiandrosterone sulfate (DHEA-S), estradiol, total testosterone, and sex hormone-binding globulin (SHBG).
Participants then underwent a frequently sampled intravenous glucose tolerance test (IVGTT): participants had an IV catheter inserted into each arm. Baseline blood samples were drawn for fasting plasma glucose and serum insulin. Participants then had an infusion of 0.3 g/kg of 25% dextrose given over 90 seconds. Glucose and insulin concentrations were sampled from the IV in the contralateral arm at times 2, 3, 4, 5, 6, 8, 10, 12, 14, 16, 19, 22, 25, 30, 35, 40, 50, 60, 70, 80, 90, 100, 120, 140, 160, and 180 minutes. Bergman minimal model program was used to calculate Si, AIRg, and the disposition index (DI) (29). Dual-energy x-ray absorptiometry was used to measure percent fat mass.
Laboratory assays
Laboratory assays were performed by the University of Colorado Anschutz Clinical and Translational Research Center core laboratory. Glucose was measured by enzymatic ultraviolet testing (AU480 Chemistry Analyzer, Beckman Coulter, Brea, CA), inter- and intra-assay coefficient of variation (CV) 1.44% and 0.67%, respectively, and sensitivity 10 mg/dL. Insulin was measured by radioimmunoassay (EMD Millipore, Darmstadt, Germany), inter- and intra-assay CV 9.8% and 5.2%, respectively, and sensitivity 3 μIU/mL. DHEA-S was measured by chemiluminescence (Beckman Coulter), inter- and intra-assay CV 3.4% and 2.3%. respectively, and sensitivity 2 μg/dL. Estradiol was measured by chemiluminescence (Beckman Coulter), inter- and intra-assay CV 8.2% and 4.3%, respectively, and sensitivity 10.0 pg/mL. SHBG was measured by chemiluminescence (Beckman Coulter), inter- and intra-assay CV 5.7% and 3.6%, respectively, and sensitivity 3 nmol/L. Total testosterone was measured by chemiluminescence of serum (Beckman Coulter), inter- and intra-assay CV 5.1% and 2.1%, respectively, and sensitivity 17 ng/dL. Free androgen index (FAI) was calculated as the ratio of total testosterone to SHBG [(testosterone/SHBG)*100].
Urine studies included follicle-stimulating hormone (FSH), luteinizing hormone (LH), and estrone metabolites (E1c, a mixture of estrone sulfate and estrone glucuronide) were measured by dissociation-enhanced lanthanide fluorescence immunoassay (DELFIA) immunoflourometric assay platform (in-house ELISA) on first morning urine sample and normalized to creatinine (30, 31). FSH (mLU/mgCr), inter- and intra-assay CV 6.6% and 5.0%, respectively, and sensitivity 0.98 IU/L. LH (mLU/mgCr), inter- and intra-assay CV: 4.8% and 3.4%, respectively, and sensitivity 0.57 IU/L. E1c (ng/mgCr), inter- and intra-assay CV 6.8 and 2.2%, respectively, and sensitivity 1 pg per well (32).
Statistical methods
Descriptive statistics were calculated and groups (NW vs obese) were compared using linear regression models adjusted for pubertal stage. Variables were assessed for normality and after evaluating diagnostics, AIRg and Si were log-transformed. Univariable linear regression models were used to examine the associations between outcomes (Si, AIRg, DI, and BMI-Z score) and predictors (E1c, total testosterone, FAI, LH, FSH, and SHBG). Pearson correlations were used to examine associations between BMI-Z score and Si, AIRg, and DI. Because of cohort differences in racial/ethnic composition in NW and youth with obesity, all analyses were performed with and without adjustment for race/ethnicity. Analyses were conducted using SAS version 9.4 (SAS Institute, Cary, NC). BMI-Z score was calculated using the US Centers for Disease Control and Prevention SAS code. This was a secondary analysis of effects of obesity on reproductive hormones in a study that was primarily designed to evaluate effects of obesity on glucose metabolism during puberty, and therefore no adjustments were made for multiple testing.
Results
Demographic characteristics by group are in Table 1. Fifty boys (27 NW, 23 obese, average age 12.3 ± 1.4 years) and 54 girls (24 NW, 30 obese, average age 10.2 ± 1.0 years) completed the study visit. Youth with and without obesity were similar for age and Tanner stage distribution within each sex. There were substantial differences for race among boys and ethnicity among girls between the cohorts with and without obesity, with more minority representation in the participants with obesity.
Baseline Demographics and Laboratory Values for Boys and Girls Who Are NW or Obese
| Variable | Girls (n = 54) | P | Boys (n = 50) | P | ||
|---|---|---|---|---|---|---|
| NW (n = 24) | Obese (n = 30) | NW (n = 27) | Obese (n = 23) | |||
| Median (IQR) | Median (IQR) | Median (IQR) | Median (IQR) | |||
| Age, y | 10 (10, 11) | 10 (9, 11) | 0.13 | 12 (12, 14) | 12 (11, 13) | 0.23 |
| Tanner stage, n, % | T2: 14 (58.3) | T2: 17 (56.7) | 0.90 | T2: 18 (66.7) | T2: 17 (73.9) | 0.58 |
| T3: 10 (41.7) | T3: 13 (43.3) | T3: 9 (33.3) | T3: 6 (26.1) | |||
| Race, n, % | 0.23 | 0.0005 | ||||
| White | 14 (58.3) | 22 (73.3) | 18 (66.7) | 18 (78.3) | ||
| Black | 7 (29.2) | 3 (10.0) | 3 (11.1) | 3 (13.0) | ||
| Other | 3 (12.5) | 5 (16.7) | 6 (22.2) | 2 (8.7) | ||
| Ethnicity, n, % | 0.01 | 0.44 | ||||
| Hispanic | 10 (41.7) | 23 (76.7) | 5 (18.5) | 16 (69.6) | ||
| Non-Hispanic | 12 (50.0) | 7 (23.3) | 21 (77.8) | 7 (30.4) | ||
| Unknown | 2 (8.3) | 0 | 1 (3.7) | 0 | ||
| BMI pecentilea | 48.4 (27.6, 65.3) | 98.1 (97.2, 99.3) | <0.0001 | 47.3 (23.8, 67.7) | 98.8 (98.5, 99.5) | <0.0001 |
| BMI Z-scorea | −0.04 (-0.6, 0.4) | 2.08 (1.9, 2.5) | <0.0001 | −0.1 (-0.7, 0.5) | 2.3 (2.2, 2.6) | <0.0001 |
| Body fat (%)a | 27.2 (22.9, 32.2) | 44.3 (41.6, 47.0) | <0.0001 | 23.9 (17.2, 29.2) | 43.1 (36.4, 45.5) | <0.0001 |
| Serum estradiol (pg/mL)a,b | 17 (5, 27.5) | 11.5 (5, 24) | 0.14 | 10 (5, 18) | 10 (5, 15) | 0.93 |
| Corrected urinary FSH, mLU/mg/Cra,b,c | 9.4 (2.4) | 0.2 (2.8) | 0.01 | 4.7 (6.7) | 3.9 (0.4, 4.0) | 0.51 |
| Corrected urinary LH, mLU/mgC,a,b,c | 2.0 (0.9) | 0.01 (1.1) | 0.17 | 0.7 (0.8) | 0.8 (0.9) | 0.94 |
| DHEA-S, μg/dLa | 48 (28, 90.5) | 60 (45, 89) | 0.69 | 101 (61, 153) | 140 (96, 190) | 0.1 |
| Si, ×10-4/min-1/mIU/mL)a | 5.9 (3.9, 8.3) | 2.2 (1.5, 3.0) | 0.013 | 8.69 (4.9, 12.1) | 2.0 (1.5, 3.0) | <0.0001 |
| Insulin secretion, AIRg, µIU/mLa | 714 (314, 792) | 1923 (962, 2664) | <0.0001 | 403 (324, 629) | 1805 (1032, 3356) | <0.0001 |
| DI, ×10-4/min-1a | 3749 (2869, 4750) | 4139 (2988, 4774) | 0.35 | 3034 (2633, 5239) | 4088 (2868, 5354) | 0.62 |
P values in boldface represent statistical significance.
Abbreviation: IQR, interquartile range.
Anthropometric, hormonal, and metabolic comparisons are adjusted for Tanner stage and race/ethnicity.
Normalized to creatinine.
Least squared mean (SE).
Relation of obesity to reproductive hormones and SHBG
Baseline hormone concentrations are shown in Table 1. As shown in Fig. 1, boys with obesity had lower SHBG [median, (interquartile range), 18 (14, 24) nmol/L vs 57 (47, 73), P < 0.0001], lower total testosterone [47 (23, 90) ng/dL vs 81 (48, 296), P < 0.0001], and higher urinary E1c [11.3 (6.7, 26.5) ng/mgCr vs 6.2 (0.9, 7.4), P = 0.046] than boys with NW, but there was no difference in FAI [213.6 (156.3, 360.0) vs 164.8 (64.8, 416.9), P = 0.9].
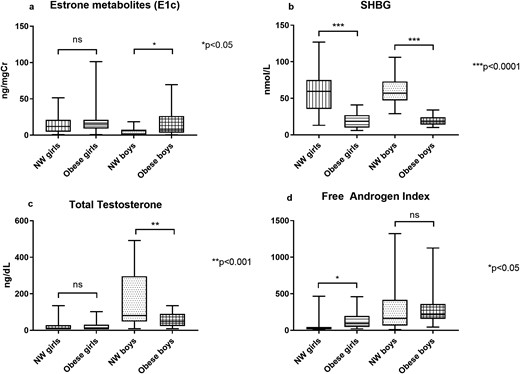
The box plots show the minimum, 25th percentile, median, 75th percentile, and maximum values for: (a) E1c, (b) SHBG, (c) total testosterone, and (d) FAI for girls and boys with NW and obesity. *P < 0.05, **P < 0.001, ***P < 0.0001. ns, not significant.
Girls with obesity also had lower SHBG [18.5 (10, 27) nmol/L vs 59.5 (35.5, 75), P < 0.0001], but had higher FAI [91.7 (44.7, 195) vs 26.7 (13.5, 44.9), P = 0.03] than girls with NW. There were no differences in E1c [15.2 (9.3, 43.8) ng/mgCr vs 12.1 (4.9, 21.1), P = 0.18] or total testosterone [8.5 (8.5, 31) ng/dL vs 8.5 (8.5, 28.5), P = 0.77, Fig. 1] between girls with and without obesity, adjusted for Tanner stage. Girls with obesity had a lower urinary FSH than NW girls [2.8 (1.3, 7.0) vs 3.6 (2.8, 14.2) mU/mgCr] in analyses adjusted for baseline Tanner stage and race/ethnicity (P = 0.01) and for race/ethnicity alone (P = 0.02), but not in unadjusted analysis (P = 0.17). There were no other differences in urinary gonadotropin concentrations between boys or girls with and without obesity (Table 1).
Relation between glucose metabolism and reproductive hormones
Baseline measures of insulin sensitivity and secretion are shown in Table 1. As expected, both boys and girls with obesity had lower Si and higher AIRg than boys and girls with NW (Table 1). There was a higher AIRg was associated with higher BMI-Z score in both boys (R = 0.74, P < 0.0001) and girls (R = 0.62, P < 0.0001) and a lower Si was associated with higher BMI-Z score in both boys (R = −0.73, P < 0.0001) and girls (R = −0.54, P < 0.0001).
In boys (Table 2), higher AIRg was associated with higher DHEA-S and LH and lower SHBG and total testosterone. Inversely, as expected, higher Si was associated with higher SHBG and total testosterone and lower DHEA-S, LH, and FSH. The relation between FSH and AIRg was no longer significant (P = 0.07) after adjustment for race/ethnicity. Although urinary E1c was higher in the boys with obesity compared with those without obesity, BMI-Z score did not correlate with E1c (R = 0.33, P = 0.08). In girls (Table 2), higher AIRg and was associated with higher FAI and lower SHBG. Conversely, higher Si was associated with higher SHBG and lower FAI.
Univariate Regression Analyses for Boys and Girls Between Outcomes (Si, AIRg) and Predictors (Total Testosterone, FAI, DHEA-S, SHBG)
| Dependent Variable (Log-Transformed) | Parameter | Estimate | R2 | P |
|---|---|---|---|---|
| Boys | ||||
| AIRg | SHBG | −0.025 | 0.36 | <0.0001 |
| AIRg | DHEA-S | 0.008 | 0.19 | 0.003 |
| AIRg | Total testosterone | −0.004 | 0.22 | 0.001 |
| AIRg | FSH | 0.138 | 0.17 | 0.04 |
| Si | SHBG | 0.024 | 0.45 | <0.0001 |
| Si | DHEA-S | −0.006 | 0.18 | 0.004 |
| Si | Total testosterone | 0.003 | 0.15 | 0.01 |
| Si | FSH | −0.166 | 0.26 | 0.008 |
| Si | LH | −0.368 | 0.22 | 0.01 |
| Girls | ||||
| AIRg | SHBG | −0.017 | 0.29 | <0.0001 |
| AIRg | FAI | 0.003 | 0.13 | 0.009 |
| Si | SHBG | 0.016 | 0.24 | <0.001 |
| Si | FAI | −0.002 | 0.08 | 0.042 |
Significant results are shown.
Discussion
The HIP Study is one of the few studies that explores the impact of obesity on reproductive hormones in early puberty and one of the first to evaluate interactions between rigorous estimates of insulin sensitivity and secretion and reproductive hormones during this critical developmental period. In addition to providing insight into the biological effects of obesity during this critical window for long-term reproductive function, it is important to understand the contribution of sex hormones in youth with obesity to the pathophysiology of youth-onset diabetes, the onset of which is closely associated with puberty and other puberty-associated metabolic abnormalities. Studies attempting to intervene during later puberty to improve diabetes outcomes in youth with obesity who also have prediabetes and T2DM have been unsuccessful (33, 34); thus, intervention may need to occur earlier in puberty. The HIP Study is also novel in using measurement of gonadotropins and estradiol metabolites from overnight urine samples. This is a more sensitive approach to measuring low concentrations of sex hormones than those previously utilized, such as random or first morning serum measurements, which is critical for examination of early puberty.
Although both boys and girls with obesity have much lower SHBG, an independent predictor of T2DM incidence in adults (35), than youth with NW, obesity appears to have sex-specific effects on sex hormone concentrations early in puberty. Girls with obesity who are in early puberty have a higher FAI but no differences in total testosterone or urinary E1c compared with girls with NW. In contrast, boys with obesity have higher E1c and lower total testosterone, but no difference in FAI compared with boys with NW. Measurement of total testosterone is affected by SHBG, as 30% to 44% of total testosterone is tightly bound to SHBG (36, 37), whereas it has less of an effect on estradiol measurement. Biologically active or bioavailable testosterone is thought to represent a combination of free testosterone and that which is loosely bound to albumin. Thus, in the HIP Study, the obesity effects on testosterone concentrations are likely driven by lower SHBG, resulting in higher FAI in girls and lower total testosterone in boys. It is important to note that FAI (a measure of bioavailable testosterone) was no different between boys with and without obesity. This demonstrates the importance of measuring total and free testosterone when assessing gonadal function in boys who are obese. This study also adds to the literature by demonstrating that these hormonal associations with obesity are apparent very early on in puberty, confirming findings from other studies focusing on youth in later puberty.
Although bioavailable testosterone was not affected by obesity in these pubertal boys, higher gonadotropins and lower testosterone were associated with lower Si, potentially suggesting that insulin resistance could be associated with a primary hypogonadism (i.e., low testosterone, elevated gonadotropins) early in puberty. This is opposite to what is reported in adult men with obesity, who are presumed to have hypogonadotropic hypogonadism (38), however, there is still some controversy as to the true cause of hypogonadism and our results from early puberty suggest that, at least initially, insulin resistance may directly affect the testis. Thus, although the associations between low total testosterone and low Si and high AIRg in early pubertal boys are more likely a reflection of the impact of hyperinsulinemia on SHBG, the low testosterone may be resulting in a drive to increase gonadotropin secretion from the pituitary.
In addition to impacting measurement of sex steroids, low SHBG is thought to have cardiometabolic implications. In the HIP Study, the markedly lower SHBG concentrations in early pubertal youth with obesity directly associated with Si and inversely associated with AIRg, consistent with previous reports in adults and later pubertal youth (13, 16, 17). SHBG is known to be associated with insulin resistance, likely because of direct suppression of SHBG by compensatory hyperinsulinemia (39), and has been demonstrated to be an independent predictor of diabetes in adults, after adjusting for a number of factors (age, cardiovascular disease, smoking, alcohol, socioeconomic status, BMI, and waist circumference) (40), but little is known about SHBG as a risk marker for cardiometabolic disease in youth. Longitudinal studies are now needed to determine whether SHBG in early puberty youth is a useful cardiometabolic disease risk marker of later disease progression.
Our findings are similar to several other studies showing lower total testosterone in pubertal boys with obesity (13–15) and demonstrate that these differences are detectable as early as T2, when total testosterone is present in low concentrations. It is important to note that a radioimmunoassay was used in this study, which may have decreased sensitivity at the low testosterone concentrations seen in women of all ages and in early pubertal boys, and therefore total testosterone measurement by liquid chromatography-tandem mass spectrometry (LC-MS/MS) is preferred in these groups (41). Studies that have used LC-MS/MS have shown that prepubertal boys with and without obesity have similar total testosterone (16), but that total testosterone becomes lower in boys who are obese as they progress through puberty (16, 42). The low total testosterone but normal FAI in our and other cohorts of obese pubertal boys has important clinical implications, suggesting the necessity of measuring free testosterone rather than total testosterone when assessing gonadal dysfunction in boys with obesity. It remains unclear, however, when the impact of obesity on free testosterone seen in adult males (43) emerges.
Among girls with obesity in the HIP Study, the FAI was approximately three times as high in pubertal girls compared with girls who were NW of the same pubertal stage, reflecting early evidence of obesity-associated hyperandrogenism (3), again demonstrating the impact of obesity on reproductive hormones early in puberty and confirming previous findings in later pubertal girls (17). Unlike other studies that have found associations between high BMI and DHEA-S (14, 17, 18), but had a wider range in pubertal stages, we did not find differences in DHEA-S in our early pubertal cohort. However, we did find a weak association between DHEA-S and Si and AIRg in the HIP girls, indicating that the previous associations may be more related to insulin resistance than to the obesity itself. Again, longitudinal studies using sensitive LC-MS/MS measurement of androgens are now needed to better understand the impact of obesity on sex steroids and adrenal androgens as puberty progresses in girls.
The use of a first morning urine sample measure gonadotropins and E1c in the HIP Study had several advantages. Sex steroids and gonadotropins are primarily secreted at night, in a pulsatile manner and in low concentrations in early puberty (44). Measuring gonadotropins and E1c on a first morning urine collection (normalized to creatinine) reflects the overnight hormone production yet avoids frequent overnight blood sampling. Urinary reproductive hormone assays have been validated in adults (45, 46) and have also been studied in children (47, 48). In adult women, urine and serum concentrations of estradiol and E1c are highly correlated (R = 0.93) (46). Furthermore, urinary LH, FSH, E1c, and progesterone metabolites have been shown to follow the expected pattern based on serum values in a cohort of girls ages 11 to 13 years of age followed prospectively over two years (48), validating the use of these assays in girls in early puberty. There have been no prior studies of urinary E1c in boys in early puberty. Using this sensitive assay, we have been able to demonstrate, the presence of higher estrogen exposure in obese than lean boys at the earliest stage of puberty. It has been proposed that increased aromatization of androgens in adipose (49) leads to higher estradiol concentrations in men with obesity, potentially driving the higher incidence of hypogonadotropic hypogonadism in these men through negative feedback of estradiol on the pituitary and hypothalamus. The presence of obesity and high estradiol going into puberty may, therefore, further impact reproductive function through negative feedback on the pituitary as puberty progresses, in addition to the insulin resistance-related primary hypogonadism mentioned above.
In conclusion, our study demonstrates reproductive implications of the presence of obesity at the onset of puberty and illustrates sex differences in this impact. Importantly, this study demonstrates that some of the sex steroid patterns seen in adults who are obese, including higher E1c and lower total testosterone in men with obesity and higher bioavailable testosterone in women who are obese, are already present in early pubertal youth with obesity. In contrast, the lower bioavailable testosterone seen in adult males with obesity was not present in our early pubertal boys with obesity. The timing of the emergence of the hypoandrogenemia reported in obese adult males remains unclear. Further longitudinal study is needed to better understand the impact of these early changes in youth who are obese on long-term reproductive and cardiometabolic function.
Acknowledgments
The authors wish to thank the participants in the study.
Financial Support: This research was supported by American Diabetes Association Junior Faculty Award (1-11-JF-23 to M.M.K.) and the Children’s Hospital Colorado Research Institute Research Scholar Award. M.M.K. and N.S. were supported by the Colorado Interdisciplinary Research Careers in Women’s Health National Institutes of Health/National Institute of Child Health and Human Development Building Interdisciplinary Research Careers in Women’s Health K12 (HD057022-06). Institutional funding: National Institutes of Health/National Center for Advancing Translational Sciences Colorado CTSA UL1 TR001082. N.N. was supported by a T32 grant (T32 DK 63687).
Clinical Trial Information: ClinicalTrials.gov no. NCT01775813 (registered 5 October 2012).
Disclosure Summary: The authors have nothing to disclose.
Abbreviations:
- AIRg
acute insulin response to glucose
- BMI
body mass index
- DHEA-S
dehydroepiandrosterone sulfate
- DI
disposition index
- E1c
estradiol metabolite
- FAI
free androgen index
- FSH
follicle-stimulating hormone
- HIP
Health Influences of Puberty Study
- IFG
impaired fasting glucose
- IGT
impaired glucose tolerance
- IVGTT
intravenous glucose tolerance test
- LC-MS/MS
liquid chromatography-tandem mass spectrometry
- LH
luteinizing hormone
- NW
normal weight
- Si
insulin sensitivity
- SHBG
sex hormone-binding globulin
- T
Tanner stage
- T2DM
type 2 diabetes mellitus
