


Abstract
Evidence indicates that there is substantial impairment/loss of β-cell function/mass even before prediabetes. Elevated plasma proinsulin is a sign of β-cell dysfunction in patients with diabetes/prediabetes. However, the dynamic changes of glucose stimulated proinsulin secretion (GSPS) among nondiabetic individuals remain obscure.
To examine GSPS and glucose-stimulated insulin secretion (GSIS) among individuals with normal glucose tolerance (NGT) and impaired glucose tolerance (IGT) and to evaluate whether impaired GSPS is an early biomarker of β-cell impairment in individuals with NGT who have subthreshold postprandial plasma glucose (PPG).
We evaluated GSPS and GSIS in 116 Chinese adults without diabetes (mean age ± SD, 33.31 ± 9.10 years; mean BMI, 25.24 ± 4.20 kg/m2) with fasting plasma glucose (FPG) < 5.6 mmol/L. Based on 2hPPG, the participants were divided into three groups: NGT1 (2hPPG < 6.67 mmol/L), NGT2 (6.67 ≤ 2hPPG < 7.78 mmol/L), and IGT (7.78 ≤ 2hPPG<11.1 mmol/L). We analyzed the association of GSIS and GSPS with commonly used indexes of β-cell function, insulin resistance and family history of diabetes.
Although not diagnosed with prediabetes, the individuals with NGT2 have clinical characteristics and high diabetes risk factors similar to those of the IGT group. However, unlike individuals with IGT, NGT2 participants did not exhibit a delayed GSIS. Instead, GSPS was impaired in NGT2 groups but not in NGT1 group.
This study suggests that impaired GSPS, but not impaired GSIS, may serve as an early biomarker to identify a subpopulation of NGT with a high risk of diabetes.
The increasing prevalence of diabetes mellitus, characterized by a progressive dysfunction of pancreatic β cells, has emerged as a critical health problem worldwide. The accumulating evidence suggests that at the time of diabetes diagnosis, pancreatic β-cell mass and function are decreased by 30% to 60% (1–3). Impaired glucose-stimulated insulin secretion (GSIS) is an established marker of β-cell dysfunction in prediabetes, including impaired fasting glucose (IFG) and impaired glucose tolerance (IGT), which affects >30% adult population (4, 5). Emerging evidence suggests that impairment of β-cell can occur even in persons with normal glucose tolerance (NGT) who are at high risk of developing diabetes (6). However, to date, no reliable markers have been identified to detect β-cell impairment during the transition from NGT to prediabetes and diabetes. There are unmet medical needs to identify biomarkers to detect β-cell dysfunction at the early stage, which may provide a better opportunity to prevent or delay progressive β-cell dysfunction and diabetes.
Proinsulin (PI) is an insulin precursor that undergoes multiple intracellular processes, including oxidative folding, intracellular trafficking, and enzymatic processing to mature insulin (7–9). Abnormally elevated circulating PI and the PI–to-insulin ratio (PI/I) have been widely used as indicators of β-cell dysfunction and insulin resistance in both prediabetes and diabetes (10–12). Importantly, several population-based prospective studies show that elevated circulating PI levels at fasting or 30 minutes after glucose load are associated with a high risk of developing overt diabetes in persons with IGT and NGT; those findings suggest that abnormal PI secretion may be an early indicator of β-cell dysfunction even before clinical diagnosis of diabetes and IGT (13–16). However, the dynamic changes of glucose-stimulated proinsulin secretion (GSPS) in persons with different glucose levels remain to be determined. In the current study, we aimed to evaluate whether impaired GSPS could be used to identify a subpopulation with NGT but subthreshold 2-hour PPG ranging from 6.67 to 7.8 mmol/L. The associations of GSPS with commonly used indexes of β-cell function and insulin resistance, as well as family history of diabetes, were analyzed.
Materials and Methods
The Ethics Committee of Tianjin Medical University General Hospital approved the study. All study participants provided informed consent. From June 2015 to November 2017, we recruited 142 volunteers aged 20 to 45 years with no known history of diabetes and with no medications within 1 month before the study. We excluded 26 individuals from the analyses: 21 because they had fasting blood glucose > 5.6 mmol/L and 5 because of 2-hour postprandial blood glucose > 11.1 mmol/L. The final study population for the analysis consisted of 116 participants (32 men and 84 women).
The participants underwent an oral glucose tolerance test (OGTT) (75 g of glucose) after 8 hours of fasting, and samples for plasma glucose, insulin, and PI were drawn at 0, 30, 60, 120, and 180 minutes. According to their 2-hour PPG, the individuals were divided into three groups: NGT1 group (n = 41), with 2-hour PPG < 6.67 mmol/L; NGT2 group (n = 40), with 6.67 ≤ 2-hour PPG < 7.78 mmol/L; and IGT group (n = 35), with 7.78 ≤ 2-hour PPG < 11.1 mmol/L. On the basis of insulin level, the individuals with NGT were divided into the following subgroups: normal insulin (insulin was <100 mU/L at all points during the OGTT), normal glucose tolerance (NI-NGT1 and NI-NGT2), high insulin (insulin was >100 mU/L at any point during the OGTT), and normal glucose tolerance (HI-NGT1 and HI-NGT2). Plasma glucose was measured with glucose oxidase (Siemen Co.). Plasma insulin was measured with a direct chemiluminescent immunoassay (Siemen Co.). PI was measured by PI-specific ELISA kit (ALPCO). The formula used to calculate the indexes in this study is shown in an online repository (17). β-Cell function and insulin resistance were also evaluated by homeostasis model assessment of cell function (HOMA-β) (%) [20 × fasting serum insulin /(fasting plasma glucose − 3.5)], homeostasis model assessment of insulin resistance (HOMA-IR) (fasting serum insulin × fasting plasma glucose/22.5), Matsuda index (MI), and disposition index (DI). The MI was calculated by using fasting and mean plasma glucose and serum insulin concentrations. The DI was calculated as the product of insulin sensitivity MI × (0.5-hour serum insulin − fasting serum insulin)/(0.5-hour plasma glucose − fasting plasma glucose). The formulas for calculating the indexes used in this study appear in an online repository (17)
Statistical analyses
Statistical analyses were conducted by using SPSS software, version 20 (IBM). All traits except those listed in Table 1 were log-transformed to correct for their skewed distributions. The comparison of plasma glucose, insulin, and PI between groups was conducted by using ANOVA. Because of the skewed distributions, all items in table 1 except for sex and family history were calculated by rank sum test: Kruskal-Wallis analysis. Sex and family history were evaluated by the Pearson χ2 test to determine any significant differences. After Bonferroni correction for multiple testing, P < 0.0167 was considered to indicate a statistically significant difference.
Characteristics of Individuals With NGT and IGT
| Characteristic | NGT1 (n = 41) | NGT2 (n = 40) | IGT (n = 35) |
|---|---|---|---|
| Male, n (%) | 8 (20) | 13 (33) | 11 (31) |
| Female, n (%) | 33 (80) | 20 (67) | 24 (69) |
| Age, y | 29.02 ± 5.87 | 33.68 ± 9.12 | 37.91 ± 9.99a |
| BMI, kg/m2 | 23.74 ± 5.47 | 25.66 ± 3.17a | 26.51 ± 2.88a |
| AC, m | 0.79 ± 0.14 | 0.84 ± 0.10a | 0.88 ± 0.10a |
| FHD, % | 31.71 | 67.50a | 74.29a |
| SBP, mm Hg | 113.15 ± 10.05 | 125.88 ± 16.03a | 126.74 ± 13.83 |
| DBP, mm Hg | 71.22 ± 7.14 | 79.73 ± 11.85a | 81.97 ± 11.56 |
| HOMA- β, % | 98.14 ± 81.36 | 136.05 ± 125.15a | 196.43 ± 203.42a |
| HOMA-IR | 1.59 ± 1.54 | 2.50 ± 2.11a | 3.7 ± 2.92b |
| DI | 9.53 ± 12.38 | 4.81 ± 3.11a | 2.36 ± 1.61b |
| MI | 5.69 ± 5.02 | 3.55 ± 2.38a | 2.27 ± 1.58b |
Age, BMI, AC, FHD, SBP, and DBP are presented as means ± SD; HOMA-β, HOMA-IR, DI, and MI are presented as mean ± interquartile range. AC, abdomen circumference; DBP, diastolic blood pressure; FHD, family history of diabetes; SBP, systolic blood pressure.
P < 0.05 compared with NGT1 group.
P < 0.05 compared with NGT2 group.
Results
NGT2 group presented more diabetes risk factors than did NGT1 group
A previous study showed that impaired β-cell function occurs in individuals with 2-hour PPG ranging from 6.67 to 7.8 mmol/L (6). We therefore divided the participants according to their 2-hour PPG during OGTT into three groups: NGT1 (2-hour PPG < 6.67 mmol/L), NGT2 (6.67 ≤ 2-hour PPG < 7.78 mmol/L), and IGT (7.78 ≤ 2-hour PPG < 11.1 mmol/L) (18). Although 2-hour PPG was not achieved to be diagnosed as IGT, compared with the NGT1 group, the NGT2 group had increased diabetes risk factors, including increased body mass index (BMI), abdomen circumference, blood pressure, and family history of diabetes (Table 1), suggesting that NGT2 individuals have higher risks for diabetes. The 1-hour PPG in the NGT2 group was 8.75 mmol/L, which is higher than the 8.61-mmol/L (18) cutpoint of a strong indicator of individuals with high risk of diabetes (19). In addition to glucose level, decreased multiphasic and increased monophasic glucose response curve during OGTT may be a risk factor for diabetes (20, 21). We therefore calculated the following percentages of the multiphasic glucose response curve:36.59%, 12.5%, and 5.71% (P < 0.001) in the NGT1, NGT2, and IGT groups, respectively. Taken together, these data suggest that compared with the NGT1 group, the NGT2 group were at high risk for diabetes.
Impaired GSPS was early marker of β-cell dysfunction not only in IGT group but also in NGT2 group with higher risk of diabetes
Impaired GSIS is an established early marker of β-cell dysfunction in IGT. We therefore compared GSIS in participants with NGT1, NGT2, and IGT. Although the peak of GSIS was at 2 hours in persons with IGT, the peaks of GSIS were both at 1 hour in NGT1 and NGT2 (Fig. 1b), suggesting that a delay of GSIS is a feature of IGT but cannot distinguish the NGT2 from the NGT1 group. However, the patterns of GSPS appeared to be different from those of GSIS. Whereas GSPS peak was at 1 hour in the NGT1 group, the peaks were at 2 hours in both the NGT2 and IGT groups (Fig. 1d). This finding suggests that unlike impaired GSIS, which was solely seen in IGT, delayed GSPS could be detected as early a stage as NGT2. To determine whether insulin concentrations affected the patterns of GSIS and GSPS, the participants were divided into five subgroups based on their plasma insulin levels. The patterns and peaks of GSIS and GSPS were independent of insulin levels and PI/I in the three groups (Figure 1c, 1e, and 1f). Altogether, these data suggest that compared with impaired GSIS, delayed GSPS may be an early β-cell dysfunction marker that can be used to identify or predict individuals that are at the NGT stage but are prone to develop diabetes.
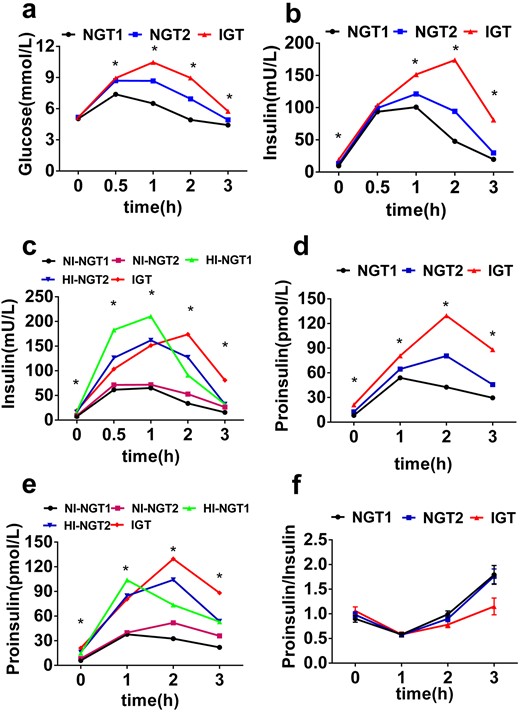
Impaired GSPS is an early marker of β-cell dysfunction not only in individuals with IGT but also in those with NGT2 who have higher risk of diabetes. Shown are the glucose response curve (a), GSIS (b), and GSPS (d) during the OGTT in the NGT1 (black), NGT2 (blue), and IGT (red) groups. Also depicted are GSIS (c) and GSPS (e) during the OGTT in the NI-NGT1 (black), HI-NGT1 (green), NI-NGT2 (purple), HI-NGT2 (blue), and IGT (red) groups. (f) PI/I in the NGT1 (black), NGT2 (blue), and IGT (red) groups. *P < 0.05 among the groups.
HOMA-β may not be suitable index to evaluate early dysfunction of β cells in IGT and NGT2
HOMA-β is widely used to evaluate β-cell function in related research and clinical practices. We calculated HOMA-β of the individuals in the NGT1, NGT2, and IGT groups. Surprisingly, HOMA-β was contradictorily higher in the IGT and NGT2 groups than in the NGT1 group (Table 1) (22). Because HOMA-β is calculated by using only fasting insulin and glucose, it may not reflect the function of β cells that are challenged with high glucose. We therefore decided to determine the DI, the calculation of which considers glucose-stimulated insulin secretion and insulin sensitivity (including HOMA-IR and MI). DI was lower in the NGT2 and IGT groups than in the NGT1 group (Table 1) (22). These results suggest that HOMA-β calculated only by using fasting plasma insulin and glucose may not be an appropriate index for precisely reporting the early dysfunction of β cells, especially when the individuals were challenged with high glucose.
Discussion
This study found that delayed GSPS, but not impaired GSIS, was a specific marker in a subpopulation of individuals with NGT who have a high risk of diabetes. The findings suggest that delayed GSPS may be an early biological marker of β-cell dysfunction during the transition from NGT to IGT and diabetes.
OGTT is the gold standard for evaluation of glucose homeostasis. In the clinical setting, FPG and 2-hour PPG are used not only for diagnosing diabetes but also for identifying prediabetes states, including IFG and IGT. These individuals with prediabetes have a high risk for development of overt diabetes. However, population-based longitudinal studies show that ∼40% of individuals who develop diabetes have NGT at baseline, suggesting that some individuals with NGT are at higher risk for diabetes than are others (23). In this study, a subpopulation of individuals with NGT who have subthreshold 2-hour PPG ranging from 6.67 to 7.8 mmol/L had increased diabetes risk, including increased BMI, abdomen circumference, blood pressure, HOMA-IR, and family history of diabetes (Table 1) (18), suggesting that they may have a greater probability of developing prediabetes and diabetes. In addition to 2-hour PPG, 1-h PPG in the NGT2 group was 8.75 mmol/L; this is higher than the 8.61-mmol/L (18) reported cutoff for a future risk of diabetes (19). Moreover, decreased percentage of multiphasic glucose response curve, which may be associated with diabetes risk (20, 21), was also observed not only in participants with IGT but also in those with NGT2. Taken together, these results suggest that a subthreshold 2-hour PPG (e.g., 6.67 to 7.8 mmol/L) may be a strong indicator of future risk of diabetes.
Progressive loss of β-cell function is the most important factor in the pathogenesis of type 2 diabetes (24). Substantial functional loss of β cells may occur at or even before prediabetes (6). Identifying individuals with early β-cell dysfunction and high probability of developing prediabetes/diabetes may provide a critical window for an intervention against disease progression. An impaired GSIS is an established biomarker of IGT and type 2 diabetes (25). To determine whether GSIS can be used to identify a subpopulation of persons with NGT (NGT2) with high risk of future diabetes, we evaluated GSIS in the NGT group. Despite higher basal/stimulated insulin and larger area under the curve for insulin, unlike in persons with IGT, no delayed GSIS was observed in those with NGT2 (Fig. 1b and 1c) (18). This finding suggests that GSIS is not a sensitive marker to detect β-cell dysfunction before prediabetes. In contrast, a biomarker that can clearly distinguish NGT2 from NGT1 appears to be the pattern of PI dynamic secretion upon glucose load. Although both secretion peaks of GSIS and GSPS occurred at 1 hour in NGT1, the peak of GSPS started to be delayed to 2 hours as early as in NGT2 (Fig. 1d and 1e). Although elevated fasting PI might be a risk factor for development of diabetes (15), the current study found no significant difference in fasting PI levels between NGT1 and NGT2. This result indicates that increased fasting PI alone may not be sensitive enough to be a risk factor for diabetes. These data suggest that delayed GSPS, but not impaired GSIS, may be an early biomarker of β-cell dysfunction.
As a precursor of insulin, PI undergoes intracellular sorting, trafficking, processing, and storing in β cells (26). Disproportionally elevated plasma PI and PI/I are associated with β-cell dysfunction in diabetes and prediabetes (13, 14, 27). However, to our surprise, although we found a trend of elevated plasma PI in the NGT2 and IGT groups compared with that in the NGT1 group, we found no changes in PI/I among all three groups. Several reasons may explain the changes in PI/I. First, the plasma levels of PI and insulin in circulation are determined not only by secretability of β cells but also by their peripheral metabolic clearance pathways, which differ between PI and insulin (28). Because the individuals in the NGT2 and IGT groups present more insulin resistance, insulin receptor–mediated insulin clearance may be impaired, and, therefore, plasma insulin levels may not faithfully indicate the amount of secreted insulin from β cells. Second, a more recent report found that in participants with an acute β-cell reduction after partial pancreatectomy, disproportionate secretion of PI and insulin was evident only when those participants had insulin resistance (10); this finding suggested that abnormal increased PI/I results from not only decreased β-cell function but also increased β-cell workload due to insulin resistance.
HOMA-β is a commonly used index to evaluate β-cell function. However, it is calculated by using only fasting insulin and glucose, and therefore it cannot faithfully reflect the function of β cells that are challenged with high glucose (25). Because our study participants had normal FPG but different 2-hour PPG ranging from NGT to IGT, HOMA-β may not be a good index for reporting β-cell function after glucose load. In contrast, the DI, which is calculated with consideration of both glucose-stimulated insulin secretion and insulin sensitivity, may be a better index evaluating β-cell function in individuals with insulin resistance. Indeed, we found that although DI was lower in the NGT2 and IGT groups, HOMA-β was contradictorily higher in the IGT and NGT2 groups than in the NGT1 group (Table 1) (22), supporting the notion that HOMA-β is not an appropriate index for precisely reporting the early dysfunction of β cells, especially in the individuals with insulin resistance.
This study has several limitations. The molecular mechanism underlying the defects of delayed GSPS remains unknown. It may be caused by insufficient time of newly synthesized PI retained in the β-cell secretory pathway for efficient enzymatic processing (29) or by an intrinsic insufficiency of β-cell PI processing machinery in those at high risk of diabetes (30). In addition, because of the cross-sectional design, the temporal and causal association cannot be assessed. Further studies are warranted to confirm whether the individuals with NGT2 indeed have a high risk of converting to prediabetes and diabetes. Nevertheless, the current study identifies a subpopulation in the NGT individuals with subthreshold 2-hour PPG and delayed GSPS. Although they were not diagnosed with IGT, these individuals may already have early impairment of β-cell function. An impaired GSPS can be an early biomarker to detect early β-cell dysfunction during transition from NGT to IGT.
Conclusion
A subpopulation of NGT with 2-hour PPG ranging from 6.67 to 7.8 mmol/L has an increased risk of diabetes. Delayed GSPS, but not impaired GSIS, may serve as an earlier biomarker of β-cell dysfunction before prediabetes.
Acknowledgments
Financial Support: This work was supported by research grants from the National Natural Science Foundation of China 81830025, 81620108004, 81570699, and 81870533. We acknowledge the support of Tianjin Municipal Science and Technology Commission 17ZXMFSY00150.
Disclosure Summary: The authors have nothing to disclose.
Abbreviations:
- AUC
area under the curve
- BMI
body mass index
- DI
disposition index
- FPG
fasting plasma glucose
- GSIS
glucose-stimulated insulin secretion
- GSPS
glucose-stimulated proinsulin secretion
- HI-NGT
high insulin and normal glucose tolerance
- HOMA-β
homeostasis model assessment of cell function
- HOMA-IR
homeostasis model assessment of insulin resistance
- IFG
impaired fasting glucose
- IGT
impaired glucose tolerance
- MI
Matsuda index
- NGT
normal glucose tolerance
- NI-NGT
normal insulin and normal glucose tolerance
- OGTT
oral glucose tolerance test
- PI
proinsulin
- PPG
postprandial plasma glucose
- PI/I
ratio of proinsulin and insulin
References and Notes
Author notes
Y.Y., M.W., and J.T. contributed equally to this work.
