


Abstract
Measurement of areal bone mineral density (aBMD) by dual-energy x-ray absorptiometry (DXA) was able to predict fracture risk. High-resolution peripheral quantitative computed tomography (HR-pQCT) yields additional information about volumetric bone mineral density (vBMD), microarchitecture, and strength that may increase our understanding of fracture susceptibility.
To ascertain whether vBMD, microarchitecture, and estimated bone strength derived from HR-pQCT can discriminate vertebral fractures in patients with glucocorticoid-induced osteoporosis (GIOP) independent of aBMD.
A cross-sectional case-control study.
Seven regional hospitals in Hong Kong.
A total of 110 patients on long-term glucocorticoids with vertebral fracture, determined radiographically, and 110 patients on long-term glucocorticoids without fracture.
We assessed vBMD, microarchitecture, and bone strength; aBMD; and fracture risk assessment tool (FRAX).
Patients with vertebral fracture had lower total vBMD and a thinner cortex at the distal tibia after adjustment for age, sex, and aBMD or FRAX. In the antiresorptive treatment–naive subgroup, patients with vertebral fracture also had lower total vBMD at both the distal radius and the tibia after adjustment for covariates. Lower total vBMD and a thinner cortex were also noticed in the nonosteoporotic or FRAX score of <10% subgroups with vertebral fracture and were also associated with increasing prevalence of vertebral fracture.
Patients with GIOP and vertebral fracture have a significant reduction in total vBMD and cortical thinning independent of aBMD and FRAX. These changes may help identify high-risk patients in the subgroups currently considered to have low fracture risk as assessed by DXA or FRAX.
Glucocorticoid is the leading cause of secondary osteoporosis (1). More than 10% of patients (mean age of 53 ± 14 years) who receive long-term glucocorticoid treatment have a diagnosed fracture (2), and 30% to 40% of postmenopausal women (mean age of 65 ± 13 years) have radiographic evidence of vertebral fractures (3). Asymptomatic vertebral fracture occurs in 20% of patients with systemic lupus erythematosus (SLE) treated with steroids (4).
Areal bone mineral density (aBMD) measured by dual-energy x-ray absorptiometry (DXA) is commonly used to assess fracture risk in patients with glucocorticoid-induced osteoporosis (GIOP). Fractures occur at a higher aBMD value in patients receiving glucocorticoid than in non–glucocorticoid-related osteoporosis (1). aBMD, as a projectional measure of bone mineral density (BMD), provides only limited insight into the pathophysiology of GIOP-induced vertebral fracture and is of questionable benefit in an individual patient given that most GIOP-induced fractures occur in patients with osteopenia rather than osteoporosis (5). This discrepancy is probably caused by specific glucocorticoid-induced changes in cortical and trabecular bone microarchitecture such as exaggerated cortical porosity (Ct Po), excessive cortical thinning, poor trabecular connectivity, and collagen breakdown, which compromise bone strength but are not detected by DXA (1).
High-resolution peripheral quantitative computed tomography (HR-pQCT) is a noninvasive three-dimensional (3D) imaging technique that quantitatively measures volumetric bone mineral density (vBMD) at the distal radius and distal tibia with an isotropic resolution of 82 μm. HR-pQCT enables independent evaluation of cortical and trabecular microstructural features pertinent to bone quality (6). Bone strength parameters (stiffness, failure load, and apparent modulus) can be estimated by microfinite element analyses (µFEAs) created directly from segmented HR-pQCT images (7).
Bone quality is an important determinant of bone strength and fracture susceptibility, independent of aBMD (8). In our previous study, aBMD of the spine or hip could not discriminate patients with SLE on long-term glucocorticoid with vertebral fracture, although lower HR-pQCT–derived cortical vBMD at the distal radius was independently associated with vertebral fracture, highlighting the greater discriminatory power of HR-pQCT for vertebral fracture in patients with SLE on long-term steroids (9). Although bone microstructure and estimated bone strength are known to be associated with prevalent fractures independently of aBMD in men and postmenopausal women (10–12), it remains unclear whether they can discriminate prevalent vertebral fractures in patients with GIOP.
The aim of this study was to determine whether changes in bone microstructure and estimated strength as assessed by HR-pQCT could discriminate patients with a range of rheumatic disease on long-term glucocorticoids with vertebral fracture and to see whether, and how, HR-pQCT provides added information over aBMD in this respect.
Materials and Methods
Subjects
For this cross-sectional case-control study, we recruited and screened 1300 ambulatory subjects on long-term glucocorticoid therapy aged ≥18 years from the rheumatology clinics of the Prince of Wales Hospital and six other regional hospitals in Hong Kong. Each patient provided written informed consent, and institutional review board approval was obtained at each study center. All study methods and procedures were conducted in accordance with the ethical standards of the Declaration of Helsinki.
For inclusion, all subjects must have received oral glucocorticoid therapy at an average dosage of ≥1.0 mg/d of prednisone (equivalent dose) for ≥3 consecutive months immediately preceding the screening visit. These 1300 subjects were screened radiographically for the presence of a fragility vertebral fracture. Radiographic fractures were diagnosed and severity graded with the semiquantitative Genant method by a musculoskeletal radiologist (J.F.G.) (13). Patient exclusion criteria include known skeletal disease other than osteoporosis; abnormal serum calcium, abnormal alkaline phosphatase, or impaired renal function (creatinine clearance <30 mL/min/1.73 m2); abnormal thyroid function; parathyroid disease; known malignancy; a history of major spinal trauma; and unsatisfactory completion of DXA or HR-pQCT examinations.
After screening of the initial study cohort of 1300 patients, 170 were found to have vertebral fracture. Of these 170 patients with fracture, 32 patients met the exclusion criteria, and 28 patients refused to undergo DXA or HR-pQCT examination. The final study cohort therefore consisted of two groups: the fracture group, comprising the 110 patients with a radiographically apparent vertebral fracture; and the nonfracture group, comprising 110 patients on long-term glucocorticoid without a vertebral fracture. Each group underwent subsequent assessments with DXA and HR-pQCT at the Prince of Wales Hospital.
Demographics recorded included age, sex, race, body weight, body height, menstrual status, smoking, and drinking status. The fracture histories of the participants and their first-degree relatives were recorded. Clinical characteristics including disease duration and duration and dosing of current and previous glucocorticoid (duration of use, cumulative dosage, highest daily dosage, and current daily dosage) were assessed by chart review. The use of drugs affecting bone metabolism, including immunosuppressants, antiepileptic agents, anticoagulants, and treatments for GIOP (calcium and vitamin D supplements, bisphosphonate, teriparatide, denosumab, or other antiosteoporosis therapy), was allowed. The dosage and duration of treatment were recorded. Laboratory investigations included complete blood count, liver and renal function tests, and serum levels of calcium, phosphate, alkaline phosphatase, and thyroid-stimulating hormone to confirm patients’ eligibility for the study.
DXA assessment
aBMD of the hip [total left hip and femoral neck (FN)], anteroposterior lumbar spine (L1 to L4), and one-third radius of the nondominant forearm was performed by an International Society of Clinical Densitometry certified technician with the same DXA equipment (Delphi W; Hologic, Bedford, MA) for all participants. BMD results were expressed in grams per square centimeter and T-score calculated with reference to local population norms (14).
HR-pQCT assessment
Bone geometry, vBMD, and bone microarchitecture at the distal radius and distal tibia of the nondominant hand and leg were examined by HR-pQCT (XtremeCT; Scanco Medical AG, Switzerland). The participant’s forearm or leg was immobilized in a carbon fiber cast fixed within the scanner gantry. A two-dimensional scout view of the distal radius or distal tibia was used to define the region of interest by manual placement of a reference line at the endplate of the radius or tibia. Scan acquisition commenced 9.5 mm and 22.5 mm proximal to the reference line for the distal radius and tibia, respectively. A stack of 110 parallel slices was acquired at each site with an effective energy of 40 keV. The image matrix size was 1024 × 1024, yielding a nominal voxel size of 82 μm (6).
The volume of interest was automatically separated into cortical and trabecular components, yielding total, trabecular, and cortical vBMD in milligrams of hydroxyapatite (mgHA) per cubic centimeter (15) and total area (i.e., average cross-sectional area of the bone). Trabecular volumetric bone mineral density (Tb vBMD) was calculated for two regions: the peripheral region adjacent to the cortex (outer 40%) and the central medullary region of the trabecular bone (mTb, inner 60%). 3D ridges (the centerpoints of trabeculae) were identified to assess trabecular microstructure, and trabecular spacing was calculated via the distance transformation method (16). Trabecular number (Tb N, per millimeter) was calculated from the inverse mean spacing of the 3D ridges. Trabecular thickness (Tb Th) and trabecular separation (Tb Sp) were derived from trabecular bone volume fraction and Tb N, analogous to standard histomorphometry methods.
A fully automated cortical compartment segmentation technique was used to assess cortical bone microstructure (17). Cortical vBMD was the mean mineralization of all voxels in the cortical volume of interest. In addition, a direct 3D calculation of cortical thickness (Ct Th) was obtained from segmented mineralized cortex, disregarding intracortical pore surfaces. From this analysis, we obtained cortical vBMD (in mgHA/cm3), Ct Po (%), and Ct Th (mm). Ct Po was calculated as the number of void voxels in each thresholded cortex image divided by the total number of voxels in the cortex (18). Ct Th was a direct 3D calculation of the endosteal-periosteal distance. In our center, the short-term precision of HR-pQCT measurements, expressed as the coefficient of variance, is from 0.38% to 1.03% for vBMD measurements (total, cortical, trabecular) and from 0.80% to 3.73% for all nondensitometric microstructural parameters.
Estimated bone strength by µFEA
μFEAs were performed on 3D images of the distal radius and tibia with the finite element solver included in the built-in Image Processing Language software. A special peeling algorithm, specifying a minimum Ct Th of 6 voxels, was used to identify cortical and trabecular bone tissue. μFEA was performed by converting the binary image data to a mesh of isotropic brick elements (19). For all elements, a Poisson ratio of 0.3 and a Young modulus of 10 GPa were specified. A uniaxial compression test with a 1000-N load was performed. Stiffness (kN/mm) was used to estimate apparent bone strength. An estimate of failure load was calculated based on the assumption that bone failure occurs if >2% of the elements are strained beyond 0.7% (18).
Statistical analyses
Statistical analyses were performed in the SPSS Statistics version 22 (IBM, Armonk, NY). All densitometric, microstructural parameters and estimated bone strength were expressed as mean ± SD. Comparison of clinical, demographic, and bone parameter variables between patients with and without vertebral fracture was analyzed with a Student t test, Mann-Whitney U test, or χ2 test depending on data type. Adjusted ORs per SD change from the nonfracture group to evaluate the association between bone parameters and prevalent fracture were calculated with a logistic regression model. Additional models, adjusted for age, sex, FN aBMD, fracture risk assessment tool (FRAX)-BMD, or one-third radius aBMD were performed. These adjustments were used to test whether the contribution of vBMD, microstructure, or strength parameters to fracture risk was independent of FN aBMD, FRAX, and aBMD at the radius. One-third radius aBMD rather than the ultradistal radius aBMD was used because the former is a validated site. Forward stepwise regression analysis was used to identify the strongest independent HR-pQCT parameters associated with vertebral fracture from the distal radius or tibial vBMD, microstructure, and estimated strength parameters listed in Supplemental Table 2, with a P value <0.2 in the univariate analyses. FRAX-BMD (FN), one-third radius aBMD for the radial HR-pQCT parameters, and FN aBMD for the distal tibial HR-pQCT parameters were also included in the model for the final adjustment. The area under the curve (AUC) of total vBMD and structural parameters were compared with AUC of FN aBMD after adjustment for age. All hypotheses were two-tailed, and a P value <0.05 was considered statistically significant.
Results
Subject characteristics
There was no significant difference between the fracture and nonfracture groups for baseline characteristics except that patients with fracture were older, had a lower body mass index, had a higher prevalence of previous fracture, and made up a greater proportion of patients on treatment with vitamin D, bisphosphonate, and denosumab (Table 1). No patients were on teriparatide. A total of 59 (54%) of the 110 patients with vertebral fracture had one fracture, and 51 patients (46%) had more than one fracture.
Clinical and Demographic Characteristics of All Patients
| Control (n = 110) | Fracture (n = 110) | P | ||
|---|---|---|---|---|
| Age, y | 58.8 ± 11.5 | 63.4 ± 13.6 | 0.008 | |
| Female sex | 83 (75.5%) | 86 (78.2%) | 0.632 | |
| Underlying glucocorticoid-requiring disorders | ||||
| SLE | 40 (36.4%) | 34 (30.9%) | 0.653 | |
| RA | 33 (30%) | 38 (34.5%) | ||
| Others | 37 (33.6%) | 38 (34.5%) | ||
| Body mass index, kg/m2 | 24 ± 3.7 | 22.7 ± 3.5 | 0.010 | |
| Osteoporotic status on DXA | Osteoporosis (%) | 16 (14.5%) | 46 (41.8%) | <0.001 |
| Osteopenia (%) | 59 (53.6%) | 47 (42.7%) | ||
| Normal BMD (%) | 35 (31.8%) | 17 (15.5%) | ||
| FRAX major osteoporotic fracture with BMD, % | 9.33 ± 7.80 | 21.13 ± 15.35 | <0.001 | |
| Tobacco use | Current | 6 (5.5%) | 4 (3.6%) | 0.641 |
| Occasional | 2 (1.8%) | 1 (0.9%) | ||
| Never | 91 (82.7%) | 89 (80.9%) | ||
| Quit | 11 (10%) | 16 (14.5%) | ||
| Alcohol use | Current | 3 (2.7%) | 2 (1.8%) | 0.408 |
| Occasional | 31 (28.2%) | 21 (19.1%) | ||
| Never | 73 (66.4%) | 84 (76.4%) | ||
| Quit | 3 (2.7%) | 3 (2.7%) | ||
| Postmenopausal women | 56 (66.7%) | 68 (76.4%) | 0.498 | |
| Menopause age, y | 48 ± 5 | 48 ± 6 | 0.583 | |
| Known history of fracture | 5 (4.5%) | 38 (34.5%) | <0.001 | |
| Known history of spine fracture | 0 (0%) | 15 (13.6%) | <0.001 | |
| Family history of fracture | 18 (16.4%) | 14 (12.7%) | 0.444 | |
| Family history of osteoporosis | 14 (12.7%) | 18 (16.4%) | 0.444 | |
| DMARDs | Current | 83 (75.5%) | 73 (67%) | 0.247 |
| Ever | 16 (14.5%) | 17 (15.6%) | ||
| Never | 11 (10%) | 19 (17.4%) | ||
| Calcium supplement | Current | 95 (86.4%) | 99 (90%) | 0.693 |
| Ever | 9 (8.2%) | 7 (6.4%) | ||
| Never | 6 (5.5%) | 4 (3.6%) | ||
| Vitamin D | Current | 54 (49.1%) | 77 (70%) | 0.004 |
| Ever | 3 (2.7%) | 4 (3.6%) | ||
| Never | 53 (48.2%) | 29 (26.4%) | ||
| Bisphosphonates | Current | 7 (6.4%) | 23 (20.9%) | 0.002 |
| Ever | 15 (13.6%) | 21 (19.1%) | ||
| Never | 88 (80%) | 66 (60%) | ||
| Denosumab | Current | 0 (0%) | 6 (5.5%) | 0.028 |
| Ever | 1 (0.9%) | 0 (0%) | ||
| Never | 109 (99.1%) | 104 (94.5%) | ||
| Steroid current dosage, mga | 5.9 ± 3.4 | 6.0 ± 5.7 | 0.815 | |
| Steroid cumulative dosage, ga | 18.2 ± 18.2 | 18.7 ± 19.8 | 0.848 | |
| Duration of therapy, y | 7.5 ± 6.8 | 7.3 ± 6.5 | 0.836 | |
Boldface indicates P < 0.05.
Abbreviations: DMARDs, disease-modifying antirheumatic drugs; RA, rheumatoid arthritis.
Prednisolone-equivalent dose.
aBMD by DXA
Of the 110 patients with vertebral fracture, only 46 (42%) were classified as having osteoporosis according to DXA criteria (Table 1). Mean aBMD of the lumbar spine, total hip, and FN was significantly lower (P < 0.001) in patients with fracture than those without fracture (Supplemental Table 1).
vBMD, bone microarchitecture, and estimated bone strength by HR-pQCT
vBMD and microstructural data were unobtainable from 10 image datasets (5 radii, 5 tibia) because of poor image quality. Most densitometric, microstructural parameters and estimated bone strength were lower in the fracture group than in the nonfracture group at both the distal radius and distal tibia (Supplemental Table 1).
Patients with fracture had lower peripheral vBMD and estimated strength and also impairment of most trabecular and cortical microstructure parameters (Supplemental Table 1). At the distal radius, fracture risk significantly increased from 42% to 104% by 1 SD difference in total, cortical, or trabecular vBMD and microstructure parameters (except Tb Th and Ct Po) and from 97% to 101% by 1 SD difference for all radius strength parameters (Supplemental Table 2). Similar trends were observed at the tibia, except that the fracture risk was further increased from 65% to 156% by 1 SD difference in vBMD, microstructure, and strength parameters (except Ct Po). The highest ORs were observed at the tibia with total vBMD, Ct Th (Fig. 1) for microstructural parameters, and with failure load and stiffness for strength parameters (OR 2.21 to 2.56; P ≤ 0.001 for all) (Table 2). Total vBMD and Ct Th remained significantly associated with fracture after adjustment for FN aBMD, radius aBMD, or FRAX-BMD (Table 2 and Supplemental Table 2).
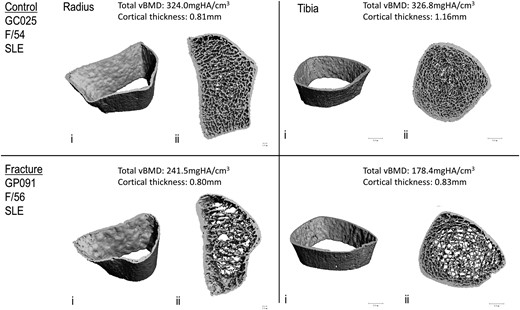
Representative 3D reconstructions of images of distal radius and distal tibia obtained with HR-pQCT from a female patient with SLE with a prevalent vertebral fracture (lower panel) and her age-matched control without fracture (upper panel): i, cortex; ii, combined cortical and trabecular.
Associations Between Radius and Tibia vBMD, Microstructure, and Estimated Bone Strength and the Risk of Vertebral Fractures in All Patients (N = 220)
| Crude ORa | Adjusted for FN aBMDa | Adjusted for 1/3 Radius aBMDa | Adjusted for FRAX-BMD | ||||||
|---|---|---|---|---|---|---|---|---|---|
| OR (95% CI) | P | OR (95% CI) | P | OR (95% CI) | P | OR (95% CI) | P | ||
| Distal radius | |||||||||
| Total vBMD, mgHA/cm3 | ↘1 SD | 2.04 (1.46–2.86) | <0.001 | 1.57 (1.08–2.30) | 0.019 | 2.07 (1.38–3.10) | <0.001 | 1.42 (0.97–2.10) | 0.101 |
| mTb vBMD, mgHA/cm3 | ↘1 SD | 1.86 (1.32–2.60) | <0.001 | 1.33 (0.91–1.96) | 0.143 | 1.74 (1.19–2.53) | 0.004 | 1.22 (0.85–1.74) | 0.277 |
| Ct Th, mm | ↘1 SD | 1.83 (1.31–2.57) | <0.001 | 1.43 (1.00–2.07) | 0.053 | 1.73 (1.17–2.56) | 0.006 | 1.35 (0.93–1.95) | 0.122 |
| Stiffness, kN/mm | ↘1 SD | 2.01 (1.33–3.03) | 0.001 | 1.25 (0.75–2.08) | 0.423 | 1.92 (1.20–3.07) | 0.007 | 1.10 (0.79–1.55) | 0.569 |
| Failure load, kN | ↘1 SD | 1.97 (1.31–2.98) | 0.001 | 1.20 (0.71–2.03) | 0.489 | 1.87 (1.17–2.98) | 0.009 | 1.09 (0.78–1.53) | 0.599 |
| Distal tibia | |||||||||
| Total vBMD, mgHA/cm3 | ↘1 SD | 2.21 (1.56–3.14) | <0.001 | 1.61 (1.07–2.41) | 0.023 | 2.13 (1.41–3.20) | <0.001 | 1.55 (1.04–2.30) | 0.030 |
| Tb Sp, mm | ↗1 SD | 2.12 (1.28–3.51) | 0.004 | 1.36 (0.81–2.28) | 0.240 | 1.77 (1.03–3.04) | 0.040 | 0.79 (0.46–1.38) | 0.411 |
| Ct Th, mm | ↘1 SD | 2.21 (1.55–3.17) | <0.001 | 1.68 (1.15–2.46) | 0.008 | 2.06 (1.38–3.10) | <0.001 | 1.64 (1.12–2.41) | 0.011 |
| Stiffness, kN/mm | ↘1 SD | 2.53 (1.68–3.83) | <0.001 | 1.67 (0.93–2.99) | 0.070 | 2.31 (1.46–3.68) | <0.001 | 1.34 (0.93–1.95) | 0.120 |
| Failure load, kN | ↘1 SD | 2.56 (1.69–3.90) | <0.001 | 1.68 (0.96–2.96) | 0.071 | 2.32 (1.45–3.72) | <0.001 | 1.34 (0.92–1.94) | 0.122 |
Parameters from Supplemental Table 2 with the highest ORs are shown in this table. Boldface indicates P < 0.05.
Adjusted for age and sex as well.
In the stepwise logistic regressions, radius total vBMD (OR 2.01; 95% CI, 1.453 to 2.785; P < 0.001) entered the model as the unique and strongest radial HR-pQCT-derived parameter associated with prevalent vertebral fracture. Similarly, the tibial HR-pQCT-derived parameter most associated with prevalent vertebral fracture was tibia total vBMD (OR 2.40; 95% CI, 1.728 to 3.328, P < 0.001); even when aBMD or FRAX-BMD was included in the variable list.
Subgroup analysis
Because the use of antiresorptive agents is associated with improvement in vBMD and microstructure (20,21), subgroup analysis was undertaken in the 149 patients never exposed to antiresorptives. There were no significant differences between study groups in baseline characteristics except that patients with fracture had a higher prevalence of female sex and previous vertebral fracture and a greater proportion of patients with impaired mobility (Supplemental Table 3). Significantly lower vBMD and deterioration of microarchitecture and strength parameters were observed in patients with fracture at both the radius and the tibia, similar to changes seen in the total cohort (Supplemental Table 4), except inhomogeneity and Ct Po in both the radius and tibia, Tb Sp in the radius, and similar Tb Th and tibia between patients with and without fracture. In addition to total vBMD at the distal radius and tibia, mTb vBMD at the distal radius remained significantly associated with fracture after adjustment for FN aBMD, radius aBMD, or FRAX-BMD (Table 3 and Supplemental Table 4).
Associations Between vBMD, Microstructure, and Strength and the Risk of Vertebral Fractures in Antiresorptive Treatment–Naive Patients (n = 149)
| Crude ORa | Adjusted for FN aBMDa | Adjusted for 1/3 Radius aBMDa | Adjusted for FRAX-BMD | ||||||
|---|---|---|---|---|---|---|---|---|---|
| OR (95% CI) | P | OR (95% CI) | P | OR (95% CI) | P | OR (95% CI) | p | ||
| Distal radius | |||||||||
| Total vBMD, mgHA/cm3 | ↘1 SD | 2.17 (1.43–3.29) | <0.001 | 1.91 (1.20–3.04) | 0.006 | 2.44 (1.45–4.10) | 0.001 | 1.57 (1.00–2.46) | 0.048 |
| Tb vBMD, mgHA/cm3 | ↘1 SD | 2.13 (1.42–3.20) | <0.001 | 1.81 (1.15–2.86) | 0.011 | 2.19 (1.36–3.52) | 0.001 | 1.50 (0.99–2.28) | 0.056 |
| mTb vBMD, mgHA/cm3 | ↘1 SD | 2.45 (1.58–3.79) | <0.001 | 2.16 (1.31–3.54) | 0.002 | 2.65 (1.58–4.43) | <0.001 | 1.64 (1.06–2.55) | 0.028 |
| Stiffness, kN/mm | ↘1 SD | 1.91 (1.17–3.12) | 0.010 | 1.41 (0.76–2.62) | 0.276 | 2.15 (1.16–3.98) | 0.015 | 1.12 (0.75–1.67) | 0.590 |
| Failure load, kN | ↘1 SD | 1.88 (1.15–3.07) | 0.012 | 0.73 (0.40–1.35) | 0.317 | 2.08 (1.13–3.84) | 0.019 | 0.91 (0.61–1.35) | 0.629 |
| Distal tibia | |||||||||
| Total vBMD, mgHA/cm3 | ↘1 SD | 2.20 (1.45–3.33) | <0.001 | 1.85 (1.13–3.03) | 0.015 | 2.13 (1.31–3.49) | 0.003 | 1.68 (1.05–2.69) | 0.030 |
| mTb vBMD, mgHA/cm3 | ↘1 SD | 2.05 (1.35–3.13) | 0.001 | 1.69 (1.05–2.73) | 0.031 | 1.88 (1.18–3.00) | 0.007 | 1.56 (0.99–2.46) | 0.056 |
| Ct Th, mm | ↘1 SD | 1.95 (1.33–2.87) | 0.001 | 1.62 (1.04–2.51) | 0.032 | 1.83 (1.17–2.87) | 0.008 | 1.49 (0.98–2.26) | 0.061 |
| Stiffness, kN/mm | ↘1 SD | 2.53 (1.52–4.19) | <0.001 | 2.20 (1.12–4.33) | 0.022 | 2.32 (1.32–4.08) | 0.004 | 1.40 (0.89–2.19) | 0.145 |
| Failure load, kN | ↘1 SD | 2.55 (1.52–4.27) | <0.001 | 0.45 (0.22–0.89) | 0.023 | 2.32 (1.31–4.13) | 0.004 | 0.73 (0.46–1.14) | 0.162 |
Boldface indicates P < 0.05.
Adjusted for age and sex as well.
In other subgroup analyses, we tested the associations of HR-pQCT and FE parameters according to osteoporotic status and FRAX-BMD intervention threshold for age (10-year major osteoporotic fracture probability 10%). In patients without osteoporosis, radius total vBMD, Ct Th and Tb vBMD, tibia total vBMD, Ct Th, and Tb N were associated with fracture. Similarly, in patients below the FRAX intervention threshold, radial total vBMD, tibia total, Tb and mTb vBMD, Ct Th, and Tb N were also associated with fracture (Supplemental Table 5 and Fig. 2A). We also tested the magnitude of the associations between bone parameters in patients without fracture compared with those with either one vertebral fracture or multiple vertebral fractures (Fig. 2B). Odds were higher in patients with multiple fractures (OR 1.72; 95% CI, 1.01 to 2.93; P = 0.047) compared with those with only one fracture for tibia Ct Th (OR 1.65; 95% CI, 1.05 to 2.59; P = 0.029). However, considerable CI overlap was present.
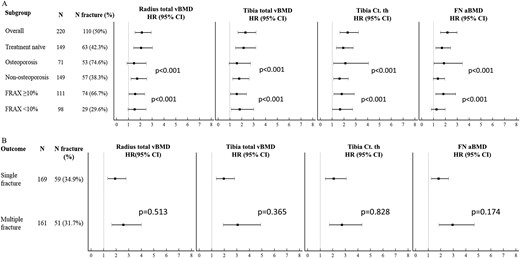
(A) Association between radius and tibia total vBMD, tibia Ct Th, and FN aBMD and the risk of vertebral fracture in the whole group; in the subgroup of patients who are antiresorptive treatment naive; in the subgroups of patients according to osteoporotic status on central DXA (≥1 T-score <–2.5 SD at the lumbar spine, total hip, or FN) and FRAX-BMD intervention threshold for age (10-y fracture probability >10%). The P value of the interaction between groups is indicated. (B) Association between radius and tibia total vBMD, tibia Ct Th, and FN aBMD and various fracture outcomes: risk of single vertebral fracture in the upper panel; risk of multiple vertebral fracture in the lower panel. The P value of the difference between the outcomes is indicated.
The performances for fracture discrimination were tested for the most important tibia HR-pQCT parameters alone and in combination with age (Table 4). The single HR-pQCT parameter with the highest AUC was total vBMD for vertebral fracture. Adding Ct Th to Tb Sp resulted in higher AUC for fracture than either parameter alone but quite similar to those obtained with FN aBMD. Similar results were obtained in additional receiver operating characteristic curve analyses obtained from logistic regressions adjusted for age and sex.
AUC for Vertebral Fracture With Age as Covariates
| AUC | P | 95% CI | |
|---|---|---|---|
| Age + FN aBMD | 0.714 | <0.001 | 0.645–0.782 |
| Age + tib total vBMD | 0.712 | <0.001 | 0.643–0.781 |
| Age + tib Ct Th | 0.709 | <0.001 | 0.640–0.778 |
| Age + tib Tb Sp | 0.667 | <0.001 | 0.595–0.739 |
| Age + tib Ct Th + Tb Sp | 0.714 | <0.001 | 0.645–0.782 |
| Age + tib failure load | 0.687 | <0.001 | 0.617–0.757 |
| Age + 1/3 rad aBMD | 0.628 | 0.047 | 0.510–0.746 |
| Age + FN aBMD + tib total vBMD | 0.732 | <0.001 | 0.665–0.800 |
| Age + FN aBMD + tib Ct Th | 0.744 | <0.001 | 0.677–0.810 |
| Age + FN aBMD+ tib Tb Sp | 0.716 | <0.001 | 0.647–0.785 |
| Age + FN aBMD + tib Ct Th + tib Tb Sp | 0.744 | <0.001 | 0.677–0.810 |
| Age + FN aBMD + tib failure load | 0.721 | <0.001 | 0.653–0.790 |
| Age + FN aBMD + 1/3 rad aBMD | 0.631 | 0.044 | 0.509–0.753 |
Abbreviations: rad, radial; tib, tibial.
Discussion
To our knowledge, this is the largest cross-sectional study using a multimodal investigation of the bone phenotype, demonstrating the independent contribution of cortical and trabecular bone traits and estimated bone strength for discriminating fracture in patients with GIOP. Changes in total vBMD and Ct Th persisted after adjustment for aBMD and FRAX, indicating how HR-pQCT provides useful discriminatory information beyond that provided by DXA examination and the widely used clinical risk assessment score. This study adds to our previous work in patients with SLE by including patients with a range of rheumatic diseases and comparing differences seen in bone quality and strength at the distal radius with those at the distal tibia in patients with GIOP-induced vertebral fracture.
Our findings have several implications. They demonstrate a structural basis, distinct from aBMD, that may account for skeletal fragility. The microstructural changes seen on HR-pQCT concur fully with the trabecular thinning, lower bone volume fraction, and reduced connectivity previously observed in GIOP vertebral fracture patients by histological (22–24) or micro‐CT analysis (24). In the whole cohort, when adjusted for FRAX, only tibial vBMD and Ct Th were associated with increased vertebral fracture risk. Overall, tibial vBMD and Ct Th appeared to perform better than distal radius vBMD and Ct Th. Discrepancies between the distal radius and tibia are probably related to inherent differences in bone architecture and load bearing by the tibia. Although steroids act systemically, one can appreciate from this study how the resultant bone loss pattern tends to be site specific. At the distal radius, GIOP bone loss was predominantly trabecular, whereas at the distal tibia, bone loss was predominantly cortical, more akin to the pattern found in postmenopausal women without GIOP (25, 26).
After patients treated with antiresorptive medication were excluded, patients with fracture were found to have an even more pronounced deterioration in the trabecular bone, including lower mTb vBMD in the distal radius independent of aBMD or FRAX. Total vBMD was able to discriminate vertebral fracture in a subgroup of patients who would not have qualified as being at high risk of fracture under standard parameters such as not being osteoporotic according to aBMD criteria or having a FRAX score of <10%. In other words, most GIOP fractures occurred in patients who would otherwise not have been considered to be at high risk and who would not have been advised to undergo osteoporotic treatment.
These results, showing lower vBMD, microstructure deterioration involving both cortical and trabecular compartment, and loss of bone strength in patients with vertebral fracture, differed from those of our previous study, which found lower cortical vBMD rather than total vBMD and Ct Th to be independently associated with GIOP-related vertebral fracture in a smaller group of female patients with SLE (9), without adjustment for aBMD. This discrepancy, as to whether cortical or trabecular bone changes best explain GIOP-related vertebral fracture, is explained by differences in the two study designs. First, the current study is more inclusive, comprising patients with SLE and rheumatoid arthritis as well as patients with other connective tissue diseases. The pattern of bone loss observed in patients with different rheumatic diseases varies. Patients with SLE sustain loss of cortical bone, whereas patients with rheumatoid arthritis sustain loss of both cortical and trabecular bone at the distal radius (27, 28). Second, although most patients in the current study were female (>80%), male patients were also included. Sex differences in bone quality do exist. For example, postmenopausal women with vertebral fracture have lower cortical and trabecular bone indices at the distal radius, whereas in men with vertebral fracture, only cortical indices are reduced (11). Third, the mean age of patients in the current study was 13 years older than that of the previous SLE study (9). Trabecular bone loss starts in young adulthood and continues throughout life, whereas cortical bone loss occurs after midlife (29). The current study, which included a particularly large number of patients with vertebral fracture and a range of rheumatic diseases treated by steroids, is more applicable to the range of patients encountered in a general rheumatology clinic.
HR-pQCT–based μFEA computationally predicts bone stiffness, which has been useful in distinguishing vertebral fracture status in postmenopausal women (30). In this study, we found that tibia whole bone estimated failure load had a high OR and AUC approaching 0.7, suggesting that it might have high predictive value in discriminating patients with GIOP and vertebral fracture from those without fractures. Furthermore, differences in whole bone estimated failure load between fracture and control subjects were robust enough to remain significant after we adjusted for FN aBMD in the antiresorptive-naive subgroup. From a clinical perspective, combining FN aBMD with cortical or trabecular bone traits results in a higher AUC than aBMD alone (Table 4), suggesting that these parameters capture variability associated with fracture risk in addition to that provided by aBMD alone. Recent prospective studies have shown that bone microstructure and estimated strength can predict fracture risk independently of aBMD in postmenopausal women (26, 31, 32) and improve fracture prediction beyond central DXA and FRAX (32). Future longitudinal studies would help confirm whether these parameters can reliably predict incident vertebral fractures in patients with GIOP.
Limitations of this study include the cross-sectional design, which precluded assessment of the ability of HR-pQCT to predict GIOP fractures prospectively. We were unable to determine in many patients when the fracture occurred. Thus the status of bone microarchitecture at the time of study may not correspond with that at the time of vertebral fracture. All fractures were assumed to be steroid-induced, although some may have been due to primary osteoporosis even though the patients were on long-term steroids. HR-pQCT assesses microstructure and vBMD of the peripheral skeleton, whereas most clinically relevant fracture occurs centrally, at the hip and spine. Currently there is no imaging technique that can provide fine bone detail for the central skeleton. Nonetheless, good correlation between HR-pQCT parameters at the distal radius and tibia has been shown with aBMD of the spine and hip as well as finite element analysis of the vertebral bodies (33, 34). No young control group or cohort with non–GIOP-related senile osteoporosis was included.
In conclusion, patients with GIOP and vertebral fracture have a lower vBMD and cortical thinning of both the distal radius and especially the distal tibia compared with patients with GIOP but no vertebral fracture. These changes, which are independent of aBMD and FRAX, may help identify patients with GIOP who are at high risk of vertebral fracture but currently would be considered to be at low fracture risk.
Abbreviations:
- 3D
three-dimensional
- aBMD
areal bone mineral density
- AUC
area under the curve
- BMD
bone mineral density
- Ct Po
cortical porosity
- Ct Th
cortical thickness
- DXA
dual-energy x-ray absorptiometry
- FN
femoral neck
- FRAX
fracture risk assessment tool
- GIOP
glucocorticoid-induced osteoporosis
- HR-pQCT
high-resolution peripheral quantitative computed tomography
- mgHA
milligrams of hydroxyapatite
- mTb
central medullary region of the trabecular bone
- RA
rheumatoid arthritis
- SLE
systemic lupus erythematosus
- Tb N
trabecular number
- Tb Sp
trabecular separation
- Tb Th
trabecular thickness
- Tb vBMD
trabecular volumetric bone mineral density
- vBMD
volumetric bone mineral density
- µFEA
microfinite element analysis
Acknowledgments
We thank our patients for their participation in this project. Approved by the Joint Chinese University of Hong Kong–New Territories East Cluster Clinical Research Ethics Committee (ref. no. 2014.052).
Financial Support: We acknowledge the Research Grant Council of Hong Kong for funding support (RGC ref no. 14113714) to L.S.T.
Author Contributions: L.S.T. had full access to all data in the study and takes responsibility for the integrity of the data and the accuracy of the data analysis. Study design: L.S.T., J.S.; data acquisition: L.S.T., J.F.G., S.L.L., M.O.P, T.K.L., E.Y.L., T.Y.Z., E.W.K., V.K.L., R.M.Y., K.Y.K., S.K.Y., C.T.H., J.J.L., L.Q.; data analysis and interpretation: L.S.T., J.S., S.L.L., J.J.L.; manuscript preparation: J.S., L.S.T.
Disclosure Summary: The authors have nothing to disclose.
