


Abstract
Results of animal models and cross-sectional cohort studies have suggested a beneficial role for vitamin D in male reproduction.
Determine the effect of vitamin D and calcium supplementation on semen quality in infertile men with serum 25-hydroxyvitamin-D (25OHD) levels ≤50 nmol/L.
A single-center, triple-blinded, randomized clinical trial.
A total of 1427 infertile men were screened to include 330; 1002 men did not meet inclusion criteria and 95 did not wish to participate.
The active group received cholecalciferol 300,000 IU initially, then 1400 IU cholecalciferol and 500 mg of calcium daily for 150 days; the other group received placebo.
Serum concentrations of 25OHD and 1,25-dihydroxyvitamin D3 were significantly higher in men in the treatment group compared with the placebo group. Vitamin D supplementation was not associated with changes in semen parameters, although spontaneous pregnancies tended to be higher in couples in which the man was in the treatment group [7.3% vs 2.4%, Δ5.0% (-0.6%; 10.5%)]. Vitamin D treatment in a subgroup of oligozoospermic men increased the chance for a live birth compared with placebo [35.6% vs 18.3%, Δ17.3% (1.6%; 32.9%)]. Moreover, serum inhibin B levels were higher in men deficient in vitamin D who were randomly assigned to receive high-dose vitamin D [193 pg/mL vs 143 pg/mL, Δ49 pg/mL (8; 91 pg/mL)]; however, the increase in sperm concentration was not significantly higher than in the placebo group (P = 0.07).
High-dose vitamin D supplementation did not improve semen quality in vitamin D–insufficient infertile men. The positive impact of vitamin D supplementation on live birth rate and serum inhibin B in oligozoospermic and vitamin D–deficient men may be of clinical importance and warrant verification by others.
Infertility, defined as the inability to achieve a clinical pregnancy within 12 months of regular unprotected intercourse, is estimated to affect 15% of all couples globally (1). Most couples are treated with assisted reproductive techniques (ARTs) such as intrauterine inseminations, in vitro fertilization (IVF), or intracytoplasmic sperm injection (ICSI) irrespective of the etiology (2). ART ensures a live birth for 70% of couples after three attempts (2, 3). However, ART is very costly and a burden, particularly for the woman, owing to the invasive procedures and lengthy hormonal stimulation. Infertility attributable to the male partner accounts for ∼50% of all cases of infertility; semen analysis is the most commonly used test for assessing male fertility (1). According to the World Health Organization (WHO), men are classified as having impaired semen quality when sperm concentration is <15 million/mL (oligozoospermia), the number of motile spermatozoa is <40% (asthenozoospermia), or the percentage of morphologically normal spermatozoa is <4% (teratozoospermia) (4). Unfortunately, there exists no available treatment option to improve semen quality in most men (5). However, an intensive search to identify endocrine and lifestyle factors influencing semen quality in adulthood provides some hope that male fertility potential and semen quality may be improved in some infertile men (1, 6, 7).
The vitamin D receptor (VDR) is expressed in most organs, which suggests a broader role of vitamin D than only as a regulator of calcium homeostasis and bone health (6, 8). Vitamin D (cholecalciferol) is not biologically active; it has to be activated by hepatic 25-hydroxylation that converts cholecalciferol into the main circulating metabolite 25-hydroxyvitamin D (25OHD). Renal 1α-hydroxylase converts 25OHD into the active metabolite 1,25(OH)2D3 that binds and activates VDR (6, 8). Clinically, vitamin D status is determined by serum 25OHD concentrations that are associated with rickets, calcium absorption, and serum parathyroid hormone (PTH) (9, 10).
Optimal vitamin D status has been discussed intensely for several years, but most clinicians recognize vitamin D deficiency defined by a threshold set at 25 nmol/L (10 ng/mL) and insufficiency at 50 nmol/L (11). Study results in rodents with vitamin D deficiency or global genetic deletion of VDR/1α-hydroxylase (6, 8) have shown impaired male fertility, which suggests a role for vitamin D in male reproduction. However, it has been suggested that impaired fertility in these animal models, at least in part, is caused by hypocalcemia, which often develops as a result of vitamin D deficiency. The role of calcium was best illustrated by the partial rescue of the reproductive phenotype in rodent models after supplementation with a high calcium diet (12–15). Low vitamin D status has also been associated with impaired semen quality in humans (16, 17). Infertile men with vitamin D deficiency had significantly lower sperm production and motility compared with men having normal vitamin D status (18, 19). Interestingly, the serum inhibin B level was also lower in men with vitamin D deficiency, which may be important because serum inhibin B also serves clinically as a quantitative marker of spermatogenesis (19, 20).
Combined, these data suggest that vitamin D supplementation may improve sperm production and sperm motility. In this study, we randomly assigned 330 infertile men with vitamin D insufficiency to receive either placebo or a high dose of vitamin D for two full lengths of spermatogenesis to compare the effects on semen quality, reproductive hormones, and live birth rate.
Methods
The Copenhagen Bone-Gonadal Study is a single-center, triple-blinded, randomized clinical trial conducted at the Department of Growth and Reproduction, Rigshospitalet, Denmark (ClinicalTrials.gov no. NCT01304927). The study protocol, including prespecified subgroups and a detailed plan for biostatistical analysis, are available in the Supplemental Materials.
Participants and trial design
The Copenhagen Bone-Gonadal Study was approved by the Danish Health and Medicines authority, the local ethical committee, and the data protection agency (approval no. 2010-024588-42, H-4-2010-138, and 2010124801) and monitored according to good clinical practices (Good Clinical Practices Unit, Bisbebjerg Hospital, Denmark). All men eligible for inclusion were part of an infertile couple in whom where semen analysis had shown impaired semen quality (Supplemental Fig. 1).
After referral to our andrological center, all men delivered two semen samples for routine analyses and blood samples for karyotyping, analyses of microdeletions on the Y chromosome, and for serum measurements of ionized calcium, 25OHD, testosterone, estradiol, sex-hormone binding globulin (SHBG), luteinizing hormone (LH), follicle-stimulating hormone (FSH), and inhibin B before their visit to the outpatient clinic. At the clinic, the patient’s medical history was obtained and a physical examination including ultrasound of both testes was performed. Men were invited to participate in the trial if they had impaired semen quality (determined by WHO criteria), were vitamin D insufficient (25OHD level ≤50 nmol/L), and did not have serious comorbidities. Informed consent was obtained and a new date was assigned to start the intervention (Fig. 1).
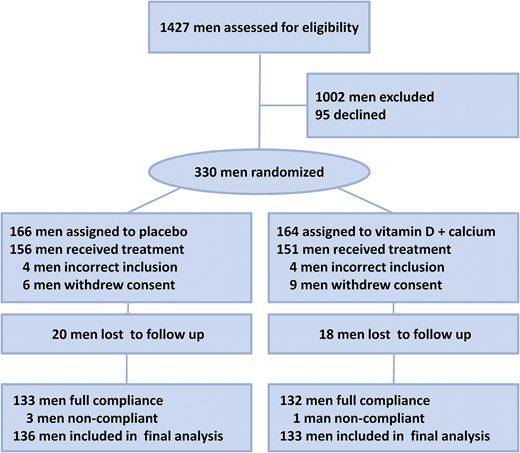
Flow diagram of participants in the Copenhagen Bone-Gonadal study.
Included men were given a specific trial identity number determined by minimization using the computer program Minim (21). Minimization was done using four groups based on serum 25OHD, sperm concentration, body mass index (BMI) and serum inhibin B. To avoid unblinding, the principal investigator gave the necessary clinical information to the sponsor, who had a list of numbers headed by X or Y. This ensured that both the principal investigator and the sponsor were unaware whether the patient was allocated to the vitamin D plus calcium (active) group or the placebo group (i.e., double blinding).
At the first visit, all men delivered a fasting blood sample and had a dual-energy X-ray absorptiometry scan performed. Afterward, men in the active group received a dose of 300,000 IU of vitamin D orally, and the nurse interviewed them and provided them tablets containing 1400 IU of vitamin D plus 500 mg calcium. Men in the placebo arm received oil once orally and placebo tablets to take for the following 90 days. All men received a telephone call to identify any incidents 28 days after start of the intervention. A follow-up visit after 90 days included fasting blood samples, an interview with the nurse, and receipt of active or placebo tablets for the remaining 60 days. Finally, two semen samples were delivered, separated by a median of 10 days, by days 140 and 150. A fasting blood sample, a dual-energy X-ray absorptiometry scan, and a final interview with the nurse were also completed on day 150.
Men who were part of an infertile couple who reported a clinical pregnancy at the final interview were contacted by telephone in 2016. The telephone interview was conducted to obtain the following specific information on the outcome of the pregnancy: spontaneous pregnancy or use of ART treatment (i.e., intrauterine insemination, IVF, ICSI), number of treatment attempts, abortions, time and type of abortion, live birth, gestational week at birth, and sex and health of the child. Eighty percent of the reported pregnancies were confirmed by telephone interview and the time of conception for live births was determined by back calculation from gestational week at birth. The remaining 20% of the reported clinical pregnancies could not be confirmed by telephone because there was no answer from the patients; however, these pregnancies were considered as live births in the analysis.
Sample size calculation
Power estimate was based on a cross-sectional study of 300 young healthy men from the general population and previous intervention studies (16, 22, 23). Our study design was based on an expected increase in serum levels of 25OHD of 50 nmol/L and an expected participant dropout of 10%. A setup with 150 men in each group, a level of significance of 5%, and power of 80% enabled us to detect changes in sperm concentration, sperm motility, and inhibin B level of 27%, 15%, and 20%, respectively.
Medication and compliance
Infertile men were randomly assigned 1:1 (in blocks of 10) to either placebo or an initial oral dose of 300,000 IU of cholecalciferol dissolved in oil, followed by receipt of tablets consisting of cholecalciferol 1400 IU and calcium 500 mg once daily for 150 days (Pfizer, Copenhagen, Denmark). All men were instructed to abstain from taking vitamin D supplementation >400 IU daily. Randomization and manufacture of the high initial dose of vitamin D and placebo were performed by Glostrup Apotek. None of the companies had further involvement in the trial. The trial remained blinded until all biochemical analyses, data handling, and statistical analyses by an independent statistician had been completed (i.e., triple blinding).
To determine efficacy and compliance, serum levels of 25OHD, 1,25(OH)2D3, calcium, and PTH were measured on day 1 and day 150 to allow evaluation of compliance, which was further supported by counting returned tablets on days 90 and 150. All patients were informed about their vitamin D status before inclusion and were offered vitamin D supplementation of 35 µg daily for 180 days after completion of the study independent of their group assignment during the study period.
Biochemical analysis
Fasting blood samples were collected between 8:00 am and 10:00 am. Serum was analyzed immediately for PTH, total calcium, and ionized calcium levels. The remaining analyses were conducted on frozen serum samples from days 1 and 150 after study completion. Measurements of 25OHD and 1,25(OH)2D3 levels were conducted using isotope-dilution liquid chromatography–tandem mass spectrometry with interassay coefficients of variation (CVs) <10% and <18%, respectively. FSH, LH, and SHBG levels were determined using a time-resolved immuno-fluorometric assay (Delfia; Wallac, Turku, Finland) and inhibin B levels were determined by a specific two-sided enzyme-linked immunoassay (inhibin B genII; Beckman Coulter, Brea, CA). The CVs were <4%, <4%, <6%, and <11% for FSH, LH, SHBG, and inhibin B, respectively). Testosterone and estradiol levels were measured using radioimmunoassay platforms from Siemens (Los Angeles, CA) and Pantex (Santa Monica, CA), respectively; the CV was <13%. Ionized calcium levels were measured using the Konelab 30i (Thermo Fisher Scientific, Waltham, MA) with a CV <2%, and total calcium and PTH levels were measured using the Cobas 8000 (Roche, Basel, Switzerland) with a CV <4%.
Semen analysis
Semen samples were obtained by masturbation in a room adjacent to the laboratory and information on duration of ejaculation abstinence, fever, and spillage was obtained. The two semen samples were delivered 16 days apart before the start and 10 days apart at the end of the study. Semen analysis performed at our laboratory has been described in detail previously (24). Briefly, semen volume was calculated by weighing, sperm concentration was determined using a Bürker–Türk hemocytometer, and total sperm count was calculated by multiplication. Sperm morphology according to strict criteria was evaluated on Papanicolaou-stained smears. Sperm motility classified as progressive motile (WHO class A+B), nonprogressive motile (class C), or immotile (class D) was determined in duplicate at two times and presented as AB or ABC motility. The mean of two semen samples was calculated for total sperm count, semen volume, sperm concentration, sperm motility, and morphology at baseline and after study completion. Most men delivered two samples at baseline (317 of 330 men) and study end (253 of 269 men), but data from men delivering only one sample were also included in the analysis.
In 82 men, spermatozoa were investigated for DNA fragmentation before and after intervention at SPZ Laboratory (Copenhagen, Denmark; Supplemental Table 1). Semen (0.5 mL) was diluted with TNE buffer, then mixed and frozen directly in liquid nitrogen until fluorescent staining according to the sperm chromatin structure assay protocol (25). The samples were analyzed using a FACSCalibur (BD Biosciences, San Jose, CA) flow cytometer. Data were acquired using the CellQuest software (version 3.2.; BD Biosciences). Each analysis was run blinded in duplicate and recording was stopped after 5000 events. Variation was assessed by analyzing two semen samples from the same person (patient no. 28) before intervention. The analyses had a standard deviation of 3.3% and CV of 16.5%.
Statistics
A full description of the statistical analysis can be found in Supplemental Material. Descriptive statistics are presented as means with standard deviation (95% confidence intervals) or medians with interquartile range (IQR) in Tables 1 and 2 and Figs. 2 and 3. The primary analysis was performed according to the randomized group assignment, using first crude comparisons of means (t test) and distributions (Mann-Whitney test) for total sperm count and sperm concentration. Subsequently, all variables were analyzed using a mixed model that adjusted for baseline levels. Variables were logarithmically or cubic-root transformed when required to obtain approximate normality of the residuals.
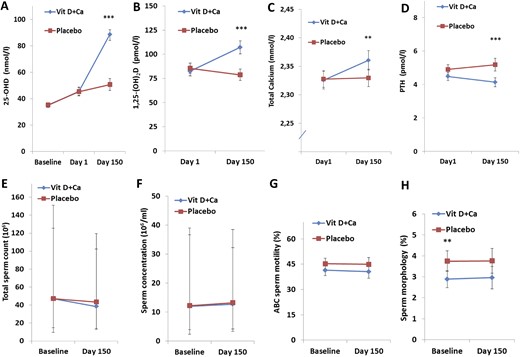
Vitamin D homeostasis and semen quality in men with vitamin D insufficiency. Serum concentrations (reference ranges are in parentheses) at the time of screening (baseline), at the start of the intervention (day 1), and at study completion (day 150) are shown for (A) 25OHD; (B) 1,25(OH)2D3 (50 to 160 pmol/L); (C) total calcium (2.15 to 2.51 mmol/L); and (D) PTH (1.6 to 6.9 pmol/L). (E) Total sperm count. (F) Sperm concentration. (G) Sperm motility. (H) Sperm morphology. (A–D, G, H) Data are presented as mean ± 95% confidence intervals. (E, F) Data given as median ± 25th and 75th quartiles. Ca, calcium.
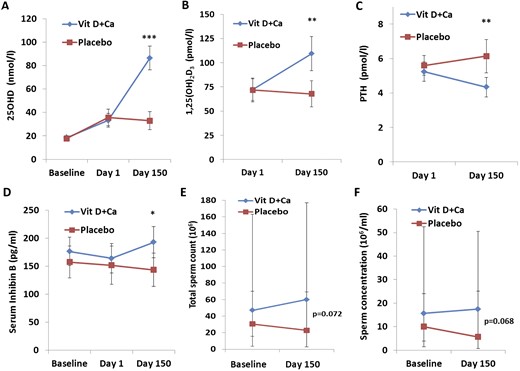
Vitamin D homeostasis and sperm production in a prespecified subgroup of men with severe vitamin D deficiency. Serum concentrations (reference ranges are in parentheses) at the time of screening (baseline), at the start of the intervention (day 1), and at study completion (day 150) are shown for (A) 25OHD; (B) 1,25(OH)2D3 (50 to 160 pmol/L); (C) PTH (1.6 to 6.9 pmol/L); and (D) inhibin B. (E) Total sperm count. (F) Sperm concentration. (A–D) Data are presented as mean ± 95% confidence intervals. (E, F) Data are presented as median ± 25th and 75th quartiles. Ca, calcium.
Basic Characteristics of Men in the Copenhagen Bone-Gonadal Study
| Characteristic | Total Cohort | Vitamin D + Calcium | Placebo |
|---|---|---|---|
| Included men, No. (%) | 330 (100) | 164 (49.7) | 166 (50.3) |
| Age, y | 34.8 (6.6) | 34.3 (6.2) | 35.2 (6.8) |
| Smoker, % | 24 | 27 | 22 |
| Height, m | 1.81 (7) | 1.81 (7) | 1.81 (7) |
| Weight, kg | 87.1 (15) | 87.6 (14) | 86.6 (16) |
| BMI, kg/m2 | 26.5 (4.2) | 26.6 (4.1) | 26.4 (4.3) |
| Duration of infertility, mo | 26 (18) | 26 (17) | 27 (19) |
| Testicular size, mL | 18.6 (5.4) | 18.9 (5.4) | 18.3 (5.4) |
| Abstinence, d | 4.1 (2.1) | 4.0 (1.6) | 4.1 (2.6) |
| Semen volume, mL | 3.9 (1.8) | 4.1 (2.0) | 3.7 (1.5) |
| Sperm concentration, median (25, 75 percentile), 106/mL | 12.0 (4, 38) | 12.0 (4, 37) | 12.3 (2, 39) |
| Total sperm count, median (25, 75 percentile), 106/mL | 47 (12, 133) | 47 (15, 151) | 47 (9, 126) |
| Sperm motility, no. (%) | 44 (21) | 41(21) | 45 (21) |
| Progressive sperm motility, no. (%) | 32 (20) | 30 (19) | 33 (20) |
| Sperm morphology, no. (%) | 3.3 (2.9) | 2.9 (2.6) | 3.8 (3.1) |
| Inhibin B, pg/mL | 167 (80) | 177 (86) | 157 (72) |
| FSH, U/L | 5.6 (4.7) | 5.3 (4.3) | 5.9 (4.7) |
| Testosterone, nmol/L | 16.3 (5.6) | 16.2 (5.4) | 16.5 (5.7) |
| LH, U/L | 4.0 (1.9) | 4.0 (1.7) | 4.1 (2.0) |
| 25OHD, nmol/L | 35 (11) | 35 (11) | 35 (11) |
| Ionized calcium, mmol/L | 1.20 (0.04) | 1.21 (0.04) | 1.20 (0.04) |
Data given as mean (SD) unless otherwise indicated.
Primary and Secondary End Point Analyses in Copenhagen Bone-Gonadal Study
| Vitamin D + Calcium | Placebo | Absolute Difference | Relative Difference, Day 150 | Crude | Mixed Model/Fisher Exact Testa | |||
|---|---|---|---|---|---|---|---|---|
| No. | Mean b | No. | Mean b | Value b | % | P | P | |
| Metabolite, mineral, or hormone | ||||||||
| 25-OHD, nmol/L | 129 | 89 (85–92) | 136 | 51 (46–55) | 38 (21–44) | 76 | <0.001 | <0.001 |
| 1.25(OH)2D3, pmol/L | 129 | 107 (100–114) | 134 | 79 (72–84) | 29 (19–38) | 37 | <0.001 | <0.001 |
| Total calcium, mmol/L | 112 | 2.36 (2.34–2.38) | 112 | 2.33 (2.31–2.34) | 0.03 (0.01–0.06) | 1 | 0.008 | 0.001 |
| Ionized calcium, mmol/L | 126 | 1.21 (1.21–1.22) | 129 | 1.20 (1.20–1.21) | 0.01 (0.00–0.02) | 1 | 0.010 | 0.301 |
| PTH, pmol/L | 111 | 4.1 (3.8–4.4) | 111 | 5.1 (4.8–5.6) | −1.1 (−1.6 to −0.6) | −20 | <0.001 | <0.001 |
| Primary end point | ||||||||
| Total sperm count, 106/mLc | 133 | 39 (14, 103) | 136 | 44 (13, 120) | 5 | −11 | 0.768 | 0.356 |
| Sperm concentration, 106/mLc | 133 | 12.8 (3.4, 32.3) | 136 | 13.3 (4.2, 38.5) | 0.5 | −4 | 0.933 | 0.799 |
| Semen volume, mL | 133 | 3.9 (3.7–4.2) | 136 | 3.5 (3.2–3.8) | 0.43 (0.02–0.84) | −13 | 0.038 | 0.397 |
| Sperm motility, ABC% | 129 | 41 (37–45) | 131 | 45 (41–49) | −4.3 (−10 to 1) | −10 | 0.131 | 0.836 |
| Progressive sperm motility, AB% | 129 | 31 (27–34) | 131 | 35 (31–38) | −4.1 (−9 to 1) | −12 | 0.134 | 0.834 |
| Sperm morphology, normal% | 130 | 3.0 (2.4–3.5) | 127 | 3.7 (3.2–4.3) | −0.8 (−1.60 to 0.02) | −21 | 0.057 | 0.821 |
| Secondary end point | ||||||||
| Live-birth rate, no. (%) | 109 | 30 (27.5) | 126 | 29 (23.0) | 1 (4.5) | 19.6 | 0.427 | 0.454a |
| Live-birth rate: conceived spontaneously, no. (%) | 109 | 8 (7.3) | 126 | 3 (2.4) | 5 (4.9) | 204.2 | 0.073 | 0.119a |
| Live-birth rate: fathers with oligozoospermia, no. (%) | 59 | 21 (35.6) | 60 | 11 (18.3) | 10 (17.3) | 94.5 | 0.034 | 0.040a |
| Inhibin B, pg/mL | 126 | 169 (155–182) | 134 | 154 (141–167) | 15 (−4 to 33) | 10 | 0.127 | 0.556 |
| FSH, U/L | 127 | 5.1 (4.3–5.8) | 134 | 5.5 (4.8–6.2) | −0.4 (−1.5 to 0.6) | −7 | 0.420 | 0.417 |
| Inhibin B-to-FSH ratio | 126 | 62 (50–80) | 134 | 53 (43–66) | 8 (−8 to 24) | 15 | 0.272 | 0.262 |
Indicates that Fisher’s exact test has been used for live birth rates (binomial variable), while mixed model has been used for all numerical variables.
Data given as 95% confidence interval unless otherwise indicated.
Data presented as median (25th, 75th percentiles) and absolute difference is calculated as the difference between medians for these two variables.
Live-birth rate and method used to achieve pregnancies were analyzed using two-sided χ2 and Fisher exact tests. Comparison of live-birth rates was only performed at day 150, and couples with no available information about pregnancies or live births or pregnancy achieved before the start of the study were excluded from the analysis. The ART methodology used to achieve pregnancy was determined only in couples obtaining a live birth.
Further analysis was performed according to prespecified subgroup analyses in relation to primary and secondary end points. Several prespecified subgroups were listed, but only vitamin D deficiency defined by serum 25OHD level ≤25 nmol/L was used.
Live-birth rate was also investigated in men with oligozoospermia (sperm concentration <15 million/mL) and oligo/asthenozoospermia (sperm concentration <15 million/mL or ABC sperm motility <40%) because men in the placebo group had better semen quality compared with the vitamin D group from the start of the study. Investigations of associations between serum inhibin B and the difference in inhibin B levels between day 150 and day 1 (Δd150−1) with serum and Δd150−1 vitamin D metabolite levels were done using linear regression adjusted for potential confounders such as age, BMI, and smoking.
Results
A total of 1427 men were referred with male infertility and screened from January 2011 to August 2014. Of these, 330 infertile men formed the study cohort: 1002 men did not meet all inclusion criteria or met an exclusion criterion, and 95 men were eligible but did not wish to participate. The main reasons for exclusion were high vitamin D status, comorbidities, or azoospermia. Table 1 summarizes the basic characteristics of the 330 included men; Supplemental Table 2 lists the differences in sperm production, reproductive hormones and vitamin D status between included and excluded men. Fifteen men withdrew consent and eight men unexpectedly met an exclusion criterion (comorbidities such as diabetes and previous tuberculosis) and, therefore, were not allowed to start the intervention at day 1. The remaining 307 men were assigned to treatment with either vitamin D and calcium (n = 151) or placebo (n = 156). The first patient was included in March 2011 and the final visit of the last patient was completed in February 2015. Twenty men in the placebo group and 18 in the vitamin D plus calcium group were lost to follow-up. In total, 269 of 307 men (87.6%) completed the study (Fig. 1). By counting returned tablets, it was evident that one man in the vitamin D group and three in the placebo group were noncompliant; however, all data from these four men were included in all the analyses.
Efficacy of the intervention
The mean serum 25OHD concentration was 35 nmol/L in both groups at baseline (i.e., day of screening; Supplemental Table 1; Fig. 2). A similar but remarkable 10 nmol/L increase in both groups was found from screening to day 1, although no active treatment was initiated during this period. From the start of the intervention until day 150, serum 25OHD concentration increased by a mean of 43 nmol/L (96%) in men randomly assigned to the vitamin D plus calcium group, whereas 25OHD levels only increased, on average, 5 nmol/L (11%) in the placebo group (P < 0.0005; Fig. 1A). Men treated with vitamin D plus calcium experienced a 1.5% higher serum concentration of calcium, 30% higher 1,25(OH)2D3, and 8% lower PTH at the end of the study (day 150) compared with the day they started the intervention (day 1; P < 0.01 for all; Fig. 1A–1D). In contrast, in the men in the placebo group, who had no change in serum calcium, there was an 8% decrease in 1,25(OH)2D3 levels and a 6% increase in PTH levels. At day 150, serum concentrations of 25OHD, 1,25(OH)2D3, PTH, and calcium were all different (P < 0.05 for all) between men in the treatment group and those in the placebo group.
Safety and types of incidents
Incidents were reported in 206 of the 307 men starting the intervention (62%; Supplemental Table 2). The frequency of incidents was similar in the two groups, with a median relative risk of 1.34 (95% CI; 0.84 to 2.15) for men in the treatment group (P = 0.21). The most frequent incident was infections (66%), followed by musculoskeletal pain (11%) and gastrointestinal complaints (8%), but none of the incidents differed between groups (Supplemental Table 2). No cases of kidney stones or hypercalcemia were detected and the highest concentration of ionized calcium measured was 1.28 mmol/L (IQR, 1.18 to 1.32). An elevated total calcium concentration of 2.81 mmol/L was detected in serum once (IQR, 2.15 to 2.51). Hypercalcemia was probably caused by a technical error, because ionized calcium was 1.24 mmol/L at the same time. A follow-up sample taken 1 week later was normal. One serious adverse event was observed for one man, who was admitted to the intensive care unit with gallstone-induced pancreatitis. This man was in the placebo group.
Primary end point
On average, the couples had tried to become pregnant for >26 months, and presence of male factor infertility was indicated by a median sperm concentration of 12 million/mL in the included men (Table 1). No differences in total sperm count or sperm concentration were found at day 150 between the treatment and the placebo groups (Fig. 1E–1F; Table 2).
Men treated in the treatment group had a 4% lower percentage of motile spermatozoa (P = 0.108) and progressive motile spermatozoa (P = 0.091) compared with the placebo group at baseline. The observed differences between groups were also present at day 150 for motile and progressive motility (−4% for both, IQRs, −9% to 1% and −8% to 1%, respectively; Table 2; Fig. 1G). Motility variables assessed 4 hours after ejaculation showed similar results (data not shown).
The percentage of spermatozoa with normal morphology was higher in the placebo group than in the treatment group from the start of the study (P = 0.007) and tended also to be higher at day 150 (P = 0.057; Fig. 1H). Moreover, the treatment group had a higher semen volume at baseline [0.5 mL (IQR, 0.1 to 0.8); P = 0.02] compared with the placebo group, and this difference did not change at day 150 (P = 0.038; Table 2).
Secondary end points
Twenty-nine of the 269 men completing the trial reported their partner was pregnant before start of the intervention, whereas five men lost their partner during the study period, leaving 235 with the possibility of effecting a pregnancy. Therefore, the remaining 235 men were included in the analysis. Eighty-nine pregnancies were registered in the case report form and 80% of the men from these couples were interviewed by telephone at least14 months after their last visit (telephone calls were made between May and November 2016). The telephone interviews revealed that 24 of the 89 registered pregnancies were not conceived during the study period (days 1 to 150), and three pregnancies were not correctly registered, leaving 62 pregnancies that occurred during the trial period. Three of the 62 pregnancies resulted in spontaneous abortions (two in the placebo group and one in the treatment group), and 59 of the pregnancies resulted in live births.
Six children were born before gestational week 36 (three in each study group), and one child in each group was under investigation for a congenital disease. The distribution of sex was similar in the two groups. The live-birth rate was not statistically different between groups (Table 2; Fig. 4A). However, the methodology used to achieve pregnancy for the 59 live births (i.e., spontaneous, intrauterine insemination, IVF, ICSI) differed between the groups (P = 0.032; Fig. 4C).
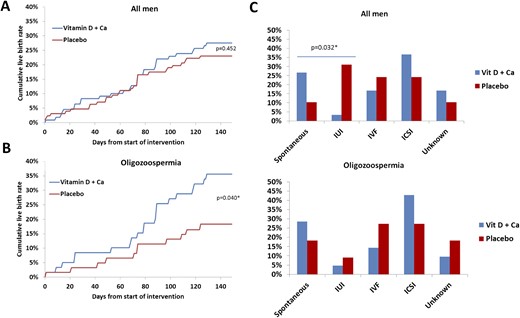
Live-birth rate and use of ART to achieve pregnancy. (A) Cumulative live births conceived from start of intervention (day 1) until study end (day 150). (B) Cumulative live births from oligozoospermic fathers defined by a sperm concentration <15 million/mL. (C) Methodology used to achieve the pregnancy responsible for live birth. The Fischer exact test was used to compare the live-birth rate at day 150 between the two study groups. Ca, calcium.
The chance of achieving a spontaneous pregnancy tended to be higher in couples in which the men were treated with vitamin D plus calcium compared with couples in which the man was in the placebo group (7.3% vs 2.4%; 95% CI, −0.6% to 10.5%). Moreover, couples in which men had oligozoospermia and were in the treatment group had a higher chance for live birth compared with the placebo group (35.6% vs 18.3%; 95% CI, 1.6% to 32.9%; Fig. 4B). However, couples in which the man had oligozoospermia and was in the treatment group did not have a statistically significant higher rate of spontaneous pregnancy compared with the placebo group. Couples in which the man had either oligozoospermia or asthenozoospermia and was allocated to the treatment group had higher frequency of live births compared with the placebo group (33.8% vs 18.3%; 95% CI, 1.3% to 29.7%). As expected, men who were oligozoospermic or oligo/asthenozoospermic who were in the placebo group were associated with couples with fewer live births than men in the placebo group who had normal sperm concentration >15 million/mL or sperm motility >40%.
Men in couples who had a live birth had a higher serum 25OHD level at baseline [3.1 nmol/L; (IQR, −0.06 to 6.27); P = 0.054] compared with men in couples having no children. Furthermore, men in the treatment group and part of a couple who had a live birth had a higher 25OHD level [8.9 nmol/L (IQR, 0.5 to 17.3); P = 0.037] compared with men in couples who did not achieve a pregnancy during the study.
Serum concentrations of inhibin B and FSH, and the inhibin B-to-FSH ratio were not different between the two arms and did not change when comparing Δd150−1 (Tables 1 and 2 ). However, the Δd150−1 in activated vitamin D was positively associated with serum inhibin B levels (β = 0.205; P = 0.055) and the inhibin B-to-FSH ratio (β = 0.164; P = 0.083) at study completion, after adjustment for BMI, smoking, and age.
Prespecified subgroup analysis
A prespecified vitamin D deficiency subgroup defined by a threshold set at 10 ng/mL (25 nmol/L) was used to evaluate the reproductive effect of supplementation in men presumed to have a greater need of vitamin D. Of the 330 included men, 66 (20%) had vitamin D deficiency; the average serum 25OHD concentration was 18 nmol/L. Serum 25OHD concentration reached 87 nmol/L in the treatment group, whereas it remained low (36 nmol/L) in the placebo group at day 150 (P < 0.0005; Fig. 2A and 2C).
Serum 1,25(OH)2D3 concentration increased to 105 pmol/L in men in the treatment group at day 150, which clearly differed from the men in the placebo group, in whom serum 1,25(OH)2D3 concentration reached 66 pmol/L (P = 0.001). This difference between groups was also reflected in serum concentrations of calcium and PTH at day 150 (P < 0.01; Fig. 4; Supplemental Fig. 2). As expected, vitamin D treatment was associated with lower PTH levels (−17%) at day 150 compared with day 1, whereas serum PTH level increased 10% during the study period in the placebo group (P < 0.001).
Median total sperm count and sperm concentration were not statistically significantly different between the two study arms at day 150 (P = 0.07). However, men randomly assigned to the treatment group had an increase in total sperm count of 15 million and an increase in sperm concentration of 3 million/mL at day 150 compared with baseline levels (P > 0.05). This is in contrast to a decrease of 5 million for total sperm count and 4 million/mL for sperm concentration when comparing day 150 with baseline levels in men in the placebo group (P > 0.05; Fig. 4D and 4E; Supplemental Fig. 2).
No differences in sperm motility variables or sperm morphology were found between the two study groups or when comparing baseline with day 150 within the groups. However, the median serum inhibin B level was 49 pg/mL (IQR, 8 to 91; P = 0.021) higher in the treatment group at day 150 compared with the placebo group [34% higher (IQR, 4% to 65%); Fig. 4D]. The inhibin B-to-FSH ratio also was higher in the treatment group (63%; IQR, −20% to 138%), although this was not statistically significantly different from that of the placebo group (P = 0.138).
Moreover, changes in 25OHD concentration during the study period were positively associated with the observed changes in inhibin B-to-FSH ratio (β = 0.101; P = 0.038). Men in the treatment group had an 8.4% (IQR, −0.4% to 17.1%; P = 0.060) higher inhibin B-to-FSH ratio compared with those in the placebo group when data were analyzed after normalization of the inhibin B-to-FSH ratio to the ratio before start of the intervention. However, differences in serum inhibin B and FSH levels, and the inhibin B-to-FSH ratio between the treatment arms at the end of the study were not statistically significant when the mixed model was applied (P = 0.3850, 0.9683, and 0.6118, respectively).
DNA fragmentation did not change from day 1 to day 150, and there was no difference between the treatment and placebo groups in the subgroup of 82 men in whom the DNA fragmentation index was investigated (Supplemental Table 1).
Discussion
In this study, we demonstrated that a single dose of 300,000 IU of vitamin D followed by 1400 IU of vitamin D and 500 mg of calcium daily for 150 days had no effect on semen quality and serum FSH or inhibin B levels in infertile men compared with placebo. The treatment regimen proved to be a safe way to correct vitamin D insufficiency in young infertile men having a low risk of fractures and falls. Men in the treatment group reached, on average, serum 25OHD concentrations of 89 nmol/L, which, for most purposes, can be considered optimal (26). By the end of the study, the placebo group had a mean 25OHD concentration of 51 nmol/L, which was significantly lower than in the treatment group. The observed difference in vitamin D status between the study arms was also reflected in serum concentrations of total and ionized calcium, 1,25(OH)2D3, and PTH, which demonstrated that the intervention was efficient. However, it also illustrates that 50% of the men in the placebo group reached vitamin D sufficiency during the study period. The best explanation for the increase in vitamin D status in the placebo group is seasonal variation, because most men were included during winter and spring, and endogenous vitamin D synthesis after ultraviolet-B light exposure increased during the study period.
Semen quality was a soft end point (27) and not an optimal predictor of male fertility potential (27, 28). However, it is still in clinical use because no better alternatives exist. Particularly, total sperm count and sperm concentration are prone to interindividual and intraindividual variation, which could compromise the conclusion made from this study (29). To counteract this intraindividual variability, two semen samples from each participant were analyzed before and after intervention.
Moreover, live-birth rate was used as a hard secondary end point for male fertility because we had no influence on the ART treatment of the women and, therefore, assumed that the proportion of female fertility problems by chance would be comparable in the two study arms. The live-birth rate in couples that included men in the treatment arm was not higher than in couples that included men in the placebo arm. Although the number of spontaneous pregnancies was almost threefold, it was not statistically significantly higher in vitamin D–treated men. The high number of spontaneous pregnancies is remarkable because the couples attempted to conceive naturally for >26 months before inclusion (30, 31). Moreover, men in the treatment group had fewer spermatozoa with normal morphology and had lower sperm motility compared with men in the placebo group before the start of the intervention, which theoretically would augment their fertility problem compared with the placebo group. This prompted us to investigate the live-birth rate in subgroups of men with oligozoospermia, because this would allow comparison of men with comparable semen quality from the two study arms. The live-birth rate was almost twice as high in the treatment group compared with men in the placebo arm in this subgroup. Still, the observed effects of vitamin D and calcium supplementation on spontaneous pregnancies and live-birth rates cannot be explained by improved semen quality. This implies that the positive effect on live-birth rate either could be a chance finding or that activated vitamin D is able to improve gamete function in a yet-unidentified manner. The last suggestion is supported by the presence of VDR and vitamin D metabolizing enzymes preferentially in good-quality spermatozoa (32–34). One of the beneficial effects of 1,25(OH)2D3 on sperm function could be by lowering DNA fragmentation, although our small pilot study showed no striking differences between the vitamin D and placebo groups.
It is reasonable to assume that vitamin D and calcium supplementation may have a more pronounced effect on semen quality in men with vitamin D deficiency rather than in men with mild vitamin D insufficiency. This suggestion is corroborated by the baseline characteristics of the 1427 men screened, of whom 330 were included in this study. The baseline characteristics showed that only men with severe vitamin D deficiency had lower semen quality and inhibin B levels than men with normal vitamin D status (19). These findings are in accordance with those of previous studies in both men and animals that have linked impaired male fertility with severe vitamin D deficiency (6, 12, 19). Our analyses of the prespecified subgroup of vitamin D deficiency found that men in the treatment group, as expected, had an increase in serum concentrations of 25OHD and 1,25(OH)2D3 compared with men in the placebo group. It is noteworthy that men in the placebo arm actually augmented their vitamin D deficiency, as illustrated by their serum 25OHD and 1,25(OH)2D3 levels, which remained low and resulted in a compensatory increase in PTH levels at day 150 to maintain serum calcium levels.
Despite these changes in calcium and vitamin D homeostasis, no statistically significant differences in total sperm count or sperm concentration were found between the two study arms at day 150. However, the confidence intervals were large and revealed a clinically important effect, indicated by the two- to threefold higher median total sperm count and sperm concentration in vitamin D–deficient men treated with vitamin D and calcium compared with those in the placebo group.
The putative beneficial effect of vitamin D on sperm production was supported by a significantly higher serum inhibin B concentration at day 150 in men in the treatment group compared with the placebo group. Moreover, the inhibin B-to-FSH ratio was borderline statistically significantly higher, and men fathering a live birth in the treatment group had higher vitamin D status from the start of the study than men who did not father a live birth.
A fundamental role of vitamin D for male reproductive function has been indicated by previous studies showing direct effects of 1,25(OH)2D3 on germ cells, spermatozoa, epididymis, and prostate (6), and the impaired fertility in vitamin D–deficient animals, which only can be fully rescued by supplementation of vitamin D rather than 1,25(OH)2D3 or calcium (12, 35). The observed effect on serum inhibin B concentration and putative impact on sperm production in vitamin D–deficient infertile men indicates the main target of 25OHD and 1,25(OH)2D3 may be the gonad rather than the epididymis, because there was no effect on sperm motility. This suggestion is in line with a recent study showing that vitamin D metabolites could not be detected in the seminal fluid (33), which highlights that male gametes are exposed to vitamin D metabolites mainly in the testis and then are not exposed again until reaching the female reproductive tract. Moreover, the suggested increase in sperm production in vitamin D–deficient men may provide some explanation for the higher number of live births and spontaneous pregnancies after treatment with vitamin D plus calcium. The observed impact on live-birth rate and inhibin B is of potential clinical interest but cannot be regarded as hard evidence because the results are based on findings in a prespecified subgroup and not the primary end point.
Other limitations of this study include the 80% completion rate of telephone interviews, insufficient power to investigate the impact of vitamin D deficiency on sperm production, and the high number of men excluded because they had comorbidities, which limit generalizability to most cohorts of infertile men. The main strengths of this study are the single-center design, use of a single laboratory, efficient intervention, two semen samples analyzed before and after intervention, good compliance, high completion rate, and a long follow-up after completion of the intervention to validate the live-birth rate.
In conclusion, this study shows that for men with vitamin D insufficiency, supplementation with vitamin D and calcium had no effect on semen quality or on live-birth rate. However, vitamin D treatment increased serum inhibin B concentration and resulted in an insignificant increase in sperm production in infertile men with vitamin D deficiency. Vitamin D treatment was also associated with higher live-birth rate in couples in which the man had oligozoospermia compared with those men in the placebo arm, which may be of clinical importance if this observation can be validated by others. Before vitamin D supplementation can be recommended routinely as part of the treatment of male infertility, new clinical studies are required to investigate whether daily high-dose vitamin D supplementation to the man and/or woman influences the function of the male gamete and, thereby, increases the chance of spontaneous pregnancies and increases live-birth rates.
Abbreviations:
- 25OHD
25-hydroxyvitamin D
- ART
assisted reproductive technique
- BMI
body mass index
- CV
coefficient of variation
- FSH
follicle-stimulating hormone
- ICSI
intracytoplasmic sperm injection
- IQR
interquartile range
- IVF
in vitro fertilization
- LH
luteinizing hormone
- PTH
parathyroid hormone
- SHBG
sex-hormone binding globulin
- VDR
vitamin D receptor
- WHO
World Health Organization
- Δd150−1
difference in inhibin B levels between day 150 and day 1.
Acknowledgments
Financial Support: This work was supported by The Danish Research Council, Danish Cancer Society, Hørslev Foundation, Åse og Ejnar Danielsens Foundation, and Novo Nordisk fonden.
Clinical Trial Information: ClinicalTrials.gov no. NCT01304927 (registered 28 February 2011).
Author Contributions: M.B.J., N.J., and A.J. designed the study. Patients’ data were collected by M.B.J., J.G.L., and N.J. J.H.P. performed statistical analysis. M.B.J. drafted the manuscript, and N.J. and M.B.J acquired funding for the study. All authors reviewed the manuscript.
Disclosure Summary: The authors have nothing to disclose.
