


Abstract
The aim of this study was to determine whether the diagnosis cutoff values associated with the saline infusion test (SIT) and captopril challenge test (CCT) in the Endocrine Society guidelines are applicable to Chinese subjects.
We performed a head-to-head comparison of the SIT and CCT among Chinese subjects with primary aldosteronism (PA) and essential hypertension (EH).
One hundred sixty-four hypertensive patients were enrolled.
All participants underwent both the SIT and CCT.
The plasma aldosterone concentration (PAC) and plasma renin activity were measured before and after the SIT and CCT. The degree of PAC decline after CCT was calculated.
This study included 115 PA and 49 EH subjects. The prevalence of hypokalemia was 74.8% in the PA group. Supine PACs in the EH and PA groups were 15.1 ± 4.7 mmol/L and 30.4 ± 12.1 mmol/L. Post-SIT PACs were 8.8 ± 1.7 ng/dL and 22.7 ± 10.2 ng/dL in the EH and PA groups. The degree of PAC decline after CCT was 17.7% and 14.2% in the EH and PA groups; post-CCT PACs were 11.7 ± 3.3 ng/dL and 25.9 ± 10.6 ng/dL. PAC values of 11.2 ng/dL and 16.7 ng/dL after the SIT and CCT represented the optimal cutoff values for PA diagnosis. The post-SIT and post-CCT area under the receiver operating characteristic curve values were 0.972 [95% confidence interval (CI) = 0.934 to 0.991] and 0.933 (95% CI = 0.883 to 0.966).
Post-SIT and post-CCT PACs, but not the degree of PAC suppression, were both reliable for PA diagnosis. However, the optimal cutoffs were slightly higher in Chinese subjects than those recommended by the Endocrine Society.
Primary aldosteronism (PA), a nonbenign form of hypertension, causes substantial cardiovascular, cerebrovascular, and renal morbidity; PA also exhibits a higher rate of target organ damage than does essential hypertension (EH) (1). Approximately 5% to 18% of patients with hypertension have PA, and the condition is more common among patients with resistant hypertension (2–4). Hence, early diagnosis and aggressive treatment are keys to managing PA and preventing its complications. The screening test for the aldosterone-to-renin ratio (ARR) has dramatically increased the detection rate of PA, but the test suffers from low specificity and can be affected by multiple factors. In addition, different medical centers use various ARR cutoff values (5). Thus, the guidelines advise that further confirmatory tests, including the oral sodium loading test, saline infusion test (SIT), fludrocortisone suppression test, and captopril challenge test (CCT), are necessary to establish a diagnosis of PA for patients with a positive screening test (6). The SIT and CCT are the commonly used tests in Chinese hospitals because fludrocortisone is not available in China. However, there is insufficient evidence supporting the use of one test over the other in hypertensive Chinese subjects.
China has a large general population, and the prevalence of hypertension among this population is 29.6% (7). Therefore, the detection, diagnosis, and treatment of patients with PA in China are important. Whether the diagnostic SIT and CCT cutoff values obtained from Western populations are applicable to Chinese hypertensive patients is unknown. To date, only a few studies have evaluated the performance of the SIT in Chinese participants with hypertension; these studies have suggested that the post-SIT aldosterone cutoff value for identifying PA is higher in Chinese patients than that in non-Chinese patients (8). In addition, no head-to-head comparisons of the SIT and CCT among Chinese patients with hypertension have been published. Therefore, the current study compared the performances of the CCT and SIT among Chinese participants with PA or EH and evaluated the optimal cutoff values for these tests in a Chinese population for PA diagnosis.
Participants and Methods
Participants
Applying the Endocrine Society’s clinical practice guidelines (6), we retrieved data from patients with hypertension who were referred to the West China Hospital between January 2011 and June 2016 for suspected PA. Screening is recommended for patients with hypertension who have drug-resistant hypertension, unexplained spontaneous or diuretic-induced hypokalemia, adrenal incidentaloma, sleep apnea, a family history of early-onset hypertension, or a cerebrovascular accident at a young age (<40 years). Resistant hypertension was defined as hypertension [blood pressure (BP) >140/90 mm Hg] despite concurrent use of three antihypertensive agents of different classes (including a diuretic) or controlled BP (<140/90 mm Hg) with the use of four or more antihypertensive drugs. After written informed consent was obtained, all patients were studied in our department on an inpatient basis following standardized protocols. The patients discontinued the use of potassium-wasting or -sparing diuretics and products derived from licorice root for at least 4 weeks and spironolactone for at least 6 weeks. Other drugs, including beta-blockers, angiotensin-converting enzyme inhibitors, and angiotensin receptor blockers, were withdrawn for at least 2 weeks. Patients with severe hypertension were prescribed alpha-blockers and long-acting calcium channel blockers if necessary to achieve BP less than 160/100 mm Hg. Sodium intake was unrestricted. The screening test was considered positive when the ARR was higher than (30 ng/dL)/(ng/mL/h) (6). Patients with hypokalemia were provided adequate oral potassium supplements before the study. The patients underwent the SIT on the first day and the CCT on the second day.
Biochemical measurements
Sodium and potassium concentrations were measured from whole blood using fully automated instrumentation. Hypokalemia was defined as a serum K+ level <3.5 mmol/L. The plasma renin activity (PRA) was measured by radioimmunoassay using a commercial kit (Northern Institute of Biotechnology, Beijing, China). The intra- and interassay coefficients for PRA variations were less than 10% and 15%, respectively. The plasma aldosterone concentration (PAC) was measured by radioimmunoassay using a commercial kit (Jiuding Biological Technology LTD, Tian Jin, China). The intra- and interassay coefficients of variation for the PAC were 7.3% and 9.6%, respectively.
Diagnostic criteria
Hypertension was defined as a systolic and diastolic BP greater than or equal to 140/90 mm Hg according to established criteria.
Patients were assigned to the EH group if they exhibited ARR values less than 30 (ng/dL)/(ng/mL/h) on one occasion during clinical workup. The absence of renal artery stenosis was confirmed by Doppler ultrasound. Normal levels of plasma catecholamines, urine free cortisol, and serum creatinine levels and urinalysis were required.
The identification of aldosterone-producing adenoma (APA) was based on the following criteria: (1) evidence of autonomous excessive aldosterone production, which was defined as an upright ARR greater than or equal to 30 (ng/dL)/(ng/mL/h) at baseline; (2) lateralization of aldosterone secretion on adrenal venous sampling; (3) evidence of adrenal adenoma uncovered by computed tomography and surgery and pathologically confirmed; and (4) outcome of adrenalectomy at follow-up as assessed by the demonstration of normokalemia and cure or improvement of hypertension 3 months after adrenalectomy. Patients with a biochemical diagnosis of PA but without conclusive evidence for a lateralized aldosterone excess were presumed to have idiopathic aldosteronism (IHA).
Statistical analysis
All evaluated parameters are expressed as the mean ± standard deviation (SD) or median (25th to 75th percentile) where appropriate. The normal distribution of the between-group parameter was examined using the Kolmogorov-Smirnov test. Values were compared between groups using the Student t test and the rank-sum test. Nonnormally distributed data were compared between groups using the rank-sum test.
Receiver operating characteristic (ROC) analysis was used to determine the test characteristics of the different variables predicting the diagnosis and to provide the best combination of sensitivity and specificity values.
The area under the ROC curve (AUCROC) was used to assess the accuracy of the SIT when identifying PA, and the best combination of sensitivity and specificity was provided. The positive predictive values (PPVs) of the SIT and CCT were defined as the ratio of true positives between participants over all participants who tested positive. The negative predictive value (NPV) was defined as the ratio of true negatives between participants over all the participants who tested negative. A P value of 0.05 was considered significant. Most statistical analyses were performed using the software package SPSS 19.0 for Microsoft Windows (SPSS Inc., Chicago, IL). The AUCs, cutoff values, and test performance characteristics were obtained using MedCalc 17.0 (MedCalc Software, Mariakerke, Belgium).
Results
Clinical characteristics of the patients with EH or PA
The baseline clinical characteristics of the patients, divided by diagnosis, are presented in Table 1. Patients with PA had higher BPs, serum sodium levels, PACs, and ARRs (P < 0.01) as well as lower body mass indices, serum potassium levels, and PRA (P < 0.05) than patients with EH. The systolic blood pressure, PAC, and ARR values were even higher (P < 0.01), whereas serum potassium levels and PRA were lower in the APA group than those in the IHA group (P < 0.05). The prevalence of hypokalemia was 90.0% in the APA group, 51.1% in the IHA group, and 74.8% in the PA group. The proportion of potassium values <3 mmol/L was 39.1% among patients with PA; 88.8% of these patients were in the APA group. Only 7.0% of the IHA patients exhibited potassium values <3 mmol/L.
Clinical and Biochemical Characteristics of Studied Patients
| EH (n = 49) | PA | |||
|---|---|---|---|---|
| Total (n = 115) | APA (n = 70) | IHA (n = 45) | ||
| Sex (female/male) | 31/18 | 70/45 | 45/25 | 25/20 |
| Age (y) | 46.9 ± 14.1 | 47.0 ± 11.6 | 45.0 ± 10.6 | 50.0 ± 12.4a |
| BMI (kg/m2) | 25.2 ± 3.8 | 23.4 ± 3.3b | 23.2 ± 3.1 | 23.8 ± 3.7 |
| SBP (mm Hg) | 150.5 ± 25.0 | 160.3 ± 20.6b | 163.7 ± 21.3 | 155.3 ± 18.8a |
| DBP (mm Hg) | 92.9 ± 13.9 | 97.3 ± 13.1b | 98.9 ± 13.7 | 95.0 ± 12.1 |
| Serum Na (mmol/L) | 142.0 ± 2.1 | 143.9 ± 2.9b | 144.3 ± 2.9 | 143.3 ± 2.9 |
| Serum K (mmol/L) | 3.81 ± 0.32 | 3.08 ± 0.56b | 2.85 ± 0.50 | 3.46 ± 0.40a |
| Prevalence of hypokalemia (%) | — | 74.8 | 90.0 | 51.1 |
| Screening PAC (ng/dL) | 15.1 ± 4.7 | 30.4 ± 12.1c | 34.4 ± 12.0 | 23.3 ± 7.3d |
| Screening PRA (ng/mL/h) | 0.80 (0.52–1.20) | 0.16 (0.10–0.29)c | 0.15 (0.08–0.22) | 0.20 (0.12–0.46)d |
| Screening ARR (ng/dL: ng/mL/h) | 16.6 (10.9–26.3) | 173.6 (86.2–329.0)c | 219.3 (135.7–376.2) | 101.7 (42.3–196.0)d |
Data are expressed as means ± SDs or medians (25th to 75th percentiles).
Abbreviations: BMI, body mass index; DBP, diastolic blood pressure; SBP, systolic blood pressure.
P < 0.05 vs APA.
P < 0.05 vs EH.
P < 0.01 vs EH.
P < 0.01 vs APA.
Efficacy of the SIT for confirming PA
A slight elevation in BP was occasionally observed during the SIT process, but no other adverse effects were detected. The post-SIT PACs and ARRs were higher in the PA group than those in the EH group (both P < 0.01), although the values overlapped. The post-SIT PAC and ARR values were even higher in the APA group than those in the IHA group (Table 2). According to the guidelines, the postinfusion PAC cutoff was 10 ng/dL. We investigated the efficacy of the SIT for confirming PA. The post-SIT PAC was >10 ng/dL in the PA group, except in 3 out of 115 cases (9.5, 7.8, and 9.0 ng/dL; the first patient was diagnosed with APA, and the latter two were diagnosed with IHA). In the EH group, the post-SIT PAC remained >5 ng/dL in all 49 patients; 79.6% (39/49) of patients exhibited values between 5 to 10 ng/dL, and 21.3% (10/49) exhibited values between 10 and 15 ng/dL.
Changes in Aldosterone, PRA, and the ARR Observed During the SIT and CCT Among Patients With EH and PA
| EH (n = 49) | PA | |||
|---|---|---|---|---|
| Total (n = 115) | APA (n = 70) | IHA (n = 45) | ||
| Before SIT | ||||
| PAC (ng/dL) | 12.3 ± 2.7 | 28.7 ± 12.0a | 33.5 ± 12.5 | 21.4 ± 6.4b |
| PRA (ng/mL/h) | 0.49 (0.26–0.91) | 0.12 (0.07–0.26)a | 0.11 (0.06–0.22) | 0.14 (0.10–0.30) |
| ARR (ng/dL: ng/mL/h) | 24.3 (14.3–54.7) | 218.4 (77.6–469.1)a | 314.4 (143.1–546.1) | 172.0 (60.4–250.3) |
| After SIT | ||||
| PAC (ng/dL) | 8.8 ± 1.7 | 22.7 ± 10.2a | 26.7 ± 10.3 | 16.5 ± 6.3b |
| PRA (ng/mL/h) | 0.41 (0.22–0.60) | 0.14 (0.07–0.20)c | 0.11 (0.06–0.19) | 0.14 (0.10–0.25) |
| ARR (ng/dL: ng/mL/h) | 20.5 (13.8–41.9) | 184.6 (85.1–457.5)a | 285.5 (140.8–637.6) | 119.3 (51.1–208.8)b |
| Before CCT | ||||
| PAC (ng/dL) | 13.9 ± 3.3 | 30.0 ± 10.7a | 34.4 ± 10.6 | 23.4 ± 6.9b |
| PRA (ng/mL/h) | 0.66 (0.40–1.04) | 0.18 (0.10–0.34)a | 0.18 (0.10–0.32) | 0.19 (0.10–0.43) |
| ARR (ng/dL: ng/mL/h) | 23.2 (12.6–34.7) | 173.0 (77.6–273.8)a | 216.2 (98.4–353.4) | 108.0 (52.6–238.9) |
| After CCT | ||||
| PAC (ng/dL) | 11.7 ± 3.3 | 25.9 ± 10.6a | 30.0 ± 10.2 | 20.0 ± 8.1b |
| PRA (ng/mL/h) | 0.79 (0.43–1.31) | 0.35 (0.15–0.90)a | 0.22 (0.11–0.47) | 0.28 (0.11–0.56) |
| ARR (ng/dL: ng/mL/h) | 16.2 (8.1–32.0) | 99.6 (44.4–254.2)a | 120.1 (56.5–263.9) | 77.8 (29.3–224.5) |
Data are expressed as means ± SDs or medians (25th to 75th percentiles).
P < 0.01 vs EH.
P < 0.01 vs APA.
P < 0.05 vs EH.
Efficacy of the CCT for confirming PA
Captopril lowered BP but did not cause symptomatic hypotension or adverse effects. The PAC values before and after the CCT were clearly higher in the PA group (P < 0.01) than those in the EH group and even higher in the APA group than those in the IHA group (P < 0.05). According to the Endocrine Society guidelines, plasma aldosterone is normally suppressed by captopril (>30%). Thus, we determined whether this cutoff is appropriate for confirming PA in the Chinese subjects. After captopril, the PAC decreased by 14.2% in the PA group, 13.4% in the APA group, and 17.8% in the IHA group but was reduced by only 17.7% in the EH group. The suppression of aldosterone after the CCT did not significantly differ between the PA and EH groups (Fig. 1). The percentages of patients whose post-CCT PAC values did not decline were 22.5% (11/49) in the EH group and 21.7% (25/115) in the PA group. The percentage of patients whose aldosterone values decreased more than 30% after the CCT was only 26.5% (13/49) in the EH group. The post-CCT PAC was >15 ng/dL in patients with APA, except in 2 out of 70 cases (9.9 and 12.1 ng/dL). In the IHA group, the PAC post-CCT of 34 out of 45 patients exceeded 15 ng/dL, whereas in the EH group, the post-CCT PAC remained >15 ng/dL in 9 out of 49 cases.
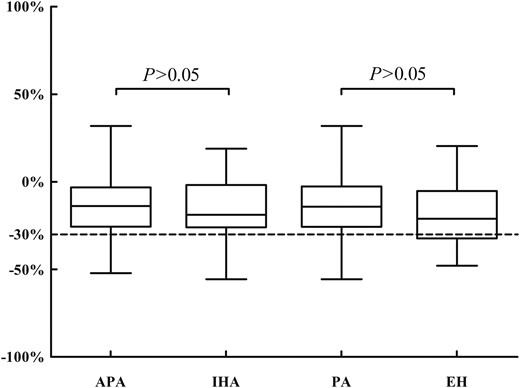
The suppression of aldosterone after the CCT in patients with EH and PA caused by an APA and an IHA.
As shown in Table 2, the post-CCT aldosterone concentrations in the PA group were much higher than those in the EH group. Therefore, we used ROC curves to compare the efficacy between aldosterone concentrations and the degree of PAC decline after CCT for diagnosing PA (Fig. 2). The ROC curve for post-CCT PAC was 0.933 (0.883 to 0.966), whereas the ROC curve for the post-CCT degree of PAC decline was 0.552 (0.472 to 0.629). These findings suggested the post-CCT PAC is more reliable than the degree of PAC suppression for confirming PA.
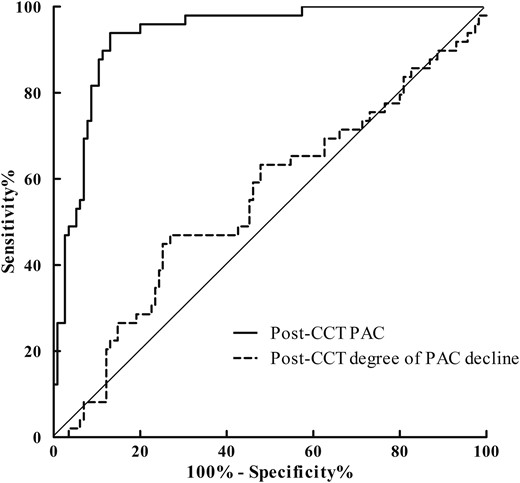
The ROC curves for post-CCT PAC and post-CCT degree of PAC decline.
Diagnostic accuracy of the SIT and CCT
Figure 3 presents post-CCT and post-SIT aldosterone concentrations in PA and EH subjects. ROC curve analysis was performed to determine the optimal cutoff values for confirming PA (Fig. 4). A PAC of 11.2 ng/dL after saline infusion represented the optimal cutoff value for PA diagnosis. The AUC for PAC detection was 0.972 [95% confidence interval (CI) = 0.934 to 0.991], which resulted in 90.4% sensitivity and 95.9% specificity with a PPV of 97.2% and an NPV of 80.7%. The positive and negative likelihood ratios were 17.84 and 0.23, respectively. A PAC of 16.7 ng/dL after captopril represented the optimal cutoff value for PA diagnosis, and the AUC for PAC detection was 0.933 (95% CI = 0.883 to 0.966), which resulted in 87.0% sensitivity and 91.8% specificity with a PPV of 96.1% and an NPV of 75.0%. The positive and negative likelihood ratios were 7.20 and 0.07, respectively. The optimal PAC cutoff values were higher after CCT than those after SIT, suggesting that the latter provides more potent suppression of aldosterone secretion.
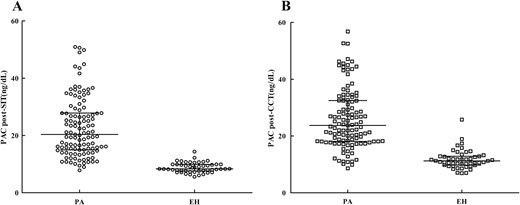
(A) Post-SIT and (B) post-CCT PACs in EH and PA groups.
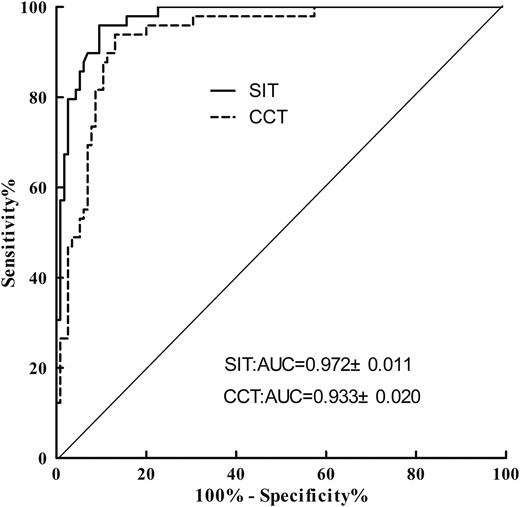
The ROC curves for PAC after SIT and CCT.
Discussion
The current study found that 75.7% of patients with PA exhibited hypokalemia (90% of those with APA and 51.1% of those with IHA). Furthermore, 58.6% of patients with APA had potassium values <3.0 mmol/L. Our results are consistent with those of another study conducted in Chinese patients, which revealed that only 4 out of 62 patients with PA did not have hypokalemia; this study involved 45 patients with PA and 17 with EH who had potassium levels of 2.8 ± 0.5 mmol/L (9). Clinical data obtained from Western populations indicate that hypokalemia accounts for only 9% to 37% of patients with PA after the widespread use of the ARR as a screening test for diagnosing this condition (5). Rossi et al. (10) reported that 60.6% of patients with PA were normokalemic. Why the incidence of hypokalemia is higher in the current study is unclear; however, the following possibilities deserve consideration. First, our hospital is a tertiary hospital in China. Hypertensive patients are commonly treated in local primary and secondary hospitals and referred to our hospital because of hypertension associated with hypokalemia or resistant hypertension. It is possible that some PA patients with normokalemic hypertension are missed in primary hospitals. We should strengthen the popularization of the Endocrine Society guidelines among doctors in referring hospitals and ramp up the screening of hypertensive patients at risk for PA in the future. Second, this discrepancy might be related to genetic susceptibility. Thyrotoxic periodic paralysis, which is rare among white patients, is quite common among Chinese male patients (11). Similarly, the incidence of hypokalemia in overweight/obese subjects is higher among Chinese males (12). A study conducted in Hong Kong also found that hypokalemic periodic paralysis was more frequent among Chinese patients than that among white patients (13). In addition, we acknowledge that this study adopted more stringent criteria than studies of white patients; therefore, it is possible that some PA patients with normokalemia were misclassified in the EH group.
Currently, the ARR is the most available screening method for PA, and the most commonly adopted cutoff values are 20 to 40 (ng/dL)/(ng/mL/h). PRA is reduced in some primary hypertensive patients, and a lower PRA level elevates the ARR even when the PAC is low/normal. A retrospective study conducted at the Mayo Clinic reported ARR values >20 (ng/dL)/(ng/mL/h) and PAC values >15 ng/dL in more than 90% of patients with surgically confirmed APA (14). However, another study found seated plasma aldosterone levels were less than 15 ng/dL in 36% of 74 patients diagnosed with PA (15). The result of this study revealed that supine plasma aldosterone levels exceeded 15 ng/dL in the PA group, except in 2 out of 115 cases (14.9 and 14.5 ng/dL, both diagnosed with IHA), which suggests that hypertension patients with a positive case detection and supine PAC values >15 ng/dL should be highly suspected of PA, especially APA.
The Endocrine Society’s 2016 clinical guidelines suggest that post-SIT plasma aldosterone levels <5 ng/dL are not indicative of PA, levels >10 ng/dL are a probable sign of PA, and values between 5 and 10 ng/dL are indeterminate (6). Most research studies have substantiated these cutoffs (7, 16–18). Some studies have reported that a PAC limit of 5 to 7 ng/dL after the SIT exhibits higher sensitivity and specificity values for diagnosing PA (9, 14, 19–21). Other studies have reported that the post-SIT PAC for IHA diagnosis is approximately within the range of 5 to 10 ng/dL (17, 18, 21, 22). In the current study, the PAC after the SIT exceeded 10 ng/dL in patients with PA, except for three cases with 9.48 (APA), 9.0, and 7.84 ng/dL (IHA); the optimal post-SIT PAC value was 11.2 ng/dL. This value provided high sensitivity (90.4; 95% CI = 83.5 to 95.1) and specificity (95.9; 95% CI = 86.0 to 99.5). The post-SIT aldosterone levels exceeded 5 ng/dL in all 49 patients with EH; 79.6% (39/49) were between 5 to 10 ng/dL, and others were between 10 and 15 ng/dL. Our results are consistent with those of another study of Chinese patients (23). The results of this study suggested that Chinese people are less responsive to the SIT than Westerners and that using the cutoff values recommended by the Endocrine Society guidelines might increase the false-positive rate for PA in Chinese subjects with hypertension.
According to the Endocrine Society guidelines, the CCT is positive for PA when the PAC is not suppressed by captopril (<30%). To the best of our knowledge, only a few studies have estimated the validity of the CCT for identifying PA in a Chinese population via the diagnostic cutoff value recommended by the guidelines. The major finding of this study was that it was difficult to differentiate patients with EH from those with PA using 30% suppression of PAC during the CCT. After captopril, the PAC decreased by 14.2% in the PA group, 13.4% in the APA group, and 17.8% in the IHA group, whereas it was reduced by only 17.7% in the EH group. The degree of aldosterone suppression during the CCT did not differ between the PA and EH groups. In addition, in the EH group, the post-CCT PAC did not decline for 22.5% (11/49) of patients, and the decrease in aldosterone of >30% after the CCT accounted for only 26.5% (13/49). Specifically, the degree of PAC suppression >30% exhibited low sensitivity and specificity in excluding the diagnosis of PA. If we chose a decrease in aldosterone levels <30% of the basal level after the CCT as a cutoff value as recommended by the guidelines, then misleading results might have been obtained with regard to patients with EH.
The evaluation of the captopril test has been based on the suppression of the serum concentration of aldosterone after inhibition of angiotensin-converting enzyme. A high salt intake has been postulated to inhibit the renin-angiotensin system activity and therefore may alter the results of the CCT. The Chinese diet is high in sodium, which might cause low reactivity for captopril. It is logical to speculate that long-term high-salt diet might be one of the factors for a lower response to CCT in Chinese subjects. Additional large-scale studies are needed to clarify this issue and other factors underlying the variation between Chinese and Western populations.
Several recent studies have recommended using the post-CCT PAC for confirming the diagnosis of PA (21, 24, 25). In 2009, the Japan Endocrine Society recommended a PAC >12 ng/dL after administration of 50 mg captopril as a positive confirmatory test (26). Rossi et al. (21) analyzed 243 patients undergoing CCT and reported that the best PAC cutoff value for diagnosing APA was 13.9 ng/dL. Earlier studies offered more consistent results and demonstrated that PAC levels remained >15 ng/dL in patients with PA after taking captopril (27, 28). In our study, the optimal post-CCT PAC cutoff value was 16.73 ng/dL, which is higher than that reported in previous studies. The diagnosis based on the post-CCT PAC was associated with relatively high accuracy (AUC = 0.933, 95% CI = 0.883 to 0.966), PPV (96.1%), and specificity (87.0%) in this study. These data indicate that the degree of PAC suppression was lower in Chinese patients using the CCT as a confirmatory test, which might reflect the low reactivity of aldosterone to the CCT in these participants. Despite the low reactivity of aldosterone to captopril, the CCT exhibited high accuracy and specificity for diagnosing PA when using a post-CCT PAC of 16.7 ng/dL as the cutoff value. Therefore, the post-CCT PAC is a reliable marker for diagnosing PA in a Chinese population, although the post-PAC cutoff value was slightly higher than that in a non-Chinese population.
Several studies have assessed the PAC among patients with PA after the SIT and CCT using ROC curves. In the PA Prevalence in Hypertensives study, the AUC of the SIT was higher than that of the CCT for identifying APA, but the difference was only marginally significant (21). The Japanese Endocrine Society recommended post-SIT and post-CCT PAC values of 6 and 12 ng/dL as cutoffs, respectively (26). In this study, ROC curve analysis demonstrated that the best cutoff for the PAC was 11.2 ng/dL after the SIT and 16.7 ng/dL after the CCT. The AUC for the PA group was 0.972 ± 0.011 after the SIT and 0.933 ± 0.020 after the CCT, which were higher than those in previous studies. The PPVs were 97.2% and 96.1% for the optimal aldosterone cutoffs of the SIT and CCT, respectively, whereas the NPVs were 80.7% and 75.0% for the SIT and CCT, respectively. These results indicated that the SIT was borderline significant with CCT, and SIT may have a slight advantage over the CCT in confirming the diagnosis of PA at the optimal cutoffs.
In summary, this study demonstrated that both the SIT and CCT are reliable functional tests for confirming the diagnosis of PA in patients with positive case detection. However, the optimal post-SIT and post-CCT aldosterone cutoff values for identifying PA were 11.2 and 16.7 ng/dL, respectively, in Chinese patients, which are slightly higher than those reported in patients of other ethnicities. The post-CCT degree of PAC suppression below 30% was inefficient for diagnosing PA in Chinese hypertension subjects.
Abbreviations:
- APA
aldosterone-producing adenoma
- ARR
aldosterone-to-renin ratio
- AUCROC
area under the receiver operating characteristic curve
- BP
blood pressure
- CCT
captopril challenge test
- CI
confidence interval
- EH
essential hypertension
- IHA
idiopathic aldosteronism
- NPV
negative predictive value
- PA
primary aldosteronism
- PAC
plasma aldosterone concentration
- PPV
positive predictive value
- PRA
plasma renin activity
- ROC
receiver operating characteristic
- SD
standard deviation
- SIT
saline infusion test.
Acknowledgments
Disclosure Summary: The authors have nothing to disclose.
