


Abstract
We previously demonstrated the anti-inflammatory and antioxidant effects of exenatide. We now hypothesized that exenatide also increases the plasma concentration of interleukin-1 receptor antagonist (IL-1RA), an endogenous anti-inflammatory protein, and modulates the nuclear factor erythroid 2‒related factor‒Kelchlike ECH-associated protein 1‒antioxidant response element (Nrf-2‒Keap-1‒ARE) system to induce key antioxidant enzymes to suppress inflammatory and oxidative stress.
Twenty-four patients with obesity and type 2 diabetes receiving combined oral and insulin therapy were randomly assigned to receive either exenatide 10 μg or placebo twice a day for 12 weeks.
Exenatide increased IL-1RA concentration by 61% (from 318 ± 53 to 456 ± 88 pg/mL; P < 0.05). Exenatide treatment also suppressed Keap-1 protein (P < 0.05) and increased messenger RNA expression of NQO-1, glutathione S-transferase PI, heme oxygenase-1, and p21 and increased NAD(P)H dehydrogenase [quinone] 1 protein (P < 0.05) in mononuclear cells.
Because IL-1RA protects, maintains, and stimulates β-cell function in humans and Nrf-2‒Keap-1‒ARE protects β cells in animals with experimental diabetes, these actions of exenatide may contribute to a potential protective effect on β cells in diabetes.
We previously demonstrated that exenatide exerts an anti-inflammatory effect (1). This effect is rapid, potent, and comprehensive and is reflected in the suppression of C-reactive protein, reactive oxygen species (ROS) generation, lipid peroxidation, intranuclear nuclear factor κB binding, and the expression of key proinflammatory cytokines (2). The anti-inflammatory effects are observed even after a single injection of 5 µg of exenatide within 2 hours. Because other proinflammatory mechanisms such as interleukin (IL)-1β and oxidative stress are involved in the pathogenesis of β-cell damage as well as diabetic microangiopathic and macroangiopathic complications, we embarked on further investigations of two other anti-inflammatory and antioxidative mechanisms.
The first deals with the interleukin 1 receptor agonist (IL-1RA), a peptide that is secreted largely by the liver and interferes with IL-1β signaling by binding to the IL-1 receptor. IL-1β contributes to the progressive impairment in β-cell function and numbers. This feature is known to be characteristic of type 2 diabetes. Indeed, the administration of IL-1RA has been shown to control type 2 diabetes through enhancement of insulin secretion (3). The powerful anti-inflammatory effect of IL-1RA has also been shown to control other inflammatory processes, such as those in rheumatoid arthritis (4) and gout (5). Because IL-1β is an inflammasome product (6) and IL-1RA has some similarities in its structure and binding with those of IL-1β (7, 8), we also investigated whether inflammasome-related genes are suppressed by exenatide.
Another mechanism, the nuclear factor erythroid 2‒related factor‒Kelchlike ECH-associated protein 1‒antioxidant response element (Nrf-2‒Keap-1‒ARE) system, was recently shown to be involved in the protection of the pancreatic β cell. The activation of AREs leads to the transcription of genes that have a cardinal role: the generation of key antioxidant enzymes through the neutralization of oxygen free radicals and protection from oxidative stress. Among these enzymes are NAD(P)H dehydrogenase [quinone] 1 (NQO-1), glutathione S-transferase PI (GSTP1), thioperoxidase, and heme oxygenase-1 (HO-1).
The activation of ARE and the transcription of these genes are dependent upon the nuclear factor erythroid 2‒related factor (Nrf)-2, which in the basal state is bound to Keap-1 and is kept within the cytosol (9). In addition, p21 binds to Nrf-2 and thus prevents the latter’s binding to Keap-1. It thus protects Nrf-2 activity. These antioxidant protective systems have been shown to be relevant to the protection of the β cell. Partial deletion of the Keap-1 gene led to protection from diet-induced obesity-related diabetes, whereas crossing of such mice with the db/db mouse led to lowering of blood glucose levels through an improvement in insulin secretion as well as a reduction in insulin resistance (10). Nrf-2 induction with partial deletion of Keap-1 also reduced oxidative damage to DNA in β cells and reduced accumulation of ROS and reactive nitrogen species with protection of β cells and increased insulin secretion. In addition, deletion of Nrf-2 led to extensive β-cell damage (11). The activity of the ARE enzymes has also been shown to be involved in protection from the development of diabetic nephropathy in mice with streptozotocin-induced diabetes (12, 13). In these animals, two different inactivators of Keap-1, the inhibitor of Nrf-2, were shown to be protective (13). However, this protection by sulforaphane and cinnamic aldehyde, the two inactivators of Keap-1, was lost when the gene for Nrf-2 was deleted. Therefore, in these animals, ARE-regulated enzymes clearly played an important role in mediating nephroprotection.
Our previous work showed that the Keap-1/Nrf-2 system is highly and acutely responsive to oxidative and inflammatory stress, as observed after the intake of a proinflammatory high-fat, high-carbohydrate fast-food meal (14). Thus, there is an increase in Keap-1 expression and a decrease in Nrf-2 activity (i.e., binding to ARE in the genes of antioxidant enzymes). Concomitant with this, there are reductions in the expression of NQO-1 and GSTP1, two key antioxidant enzymes whose gene expression is modulated by Nrf-2. In view of this, it is clearly important to prevent such rapid proinflammatory events either through lifestyle changes or through pharmacological intervention, especially in vulnerable populations such as patients with diabetes.
On the basis of this evidence and because we had shown previously that exenatide exerts rapid and potent ROS suppressive and anti-inflammatory effects (2), we hypothesized that exenatide exerts a stimulatory effect on IL-1RA concentrations and expression while also suppressing Keap-1 and thus stimulating the expression of Nrf-2‒modulated genes, NQO-1, GSTP1, and HO-1. Because p21 is a protein that binds to Nrf-2 and thus prevents its binding to Keap-1, to enhance the activity of Nrf-2 we examined its expression as well. We also investigated the inflammasome-related genes NLRP-3, caspase-1, and IL-18 (6).
Because we already had samples from our previously published study (2) on the anti-inflammatory effects of these two drugs, we used them for the investigations to test the hypotheses stated previously.
Subjects and Methods
Subjects
This is an ancillary study analyzing samples collected from a previously completed and published study investigating the effects of exenatide treatment on inflammation and oxidative stress in patients with type 2 diabetes (2). The original study was registered with clinicaltrials.gov (NCT no. 01154933). This was a single-center, randomized, placebo-controlled, single-blind (patient) prospective study. Twenty-four patients with obesity and type 2 diabetes with glycated hemoglobin A1c (HbA1c) values ranging between 7.5% and 9% participated in this study. None of the subjects had any microvascular or macrovascular complications of diabetes. All patients were receiving stable doses of oral antidiabetic medications and insulin and had stable weight during the 4 weeks before the study. All patients were taking metformin (1 to 2 g/d), and 14 patients were taking sulfonylureas (glyburide or glipizide 5 to 10 mg/d). Ten subjects (five each in the placebo and exenatide groups) were taking basal insulin (glargine) once daily, two in the placebo group were taking insulin aspart protamine and insulin aspart (rDNA origin) twice daily, and 12 (five in the placebo group and seven in the exenatide group) were taking a basal (glargine/detemir) and bolus (lispro or aspart) regimen. The doses of statins and angiotensin-converting enzyme inhibitors were not changed during the study. None of the subjects were taking thiazolidinediones, antioxidants, or nonsteroidal anti-inflammatory drugs. Patients’ demographic data are summarized in Table 1.
Patient Demographic Data and mRNA Expression in MNCs at Baseline and After 12 Weeks of 10-μg Exenatide or Placebo Twice Daily Therapy
| Group | Placebo | Exenatide | ||
|---|---|---|---|---|
| Baseline | At 12 Wk | Baseline | At 12 Wk | |
| Age, y | 54 ± 4 | 56 ± 3 | ||
| Weight, lb | 231 ± 13 | 234 ± 18 | 251 ± 18 | 251 ± 20 |
| BMI, kg/m2 | 39.1 ± 1.6 | 39.1 ± 1.7 | 39.8 ± 2.0 | 39.2 ± 1.8 |
| HbA1c, % | 8.5 ± 0.3 | 8.0 ± 0.3 | 8.6 ± 0.4 | 7.4 ± 0.5a |
| Diabetes duration, y | 12 ± 2 | 12 ± 2 | ||
| Fasting glucose, mg/dL | 128 ± 13 | 139 ± 33 | 139 ± 17 | 110 ± 9a |
| Fasting insulin, μU/mL | 13.1 ± 3.1 | 13.9 ± 5.9 | 12.7 ± 2.8 | 16.4 ± 3 a |
| Free fatty acids, mM | 0.64 ± 0.08 | 0.61 ± 0.09 | 0.69 ± 0.07 | 0.50 ± 0.03a |
| Insulin dose, U | 82 ± 13 | 88 ± 13 | 105 ± 30 | 105 ± 31 |
| IL-1β mRNA in MNCs, relative units | 0.54 ± 0.09 | 0.59 ± 0.11 | 0.47 ± 0.07 | 0.34 ± 0.06a |
| IL-1RA mRNA in MNCs, relative units | 0.92 ± 0.17 | 1.02 ± 0.23 | 1.03 ± 0.21 | 1.15 ± 0.18 |
| Procaspase-1 mRNA in MNCs, relative units | 0.84 ± 0.12 | 0.91 ± 0.18 | 0.92 ± 0.22 | 0.88 ± 0.15 |
| NLRP3 mRNA in MNCs, relative units | 0.65 ± 0.09 | 0.61 ± 0.11 | 0.69 ± 0.10 | 0.72 ± 0.12 |
Data are presented as mean ± standard error.
Abbreviation: BMI, body mass index.
P < 0.05; paired t test compared with baseline.
Patients were randomly assigned to receive either exenatide 10 µg or placebo (supplied by Amylin) 30 minutes before breakfast and dinner for 12 weeks. However, the dose of exenatide was started at 5 μg twice daily for 1 week to ensure tolerability. Blood samples were collected before (day 0) and at 3, 6, and 12 weeks after start of treatment after an overnight fast. Insulin doses were titrated downward by 20% to prevent hypoglycemia after the initiation of study treatment in subjects with an HbA1c value <8%. After initiation of the study treatment, insulin doses were titrated on weeks 3 and 6 to target fasting glucose levels <100 mg/dL and 2-hour postprandial glucose levels <160 mg/dL.
Mononuclear cell isolation
Blood samples were collected in Na-EDTA and were carefully layered on Lympholyte medium (Cedarlane Laboratories, Hornby, ON, Canada). Samples were centrifuged, and two bands were separated out at the top of the red blood cell pellet. The mononuclear cell (MNC) band was harvested and washed twice with Hank’s Balanced Salt Solution. This method provided yields of >95% MNC preparation.
Nrf-2 DNA binding assay
Nuclear Nrf-2 binding activity was measured with an enzyme-linked immunosorbent assay‒based TransAM Kit (Active Motive, Carlsbad, CA). The oligonucleotide used in the Nrf-2 assay contains the ARE consensus binding sequence. Nuclear extracts were prepared from MNCs by the high salt extraction method as previously described (15, 16).
Quantification of IL-1RA, IL-1β, procaspase-1, and NLRP-3, NQO-1, GSTP-1, HO-1, Keap-1, and p21 expression
Messenger RNA (mRNA) expression was measured in MNCs by real-time polymerase chain reaction (PCR): Total RNA was isolated using the commercially available RNAqueous®-4PCR Kit (Ambion, Austin, TX). Real-time PCR was performed using the Stratagene Mx3000P QPCR System (La Jolla, CA), SYBR Green Master Mix (Qiagen, Valencia, CA), and gene specific primers (Life Technologies, Waltham, MA). All values were normalized to the expression of a group of housekeeping genes including actin, ubiquitin C, and cyclophilin A. The normalization factor used was calculated by GeneNorm software and was based on the values of all housekeeping genes used.
Western blotting
MNC total cell lysates were prepared as electrophoresis and immunoblotting were carried out as described before (17). Polyclonal antibodies against Keap-1 and NQO-1 (Abcam, Cambridge, MA) and actin (Santa Cruz Biotechnology, Santa Cruz, CA) were used, and all values were corrected for loading to actin.
Plasma measurements
Glucose concentrations were measured in plasma by the YSI 2300 STAT Plus glucose analyzer (Yellow Springs, Ohio). An enzyme-linked immunosorbent assay was used to measure plasma concentrations of insulin (EMD Millipore, Billerica, MA), IL-1RA, IL-1β, and IL-18 (R&D Systems, Minneapolis, MN).
Statistical analysis
Statistical analysis was conducted using SigmaStat software (SPSS Inc., Chicago, IL). All data are represented as mean ± standard error. Baseline measurements were normalized to 100%, and changes from baseline were calculated as percentage change from baseline. Statistical analysis was carried out using one-way repeated-measures analysis of variance with the Holm-Sidak post hoc test. Two-factor repeated-measures analysis of variance followed by the Dunnett post hoc test was used for multiple comparisons between different treatments.
Results
Change in glucose homeostasis and body weight after exenatide treatment
Fasting blood glucose and HbA1c levels fell, whereas fasting insulin concentration increased (P < 0.05) (Table 1) in the exenatide group but did not change significantly in the placebo group (Table 1). None of the subjects had any major hypoglycemic episodes. Body weight was not altered significantly in either group.
Effect of exenatide treatment on plasma IL-1RA, IL-1β, and IL-18 concentrations
After 12 weeks of exenatide treatment, plasma concentration of IL-1RA increased significantly by 61% ± 18% (from 318 ± 53 to 456 ± 88 pg/mL), whereas that of IL-18 fell significantly by 19% ± 5% (from 546 ± 58 to 436 ± 46 pg/mL; P < 0.05 for both) (Fig. 1A and 1B). Plasma IL-1β levels did not change significantly. There was no significant change in these indices in the placebo group.
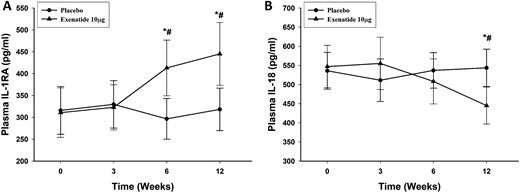
Change in plasma concentrations of (A) IL-1RA and (B) IL-18 after placebo and exenatide 10 μg daily for 12 weeks in patients with type 2 diabetes (n = 12 for each). Data are presented as mean ± standard error. *P < 0.05 by repeated-measures analysis of variance (RMANOVA; compared with baseline); #P < 0.05 by two-way RMANOVA compared with control groups.
Effect of exenatide on mRNA expression of IL-1β, IL-1RA, procaspase-1, and NLRP-3 in MNCs
The mRNA expression of IL-1β in MNCs fell significantly by 22% ± 10% (P < 0.05) (Table 1) after 12 weeks of exenatide treatment. The change in IL-1β mRNA expression was observed as early as 3 weeks after treatment with exenatide and continued throughout the treatment period. There was no significant alteration in the mRNA expression of IL-1RA, procaspase-1, and NLRP-3 in MNCs (Table 1).
Effect of exenatide on expression of antioxidant enzymes in MNCs
The mRNA expression of the antioxidant enzymes NQO-1, GSTP-1, and HO-1 in MNCs increased significantly by 51% ± 15%, 42% ± 10%, and 39% ± 10%, respectively (P < 0.05; Fig. 2A‒2C), after 12 weeks of exenatide treatment, whereas there was no significant change in these genes in the placebo group. The change in NQO-1, GSTP-1, and HO-1 mRNA expression was observed as early as 3 weeks after treatment with exenatide and continued throughout the treatment period. This was associated with a significant increase in the protein levels of NQO-1 by 25% ± 10% above the baseline (P < 0.05; Fig. 3A and 3B) in the exenatide group, whereas there was no significant change in NQO-1 protein after the placebo. We were not able to detect a protein signal from GSTP-1 and HO-1 in MNCs.
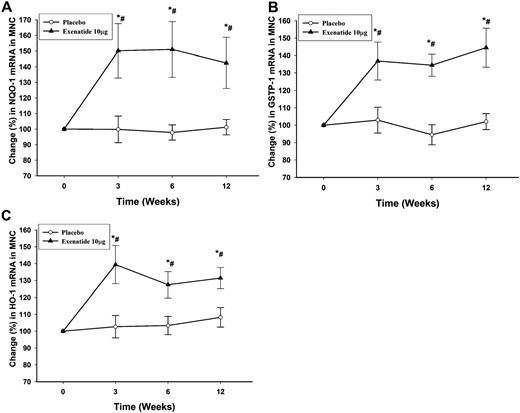
Percentage change in mRNA expression by real-time PCR in MNCs of (A) NQO-1, (B) GSTP-1, and (C) HO-1 after placebo and exenatide 10 μg twice a day for 12 weeks in patients with type 2 diabetes (n = 12 for each treatment arm). Data are presented as mean ± standard error. *P < 0.05 by repeated-measures analysis of variance (RMANOVA; compared with baseline); #P < 0.05 by two-way RMANOVA compared with placebo.
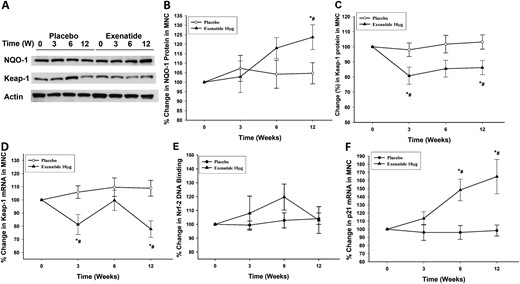
Representative (A) Western blot and densitometry analysis showing percentage change in (B) NQO-1 and (C) Keap-1 proteins and (D) the change in mRNA expression of Keap-1, (E) change in Nrf-2 DNA binding activity, and (F) mRNA expression of p21 in MNCs after placebo and exenatide 10 μg twice a day treatment for 12 weeks in patients with type 2 diabetes (n = 12 in each treatment arm). Data are presented as mean ± standard error. *P < 0.05 by repeated-measures analysis of variance (RMANOVA; compared with baseline); #P < 0.05 by two-way RMANOVA compared with matching placebo.
Effect of exenatide treatment on Nrf-2/Keap-1 activation and p21 expression in MNCs
Exenatide treatment significantly suppressed the protein expression of Keap-1 by 21% ± 8% and 17% ± 7% at 3 and 12 weeks of treatment, respectively (P < 0.05; Fig. 3A and 3C), whereas there was no significant change in Keap-1 in the placebo group. The fall in Keap-1 protein expression was associated with a significant fall in Keap-1 mRNA expression in MNCs by 18% ± 8% and 21% ± 6% at 3 and 12 weeks, respectively (P < 0.05; Fig. 3D). The fall in Keap-1 expression was associated with an increase in Nrf-2 DNA binding activity by 19% ± 10% at 6 weeks of exenatide treatment as assayed by binding to a consensus ARE-specific oligonucleotide. However, the increase did not reach statistical significance (P = 0.14; Fig. 3E), nor was it observed at 12 weeks. In addition, there was a significant increase in the expression of p21, a redox sensitive competitor of Keap-1 that stabilizes Nrf-2, by 68% ± 26% above baseline after 12 weeks of exenatide treatment (P < 0.05; Fig. 3F), whereas there was no change in the placebo group.
Discussion
Our data show clearly that the plasma concentration of IL-1RA was increased significantly by 61% after exenatide administration. Its expression in MNCs did not alter. It is therefore likely that the increase in its concentration occurred through its generation from other organs, such as the liver. Our observation is clinically relevant because IL-1RA is known to interfere with IL-1β signaling, to stimulate pancreatic β cells, and thus to improve diabetic control through insulinogenesis (3). Pancreatic β cells are known to express IL-1RA, and it protects this cell from the damaging effects of IL-1β (18). Its expression is diminished in type 2 diabetes. It is thus possible that exenatide administration exerts at least a part of its benefit in type 2 diabetes through an increase in IL-1RA.
Because IL-1β is known to be toxic to the β cell, especially in the presence of high glucose concentrations, the suppression of the expression of IL-1β is also important in the context of β-cell protection (19). It is also of interest that glucotoxicity is mediated by IL-1β production by the β cell itself (19). Although the expression of inflammasome-related genes was not altered in MNCs, plasma concentrations of IL-18 fell. IL-18 is an inflammasomal product. It is thus possible that other organs that secrete IL-18 may have inflammasomal suppression by exenatide. There is no evidence that IL-18 has a direct effect on β-cell function. It was investigated because it is an inflammasomal product like IL-1β is.
Exenatide also exerted a suppressive effect on Keap-1 and a stimulatory effect on the expression of the genes of three major antioxidant enzymes, NQO-1, GSTP1, and HO-1, starting at 3 weeks and continuing throughout the 12-week period of administration. The significant increase in these antioxidant enzyme genes is consistent with the suppression of ROS generation, which we demonstrated previously both acutely within 2 hours of exenatide injection and chronically after exenatide for 12 weeks (2). These actions contribute to a suppression of oxidative damage, which is known to occur in the chronic inflammatory states of obesity (20) and diabetes (6). In turn, oxidative stress is known to trigger inflammation. Oxidative damage leads to the damage of lipids, proteins, and DNA (21, 22). These changes contribute to the microvascular and macrovascular complications of diabetes (23). The suppression of Keap-1 was qualitatively similar to that seen after treatment with sulforaphane and cinnamic aldehyde in mice with streptozotocin-induced diabetes (2). Furthermore, there was an increase in the expression of p21 from 6 weeks onward. This protein is known to bind to Nrf-2 at sites that also bind to Keap-1 and thus prevents the inhibitory action of Keap-1 on the transcriptional activity of Nrf-2 (24). These changes were independent of weight loss as there was no weight loss in the group given exenatide.
Because hyperglycemia induces oxidative stress (25) and because the Nrf-2/Keap-1 system also responds promptly to the intake of a high-fat, high-calorie meal (14), we wanted to ascertain further whether this effect of exenatide was secondary to a reduction in glycemia. We therefore investigated the effect of a single dose of 5 µg of this drug and found that it induced the expression of NQO-1 and GSTP1 within 2 hours of the injection and sustained it for at least 6 hours. This effect was not associated with any change in plasma glucose and was therefore independent of a change in glucose concentrations. Such a rapid and glucose-independent effect was also observed in relation to the anti-inflammatory actions of this drug, as described by us previously (2). Nrf-2‒Keap-1‒ARE system activation has also been shown to have a role in the maintenance of euglycemia in mice with type 1 diabetes (26) and in rats with type 2 diabetes (27). This is relevant because glucagonlike peptide (GLP)-1 receptor agonists have recently been used successfully in patients with type 1 diabetes (28–30), especially in those with residual β-cell function. In addition, HO-1, a product of Nrf-2 activation, was shown to promote the production of IL-1RA in vitro and in animal models (31).
In spite of the consistent increase in the expression of the antioxidant enzymes regulated by Nrf-2, the suppression of Keap-1, its inhibitor, and the increase in p21, which prevents the binding of Keap-1 to Nrf-2, the increase in Nrf-2 was not significant at either 6 or 12 weeks. These observations raise the possibility that Keap-1 may have a direct inhibitory effect on the transcriptional activity of ARE or that other transcription factors participate in the regulation of these antioxidant genes. It is also possible that the balance between Keap-1 and p21 may determine the transcriptional activity of Nrf-2. This issue requires further investigation.
There are recent data demonstrating the protective role of the Nrf-2/Keap-1 system on β-cell preservation in experimental diabetes (11), as described previously. It is therefore possible that the stimulation of this comprehensive antioxidant system may contribute to the beneficial effect of exenatide and possibly other GLP-1 receptor agonists on β-cell function and preservation in type 2 diabetes, as demonstrated in the LIBRA trial (32) and potentially in those patients with type 1 diabetes who have residual β-cell function. The stimulation of β-cell function, however, lasts only for the duration of treatment with GLP-1 receptor agonists.
The weaknesses of this study are that it lasted a short duration of 12 weeks and had only 24 patients randomly assigned to two groups of 12 patients each. However, the data obtained are detailed at the cellular and molecular levels. Because it is important to exclude the possibility that these effects may be due to the reduction in hyperglycemia, which has proinflammatory effects, it is relevant that sitagliptin, which has glucose-lowering and anti-inflammatory effects, does not have any effect on IL-1RA or ARE-regulated genes (unpublished data).
We conclude that the increase in IL-1RA concentration is consistent with an additional anti-inflammatory effect of exenatide, which may enhance β-cell function. In addition, the suppression of the Keap-1 protein and the induction of p21 and the key antioxidant enzymes, NQO-1, GSTP1, and HO-1, by exenatide may be potentially protective to β-cell integrity and function independently of its glycemic effects. This potential benefit of exenatide and possibly other GLP-1 agonists needs to be explored and exploited further.
Abbreviations:
- ARE
antioxidant response element
- GLP-1
glucagonlike peptide
- GSTP-1
glutathione S-transferase PI
- HbA1c
glycated hemoglobin A1c
- HO-1
heme oxygenase-1
- IL
interleukin
- IL-1RA
interleukin-1 receptor antagonist
- Keap-1
Kelchlike ECH-associated protein 1
- MNC
mononuclear cell
- mRNA
messenger RNA
- NQO-1
NAD(P)H dehydrogenase [quinone] 1
- Nrf-2
nuclear factor erythroid 2‒related factor
- PCR
polymerase chain reaction
- ROS
reactive oxygen species
Acknowledgments
Financial Support: Amylin Pharmaceuticals (P.D.).
Clinical Trial Information: ClinicalTrials.gov no. NCT01154933 (registered 1 July 2010).
Disclosure Summary: The authors have nothing to disclose.
