


Abstract
Vitamin D status may affect cardiovascular disease (CVD) development and survival. We studied the relationship between concentrations of the circulating biomarker 25-hydroxyvitamin D (25OHD) and all-cause and cardiovascular mortality risk.
25OHD, the sum of 25-hydroxyvitamin D3 and 25-hydroxyvitamin D2, was analyzed in plasma samples from 4114 white patients suspected of having stable angina pectoris and was adjusted for seasonal variation. Hazard ratios (HRs) for all-cause and cardiovascular mortality were estimated by using multivariable Cox models with 25OHD as the main exposure variable, with adjustment for study site, age, sex, smoking, body mass index, estimated glomerular filtration rate, and systolic blood pressure.
A total of 895 (21.8%) deaths, including 407 (9.9%) from CVD causes, occurred during a mean ± standard deviation follow-up of 11.9 ± 3.0 years. Compared with the first 25OHD quartile, HRs in the second, third, and fourth quartiles were 0.64 [95% confidence interval (CI), 0.54 to 0.77], 0.56 (95% CI, 0.46 to 0.67), and 0.56 (95% CI, 0.46 to 0.67) for all-cause mortality and 0.70 (95% CI, 0.53 to 0.91), 0.60 (95% CI, 0.45 to 0.79), and 0.57 (95% CI, 0.43 to 0.75) for cardiovascular mortality, respectively. Threshold analysis demonstrated increased all-cause and CVD mortality in patients with 25OHD concentrations below ∼42.5 nmol/L. Moreover, analysis suggested increased all-cause mortality at concentrations >100 nmol/L.
Plasma 25OHD concentrations were inversely associated with cardiovascular mortality and nonlinearly (U-shaped) associated with all-cause mortality.
Plasma 25-hydroxyvitamin D (25OHD) is an intermediate metabolite in the conversion of acquired and stored vitamin D to the active metabolite calcitriol. A plasma concentration above 50 nmol/L is the target level for dietary intake recommendations of vitamin D in several countries (1, 2), based on differentiation between optimal and suboptimal skeletal health (1).
Vitamin D activity is implicated in the etiology of noncommunicable diseases (3), including cardiovascular diseases (CVDs), where calcitriol may regulate gene expression in cells involved in atherosclerosis (4, 5). Reduced vitamin D activity, as a result of dietary deficiency (6), metabolic dysfunction (7), or reduced availability of the vitamin D receptor (8), causes the development of unfavorable cardiovascular phenotypes in mice. These mechanistic studies demonstrate that vitamin D activity is required for cardiovascular health, which raises the question of whether physiologic variation in vitamin D status in humans may be implicated in the etiology or progression of CVDs.
Meta-analyses of prospective observational studies among predominantly healthy participants have indicated an inverse relationship between 25OHD levels and CVD mortality (9, 10). However, this relation is not observed when genetic variants are used as instrumental variables for 25OHD concentration (11–14), and published randomized controlled trials have not detected any effect of vitamin D supplementation on incident CVD (15, 16). Moreover, some prospective observational studies reported that a very high vitamin D status could be detrimental to CVD or all-cause mortality (17–19).
In contrast to studies among healthy persons, prospective observational studies in patients with stable CVD have reported inconsistent results for the association between 25OHD and the risk for CVD events (20–22). Additional studies could help determine whether the association is similar or differs between patients with CVD and healthy individuals. This is relevant to the extent to which results from ongoing clinical trials in healthy individuals may be generalized to patients. In the current study, we contribute with data on the relationship between circulating 25OHD concentration and the risk for all-cause and CVD mortality in 4114 patients suspected of having stable angina pectoris (SAP). An additional objective was to identify potential threshold concentrations associated with mortality, and stratified analyses were conducted to assess for differences in groups of statin treatment, disease status, and smoking status.
Patients and Methods
Study population
We used prospective observational data from 4164 adult and mostly white patients who underwent elective coronary angiography for suspicion of SAP at two university hospitals (Haukeland University Hospital and Stavanger University Hospital) in Norway (situated at 59 to 60 degrees North) (23). Recruitment started 14 April 1999 and ended 26 April 2004. We excluded 50 patients because of missing data and thus included 4114 patients in the final statistical analyses. Of these patients, 62% were also participants in the Western Norway B-Vitamin Intervention Trial (WENBIT; ClinicalTrials.gov identifier: NCT00354081) (24). WENBIT was a randomized trial aiming to study the effects of folic acid + vitamin B12 and/or vitamin B6 vs placebo on CVD and mortality outcomes, with a median follow-up period of 38 months. The studies were conducted according to the principles of the Declaration of Helsinki and approved by the Regional Committee for Medical and Health Research Ethics and the Norwegian Data Protection Authority. Participants gave written informed consent.
Baseline data and biochemical analyses
Self-administered questionnaires provided information on medical history, CVD risk factors, and medication. The data were validated against medical records when available. Questionnaires also asked about vitamin D supplement consumption and leisure time physical activity levels. Measurements of blood pressure, anthropometry, and blood sampling were conducted by trained study personnel. At Haukeland University Hospital, nonfasting blood samples were drawn before angiography. At Stavanger University Hospital, samples were taken from fasting patients in conjunction with the angiographic procedure. Participants who reported that they were current smokers or indicated that they have quit smoking ≤90 days before blood sampling, or those who had a measured plasma cotinine concentration ≥85nmol/L, were defined as smokers. Plasma cotinine was measured by liquid chromatography tandem mass spectrometry (25) at Bevital AS (Bergen, Norway). In addition, information was collected on the angiographic extent of clinically significant (≥50% diameter stenosis) coronary artery disease (CAD), measurement of left ventricular ejection fraction, C-reactive protein (CRP), apolipoprotein A1, and apolipoprotein B 100, as described previously (23). Estimated glomerular filtration rate (eGFR) was calculated with the formula suggested by the Chronic Kidney Disease–Epidemiology Collaboration (26). Diabetes mellitus was defined as a pre-existing diagnosis of type 1 or 2 diabetes. Plasma 25OHD2 and 25OHD3 concentrations were analyzed by using liquid chromatography tandem mass spectrometry (27) at Bevital AS. 25OHD2 and 25OHD3 values below the lower limit of quantification (6.6 nmol/L) were set to zero.
Follow-up and endpoints
Participants were followed until death or through 1 January 2013. Endpoints were defined according to the International Classification of Diseases, 10th revision (ICD-10), and CVD death included deaths ascribed to ICD-10 codes I00 and I99 in addition to R96. Information on cause of death was obtained from the Cause of Death Registry at Statistics Norway by linkage using each patient's unique personal identification number.
Statistical analyses
Each patient’s measured value of plasma 25OHD3 was adjusted for the seasonal variation in the study sample by using a cosinor model (28). The concentrations of 25OHD2 and seasonally adjusted 25OHD3 were then summed to reflect total 25OHD. Baseline characteristics are presented as mean ± standard deviation (SD) for continuous variables and numbers (percentages) for categorical variables. Characteristics were assessed and compared across plasma 25OHD quartiles by linear regression for continuous variables and logistic regression for categorical variables. Survival curves for all-cause and CVD mortality according to 25OHD were calculated with the Kaplan-Meier estimator and differences assessed by log-rank testing. Hazard ratios (HRs) with 95% confidence intervals (CIs) were assessed by using Cox proportional hazard models, and the assumption of proportional hazards was assessed by checking the Schoenfeld residuals. Covariates in multivariable models included study site, age, sex, smoking, body mass index, systolic blood pressure, and eGFR.
The risk for all-cause and CVD mortality was first assessed by modeling 25OHD as quartiles and thereafter as a continuous variable per 10-nmol/L incremental increase of 25OHD. We then visualized the association of 25OHD by adding penalized smoothing splines to the multivariable Cox model. The relationships were subsequently analyzed for possible thresholds. Following steps described previously (29), we considered values of 25OHD between 15 and 150 nmol/L with increments of 0.01 as a series of cutoff values that could be used to identify potential thresholds. For all cutoff values, we created a dichotomous exposure variable and included it in a Cox model while adjusting for aforementioned covariates. We then extracted Wald statistics for each model, which is closer to null when the relationship between all explanatory variables and the outcome is weaker and increases when the relationship is stronger. The cutoff value of 25OHD resulting in the model with the highest Wald statistic was considered as a potential threshold because it provides the most optimal separation of participants with high and low risk for the outcome (30). In addition, potential thresholds were considered from a combined interpretation of both the Wald statistics and the exposure-outcome relationship. Furthermore, we used the potential thresholds to categorize participants according to low, medium, and high 25OHD concentration. These categories were subsequently described and compared in terms of baseline characteristics, survival curves, and HRs.
We also assessed the risk for all-cause and CVD mortality by using threshold-derived categories of 25OHD concentrations in subgroups of sex, smoking status, CAD, diabetes, chronic kidney disease (eGFR ≤60 mL/min per 1.73 m2), statin treatment, and WENBIT intervention groups receiving combinations of B vitamins or placebo. In this analysis, non-WENBIT participants were categorized as receiving placebo. To test whether the risk differed by the subgroups, we tested for effect modification on a multiplicative scale and present the results as HRs with 95% CIs and P values. Statistical analyses were performed by using R statistical software (31). We included additional analyses as part of the peer review process. The association between vitamin D supplement use and the risk for all-cause and CVD mortality were assessed in multivariable models adjusting for the same covariates as in the analysis of plasma 25OHD. We also described the participants with detectable 25OHD2 concentrations in more detail to evaluate the possibility of reverse causation.
Results
Baseline characteristics
Plasma 25OHD ranged from 8.4 to 197 nmol/L, with a mean ± SD of 59.7 ± 19.2 nmol/L. The distribution of baseline characteristics across plasma 25OHD quartiles showed a positive relationship with vitamin D supplementation, physical activity, serum apolipoprotein A1 concentrations, LVEF, and statin use after the baseline visit and an inverse relationship with smoking, body mass index, inflammation (CRP level), diabetes, kidney function (eGFR), and serum triglyceride concentrations (Table 1). The proportion of patients taking vitamin D supplements regularly in each quartile were 20%, 30%, 40%, and 50%, respectively. The uneven distribution of patients from each study site indicated higher plasma 25OHD at one study site (Haukeland University Hospital, Bergen; 60.6 ± 19.8 nmol/L) in comparison with the other site (Stavanger University Hospital, Stavanger; 55.5 ± 17.3 nmol/L).
Descriptive Characteristics (n = 4114) According to Quartiles of Plasma 25OHD
| Characteristic | Plasma 25OHD Quartiles | P Value for Trend | |||
|---|---|---|---|---|---|
| 1st (n = 1029) | 2nd (n = 1028) | 3rd (n = 1028) | 4th (n = 1029) | ||
| 25OHD (range) (nmol/L) | 36.7 (8.4– 46.2) | 52.2 (46.3–58.1) | 64.4 (58.1–71.4) | 85.2 (71.4–197) | — |
| Study site Bergen, n (%) | 786 (76.4) | 828 (80.5) | 848 (82.5) | 905 (88.0) | <0.001 |
| Age (y) | 60.0 ± 11.0 | 61.8 ± 10.4 | 62.3 ± 10.3 | 62.9 ± 9.7 | <0.001 |
| Male sex, n (%) | 706 (68.6) | 737 (71.7) | 767 (74.6) | 749 (72.8) | 0.014 |
| Current smoker, n (%) | 406 (39.5) | 317 (30.8) | 283 (27.5) | 296 (28.8) | <0.001 |
| Body mass index (kg/m2) | 27.5 ± 4.6 | 27.2 ± 4.1 | 26.5 ± 3.6 | 25.9 ± 3.4 | <0.001 |
| C-reactive protein (mg/L) | 4.6 ± 8.6 | 3.4 ± 5.5 | 3.4 ± 7.0 | 3.4 ± 7.3 | <0.001 |
| Physically active, n (%) | 429 (59.4) | 493 (65.5) | 588 (73.3) | 625 (76.0) | <0.001 |
| Vitamin D supplements, n (%) | 175 (20.0) | 267 (30.0) | 371 (40.5) | 459 (50.2) | <0.001 |
| Diabetes mellitus, n (%) | 145 (14.1) | 127 (12.4) | 112 (10.9) | 106 (10.3) | 0.005 |
| Hypertension, n (%) | 488 (47.4) | 475 (46.2) | 470 (45.7) | 494 (48.0) | 0.856 |
| Systolic blood pressure (mm Hg) | 140 ± 21 | 141 ± 22 | 142 ± 21 | 142 ± 20 | 0.010 |
| eGFR (mL/min per 1.73 m2) | 91 ± 17 | 88 ± 17 | 87 ± 16 | 85 ± 18 | <0.001 |
| Serum triglycerides (mmol/L) | 1.98 ± 1.69 | 1.81 ± 1.01 | 1.67 ± 0.96 | 1.66 ± 1.03 | <0.001 |
| Serum apolipoprotein B100 (g/L) | 0.91 ± 0.27 | 0.90 ± 0.24 | 0.89 ± 0.23 | 0.90 ± 0.24 | 0.198 |
| Serum apolipoprotein A1 (g/L) | 1.27 ± 0.28 | 1.30 ± 0.26 | 1.33 ± 0.27 | 1.37 ± 0.26 | <0.001 |
| Extent of coronary artery disease, n (%) | |||||
| No stenotic vessel | 261 (25.5) | 252 (24.6) | 255 (25.0) | 261 (25.5) | 0.952 |
| 1 stenotic vessel | 233 (22.7) | 229 (22.3) | 235 (23.0) | 250 (24.4) | 0.339 |
| ≥2 stenotic vessels | 531 (51.8) | 544 (53.1) | 532 (52.1) | 514 (50.1) | 0.390 |
| LVEF (%) | 62.5 ± 12.2 | 64.7 ± 11.4 | 64.2 ± 10.7 | 64.8 ± 11.0 | <0.001 |
| Statin use before baseline visit, n (%) | 736 (71.5) | 766 (74.5) | 721 (70.1) | 758 (73.7) | 0.743 |
| Statin use after baseline visit, n (%) | 793 (77.1) | 843 (82.0) | 808 (78.6) | 847 (82.3) | 0.027 |
25OHD is the sum of 25-hydroxyvitamin D2 and D3 (nmol/L); "physically active" refers to physical activity for ≥2 h per week; "vitamin D supplements" refers to regular use. Unless otherwise noted, values are presented as mean ± SD or number (percentage). P values are unadjusted and derived from linear and logistic regression as appropriate.
Associations between plasma 25OHD and all-cause and CVD mortality
Mean ± SD duration of follow-up was 11.9 ± 3.0 years. A total of 895 (21.8%) deaths from all causes and 407 (9.9%) deaths from CVD occurred during follow-up. In comparison with the lowest quartile, multivariable HRs (95% CI) in the three upper quartiles of 25OHD concentration were 0.64 (95% CI, 0.54 to 0.77), 0.56 (95% CI, 0.46 to 0.67), and 0.56 (95% CI, 0.46 to 0.67) for all-cause mortality and 0.70 (95% CI, 0.53 to 0.91), 0.60 (95% CI, 0.45 to 0.79), and 0.57 (95% CI, 0.43 to 0.75) for CVD mortality, respectively (Table 2). Plasma 25OHD was inversely associated with the risk for all-cause and CVD mortality in multivariable models per 10-nmol/L incremental increase of 25OHD, with HRs of 0.91 (95% CI, 0.88 to 0.95) and 0.90 (95% CI, 0.85 to 0.95), respectively.
Association Between Plasma 25OHD and Risk for All-Cause and CVD Mortality
| Outcome | Continuous Plasma 25OHD: per 10 nmol/L (n = 4114) | Plasma 25OHD Quartiles | |||
|---|---|---|---|---|---|
| 1st (n = 1029) | 2nd (n = 1028) | 3rd (n = 1028) | 4th (n = 1029) | ||
| All-cause mortality | |||||
| Events (n) | 895 | 271 | 217 | 198 | 209 |
| Incidence rate | 2.21 | 2.77 | 2.11 | 1.93 | 2.03 |
| HR (95% CI) | |||||
| Crude | 0.96 (0.93–1.00) | 1.00 | 0.75 (0.63–0.90) | 0.69 (0.57–0.83) | 0.73 (0.61–0.87) |
| Multivariable modela | 0.91 (0.88–0.95) | 1.00 | 0.64 (0.54–0.77) | 0.56 (0.46–0.67) | 0.56 (0.46–0.67) |
| CVD mortality | |||||
| Events, n | 407 | 118 | 103 | 93 | 93 |
| Incidence rate | 1.01 | 1.20 | 1.00 | 0.91 | 0.90 |
| HR (95% CI) | |||||
| Crude | 0.95 (0.90–1.00) | 1.00 | 0.82 (0.63–1.07) | 0.74 (0.57–0.98) | 0.74 (0.57–0.98) |
| Multivariable modela | 0.90 (0.85–0.95) | 1.00 | 0.70 (0.53–0.91) | 0.60 (0.45–0.79) | 0.57 (0.43–0.75) |
25OHD refers to sum of 25-hydroxyvitamin D2 and D3 (nmol/L). Incidence rate is per 100 person-years.
Multivariable model (n = 4109) includes study site, age, sex, smoking, body mass index, systolic blood pressure, and eGFR.
Potential thresholds for relationship between plasma 25OHD and all-cause and CVD mortality
The distribution of plasma 25OHD in the study sample is shown in Fig. 1A. The exposure-outcome relationships of plasma 25OHD with the risks for all-cause mortality and CVD mortality are shown in Fig. 1B and 1C, respectively, and suggest nonlinear relationships. Potential thresholds were identified at 42.5 nmol/L for all-cause mortality (Fig. 1D) and at 40.9 nmol/L for CVD mortality (Fig. 1E). A second potential threshold for both endpoints at 100 nmol/L was indicated by the nonlinear risk curves and threshold analyses.
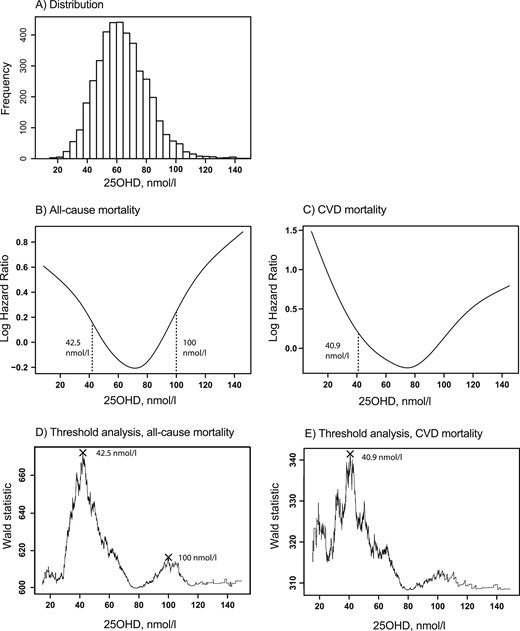
The analyses were performed among 4114 participants suspected of having SAP. (A) Distribution of 25OHD. (B and C) The functional relationships in parts B and C were analyzed by adding a penalized smoothing spline function to multivariable Cox models containing study site, age, sex, smoking, body mass index, systolic blood pressure, and kidney function. (D and E) The stippled lines are suggested risk thresholds derived from the analyses for potential thresholds, defined as most optimal differentiation of participants into groups with higher and lower risk for all-cause or CVD mortality, respectively.
Because the potential thresholds for all-cause and CVD mortality were similar, we chose to categorize the patients only according to the thresholds for all-cause mortality, including low (<42.5 nmol/L; n = 779), medium (42.5 to 100 nmol/L; n = 3214), and high (>100 nmol/L; n = 121) 25OHD concentrations. Cross-sectional differences in baseline characteristics according to these categories were similar to the differences between quartiles (Supplemental Table 1). Kaplan-Meier survival curves for all-cause and CVD mortality are shown for participants with low, medium, and high concentrations of 25OHD (Fig. 2). Log-rank test indicated a difference in survival between the groups for both endpoints (P < 0.001). In comparison with individuals with medium 25OHD concentrations, multivariable HRs for all-cause and CVD mortality were 1.94 (95% CI, 1.66 to 2.27) and 1.87 (95% CI, 1.49 to 2.36) among those with low concentrations and 1.79 (95% CI, 1.31 to 2.46) and 1.44 (95% CI, 0.87 to 2.37) among those with high concentrations, respectively (Table 3).
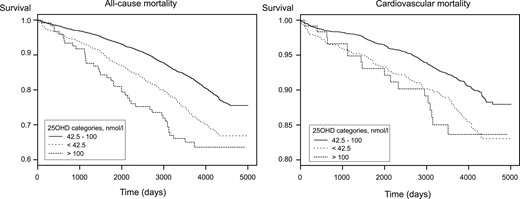
Kaplan-Meier estimate of all-cause (left) and CVD (right) mortality for 4114 patients suspected of having SAP according to categories of 25OHD concentrations.
Risk for All-Cause and CVD Mortality According to Categories of Plasma 25OHD
| Outcome | Categories of Plasma 25OHD | ||
|---|---|---|---|
| Low (<42.5 nmol/L) (n = 779) | Medium (42.5–100 nmol/L) (n = 3214) | High (>100 nmol/L) (n = 121) | |
| All-cause mortality | |||
| Events (n) | 227 | 625 | 43 |
| Incidence rate | 3.12 | 1.94 | 4.08 |
| HR (95% CI) | |||
| Crude | 1.64 (1.41–1.91) | 1.00 | 2.18 (1.60–2.96) |
| Multivariable modela | 1.94 (1.66–2.27) | 1.00 | 1.79 (1.31–2.46) |
| CVD mortality | |||
| Events (n) | 101 | 289 | 17 |
| Incidence rate | 1.39 | 0.90 | 1.61 |
| HR (95% CI) | |||
| Crude | 1.57 (1.25–1.97) | 1.00 | 1.84 (1.13–3.00) |
| Multivariable modela | 1.87 (1.49–2.36) | 1.00 | 1.44 (0.87–2.37) |
25OHD refers to sum of 25-hydroxyvitamin D2 and D3 (nmol/L). Incidence rate is per 100 person-years.
Multivariable model (n = 4109) includes study site, age, sex, smoking, body mass index, systolic blood pressure, and eGFR.
Subgroup analyses
The excess risk for all-cause and CVD mortality associated with plasma 25OHD <42.5 nmol/L did not vary substantially in subgroups of sex, smoking status, extent of CAD, diabetes, kidney function, statin treatment, or WENBIT study treatment, but trends toward differences were observed for plasma 25OHD >100 nmol/L (Supplemental Tables 2 and 3). The excess risk for all-cause mortality for patients with 25OHD >100 nmol/L appeared to be confined to patients with CAD and to statin users (79% with CAD and 53% without CAD use statins), whereas the excess risk for CVD mortality was confined to statin users and participants without chronic kidney disease. In comparison with patients with no regular intake of cod liver oil or vitamin D supplements, HRs among participants with regular intake were 0.92 (95% CI, 0.79 to 1.07) for all-cause mortality and 0.75 (95% CI, 0.60 to 0.95) for CVD mortality. The 80 individuals with detectable levels of 25OHD2 constituted 1%, 2%, and 7% of the groups with low, medium, and high 25OHD concentrations, respectively, and were collectively more likely to die during follow-up (35%) than the sample as a whole (22%).
Discussion
Principal findings
Plasma 25OHD demonstrated an inverse association with CVD mortality and a nonlinear (U-shaped) association with all-cause mortality. Analyses suggested that a threshold around 42.5 nmol/L may best discriminate between high- and low-risk groups for both endpoints and that a threshold of 100 nmol/L might further discriminate between low and high risk for all-cause mortality.
Previous observational studies
Previous observational studies of the relation between 25OHD and CVD risk were mostly conducted in populations without CHD, most of which report inverse relationships (32, 33); however, a few studies, such as the large Danish Cop-D study, report nonlinear relationships (19, 34). Among the studies performed in patients with CHD, the most comparable to our study is the Ludwigshafen Risk and Cardiovascular Health (LURIC) study (20), which included 3258 white German patients referred to coronary angiography for suspicion of SAP or acute coronary syndrome. The prevalence of clinically significant CAD (68%) at baseline was similar to that in our study sample (75%). The authors observed an inverse linear association with all-cause and CVD mortality across quartiles of 25OHD, with no indications of a U-shaped pattern when they compared the lowest and highest 25OHD deciles. A lower mean total 25OHD concentration (42.4 nmol/L in the LURIC study vs 59.7 nmol/L in the current study) may explain why an increased risk at high concentrations (>100 nmol/L) was not observed in the LURIC study. The higher observed 25OHD concentrations in this study may be the result of high vitamin D supplement use in the sample (35%), as well as in Norwegians in general, which is mostly in the form of cod liver oil. When all confounders and potential mediators were included, neither the German KAROLA study (n = 1125; median 25OHD of 55 nmol/L) nor the American Heart and Soul Study (n = 946; mean 25OHD of 64.5 nmol/L) demonstrated an association with all-cause or CVD mortality after 8 years of follow-up in mostly white patients with stable coronary heart disease (21, 22). In contrast, a U-shaped association between serum 25OHD and the risk for in-hospital death and 12-month mortality was observed in German patients undergoing cardiac surgery (18). And lastly, a recent clinical trial in patients with heart failure found that patients who were randomly assigned to vitamin D supplements, and who thereby obtained a 25OHD level >100 nmol/L, had greater need for mechanical circulatory support implantation during 3 years of follow-up compared with those receiving placebo (although they were not at increased risk for mortality) (35).
Interpretation of current findings
In linear risk models, we observed an overall inverse association of plasma 25OHD with all-cause and CVD mortality, supporting a role for low vitamin D in CVD risk. Categorical modeling in 25OHD quartiles indicated that the difference in risk primarily was observed between the first and second quartiles, which matched with potential thresholds at ∼42.5 nmol/L. Vitamin D sufficiency is currently defined by a 25OHD concentration of ≥50 nmol/L, with most patients differentiated according to optimal and suboptimal skeletal health (1, 2). Our findings suggest that a similar threshold may also apply to CVD risk.
However, we also observed increased risk for all-cause mortality at particularly high plasma 25OHD concentrations, indicating a U-shaped relationship. Risk estimates were in the same direction for CVD mortality, albeit numerically weaker and with wider CIs. A limited number of patients (n = 121) had very high 25OHD, and thus these findings should be interpreted with caution. For example, this association could result from random variation, residual confounding, or reverse causation. Patients with higher CVD risk or vitamin D deficiency could be more likely to take or be prescribed higher doses of vitamin D supplements. However, we did not find evidence that vitamin D supplement use per se, which was common in our sample, was associated with a higher risk for all-cause or CVD mortality. On the contrary, supplement use was associated with a lower risk for CVD mortality. There were also no indications that participants with high 25OHD had more severe CAD at baseline. They appeared healthier in terms of several risk factors despite their older age, including the level of physical activity. One notable difference, however, was the particularly low eGFR in patients with very high 25OHD. Detectable concentrations of 25OHD2 in patients with high total 25OHD could be especially indicative of vitamin D supplementation because of prior deficiency and therefore further indicate the possibility for reverse causation (36). We found that patients with detectable 25OHD2 concentrations were more likely to die during follow-up and also to be slightly overrepresented in the group with 25OHD >100 nmol/L. However, it does not fully account for the higher risk for mortality in this group.
There are concerns that statin treatment and vitamin D status may interact, and several mechanisms in opposite directions have been proposed (37–39). In particular, the safety and efficacy of bolus vitamin D supplementation have been investigated [reviewed by Glueck et al. (40)] as a treatment of statin-associated muscle symptoms, and it was concluded that further studies are warranted. In our study, we did not observe that the excess risk for all-cause or CVD mortality associated with low plasma 25OHD differed substantially by statin treatment or other covariates. The association with plasma 25OHD > 100 nmol/L, however, differed in the sense that we observed higher risk for all-cause and CVD mortality only among statin-treated patients, although the number of CVD deaths among patients not treated with statins was very low. Nonetheless, the observed heterogeneity is interesting and potentially important, but we acknowledge that because this was a secondary analysis not adjusted for multiple comparison, it may be spurious or result from reverse causation.
Potential mechanisms
The current study supports that vitamin D status is associated with the risk for all-cause and CVD mortality. Vitamin D activity may affect endothelial function, fibrosis, and inflammation, which are processes relevant to stenosis progression and atheromatous plaque stability (3). However, in a previous study from the same cohort, which was restricted to patients who underwent repeated coronary angiography, we did not observe an association of 25OHD with stenosis progression during ~1 year of follow-up (41). Hence, results from the current study may point to a mechanistic role for vitamin D status in plaque stability rather than volume.
The current study also suggests that high vitamin D level may be associated with excess all-cause mortality, potentially mediated in part by increased CVD mortality risk. Vitamin D status is relevant to the regulation of many genes, but the main function is to maintain systemic calcium concentrations. Genetically elevated serum calcium levels were recently shown to increase the risk for CAD and myocardial infarction (42), and vitamin D status could play a modifying role by lowering the threshold for safe intake of dietary calcium. An extreme example is patients with elevated vitamin D activity due to rare genetic mutations that reduce vitamin D catabolism; these patients must limit dietary intake of calcium and vitamin D to prevent elevated calcium concentrations, soft tissue calcification, and chronic kidney disease (43). Accordingly, it is important to assess whether there are common genetic variants of vitamin D and calcium metabolism that may interact with vitamin D status and calcium intake over the life course to influence CVD risk. A recent trial found that plasma calcium was increased in patients with heart failure randomly assigned to vitamin D supplementation and that they had greater need for mechanical circulatory support implantation during follow-up than did the placebo group (35). Although the trial did not find an increased risk for mortality from vitamin D supplementation, the combined results from that trial, our study, and other observational studies warrant concern regarding high 25OHD values in patients with pre-existing CVD. The findings remind us that it is important to thoroughly assess the safety of long-term vitamin D supplementation in ongoing clinical trials.
Methodological considerations
The study design was prospective, the follow-up period long, and the study sample large and clearly confined to patients with stable SAP. We have previously observed that patients with acute coronary syndrome have lower concentrations of 25OHD (−10 nmol/L) and more systemic inflammation as defined by higher CRP (>10 mg/L) than patients suspected of having SAP (41). The inverse relationship between inflammation and 25OHD is well documented, and a CRP >20 mg/L may render 25OHD measurements unreliable as biomarker of vitamin D status (44). Hence, we argue that plasma 25OHD in this cohort may better reflect vitamin D status than in cohorts with higher levels of inflammation. A current area of investigation is the role of the different circulating fractions of 25OHD. Free or albumin-bound 25OHD could be more easily transported through the membrane of target cells and correlate more strongly with vitamin D activity, and their relation to the risk for CVD differs from the relation to total 25OHD or the fraction bound to vitamin D binding protein (45). Given that this is the case, the findings for total 25OHD in this study of mostly white men might not be detected in populations for which the fraction of protein bound 25OHD is different (45, 46). The thresholds reported in the current study were identified by applying a statistically reproducible method that was previously used for the same purpose (29).
We were able to control for several potential confounders, but information on socioeconomic position was not available, and physical activity was based on self-report and was not available for all patients. We also did not have data on the concentrations of parathyroid hormone, which could be a mediator of vitamin D activity in relation to CVD (22). Inability to fully include these characteristics in statistical analyses is a limitation of the study. Given that Mendelian randomization studies (11–14) and randomized clinical trials (15, 16) have not found an association between 25OHD and a lower risk for CVD, the findings in this study and similar prospective observational studies might be biased because of residual confounding or reverse causation. Another limitation is that patient characteristics were based on single measurements because their validity may decrease with longer follow-up. The Norwegian Cause of Death Registry provided data on all-cause and CVD mortality for all participants. Information on the cause of death in the registry is almost exclusively based on certificates filled out by onsite medical doctors (47). In cases where autopsies were performed, 32% of the causes of deaths were reclassified from one ICD-10 chapter to another; this is a source of inaccuracy and a limitation regarding CVD-related mortality, but not all-cause mortality (47).
Conclusions
In this observational study of white patients suspected of having SAP, we observed an inverse association between plasma 25OHD and the risk for CVD mortality and a nonlinear (U-shaped) association with the risk for all-cause mortality. Our data suggest that a potential threshold of ~42.5 nmol/L may best discriminate between groups with low and high risk for both outcomes, and that all-cause mortality is also higher in the small group of patients with concentrations > 100 nmol/L.
Abbreviations:
- 25OHD
25-hydroxyvitamin D
- CAD
coronary artery disease
- CI
confidence interval
- CRP
C-reactive protein
- CVD
cardiovascular disease
- eGFR
estimated glomerular filtration rate
- HR
hazard ratio
- ICD-10
International Classification of Diseases, 10th revision
- LURIC
Ludwigshafen Risk and Cardiovascular Health
- SAP
stable angina pectoris
- SD
standard deviation
- WENBIT
Western Norway B-Vitamin Intervention Trial.
Acknowledgments
We thank all the participants and coworkers at Haukeland University Hospital, Stavanger University Hospital, and Bevital A/S, Bergen.
Financial Support: The work was funded by the Norwegian Foundation for Health and Rehabilitation (O.N.); the Norwegian Heart and Lung Patient Organization (O.N.); the Norwegian Ministry of Health and Care Services; the Western Norway Regional Health Authority; the Department of Heart Disease at Haukeland University Hospital, Bergen (O.N.), the Foundation to Promote Research Into Functional Vitamin B12 Deficiency (O.N.), Bergen; and Alpharma Inc. (O.N.), Copenhagen, Denmark.
Clinical Trial Information: Western Norway B-Vitamin Intervention Trial. ClinicalTrials.gov Identifier: NCT00354081 (registered 20 July 2006).
Disclosure Summary: The authors have nothing to disclose.
