


Abstract
Routine radioactive iodine (RAI) ablation for low-risk differentiated thyroid cancer (DTC) is not supported by current practice guidelines.
To assess recent stage-specific trends in use of RAI ablation.
Retrospective study of patients with DTC (1999 to 2015) identified from the California Cancer Registry. Statistical analysis included standardized differences, P values, and multivariable analyses using RAI as the predictor variable.
Trends and drivers of RAI ablation for low-risk DTC.
Of 46,906 patients with DTC who underwent near-total or total thyroidectomy [mean age 48.2 ± 15.5 (standard deviation) years, 77% female), 25,457 (54%) received RAI. The proportion of patients with regional/distant disease who received RAI remained stable at 68%. Use of RAI for patients with localized disease (no extrathyroidal extension, lymph node, or distant metastases) decreased from 55% (1999) to 30% (2015), with the most substantial change occurring in tumors <1 cm (39% to 11%). The rate also decreased for localized tumors between 1 and 2 cm (62% to 34%) and 2 and 4 cm (67% to 49%) and remained stable at 59% for tumors >4 cm. In multivariable analyses, patients with localized disease were less likely to receive RAI if they were >65 years old [odds ratio (OR) 0.77, 95% confidence interval (CI): 0.71 to 0.83], had tumors <1 cm (OR 0.33, 95% CI: 0.31 to 0.35), or were treated in an academic hospital (OR 0.71, 95% CI: 0.67 to 0.75).
The rate of RAI ablation decreased over time, mainly attributable to decreased use for localized DTCs <2 cm. Many patients with low-risk DTC still receive RAI unnecessarily.
Thyroid cancer is the most common endocrine malignancy in the United States, with differentiated thyroid cancer (DTC) comprising up to 90% of cases (1, 2). Historically, patients were routinely treated with total thyroidectomy, followed by radioactive iodine (RAI) ablation. RAI ablation reduces the risk of recurrence and improves survival in patients with high-risk DTC (3, 4). RAI ablation has not been demonstrated to improve outcomes in patients with low-risk DTC, commonly defined as tumors <4 cm with no gross lymphadenopathy or local invasion (5, 6).
Revised national guidelines from the American Thyroid Association (ATA), published in 2009, discouraged routine RAI ablation for patients with low-risk DTC, and this was further emphasized in the 2015 updated ATA guidelines (7, 8). Adverse outcomes of RAI ablation include decreased fertility and increased risk of secondary malignancies (9, 10). Unnecessary RAI use also exposes patients to increased health care costs associated with thyroid cancer treatment (11). Prior studies have found wide variability in RAI administration as a result of uncertainty regarding its benefits and risks (12–15).
Given the increasing prevalence of low-risk DTC, ongoing analysis of appropriate and inappropriate RAI use is critical to help guide current and future practice patterns. We analyzed the time trends of RAI ablation from 1999 to 2015 on a population level in California and determined the drivers of RAI ablation in patients with low-risk DTC. We hypothesized that the rates of RAI ablation in patients with low-risk DTC decreased following publication of the 2009 ATA guidelines.
Materials and Methods
Setting and subjects
The California Cancer Registry (CCR) is a statewide cancer surveillance system that collects information on all cancers diagnosed in California. Data from patients diagnosed with thyroid cancer between 1 January 1999 and 31 December 2015 were extracted from the CCR database. Cases of DTC were identified using thyroid site code C739 in combination with ICD-O-3 histology codes 8050, 8260, 8330 to 8332, 8335, 8340, 8342 to 8344, and 9690. Patients who underwent lobectomy or near-total or total thyroidectomy were identified using the CCR variable SURGPRIM, which codes for the most extensive type of surgery during the first stage of treatment. Only patients who received near-total or total thyroidectomy were included in the analysis of RAI trends. The study was approved by the University of California, Los Angeles, Institutional Review Board.
Patients who received RAI were identified using the CCR variable RADSUM, which codes for the type of radiation received during the first course of treatment. The date of diagnosis of thyroid cancer was determined using the CCR variable DATEDX. The study cohort was subdivided by disease stage, using the CCR variable SUMSTAGE, which codes for summary stage at time of diagnosis. Summary stage categorizes disease stage as localized (confined to thyroid), regional (extrathyroidal extension or nodal metastasis), or distant.
Demographic and clinical variables extracted from CCR included age at diagnosis, sex, race/ethnicity, socioeconomic status (SES), tumor stage, tumor size, lymph node involvement, and presence of extrathyroidal extension. Patients were stratified into three age groups: 18 to 44, 45 to 65, and >65 years. Race/ethnicity was defined by the following groups: Hispanic, Non-Hispanic white, Non-Hispanic black, and Asian/Pacific Islander. SES quintiles were calculated based on the Yost index (16). Hospitals were categorized as academic vs nonacademic, based on affiliation with an academic institution, by using the CCR variable HOSPNO, which codes for a unique hospital number.
Papillary thyroid cancer was defined by histology codes 8050, 8260, 8340, and 8342 to 8344. Low-risk DTC was classified by both tumor size and summary stage at the time of diagnosis, in accordance with the 2009 ATA guidelines (7). This included tumor size <4 cm and localized disease stage with no lymph node or distant metastasis.
Statistical analysis
Summary statistics were used to describe baseline characteristics. Standardized differences (SDi) were used to represent differences in effect sizes when comparing demographics and clinical characteristics between patients who received RAI and patients who did not receive RAI. SDi serves as an effective statistical measure for comparing effect sizes and imbalances between two groups when no hypothesis testing is being performed (17, 18). SDi of 0.2, 0.5, and 0.8 represents small, medium, and large effect sizes, respectively.
The rate of RAI ablation was analyzed annually over the study period and was additionally compared before and after 2009 to assess for a potential decrease following publication of the ATA guidelines. RAI ablation rates were also analyzed in the localized disease subgroup based on age, sex, race/ethnicity, tumor size, SES, and hospital status (academic vs nonacademic). Univariable and multivariable logistic regressions were performed using RAI as the predictor variable with stepwise selection. For the logistic regression models, the odds ratio (OR) and 95% confidence intervals (CIs) were reported. Analyses were performed using SAS version 9.4 (SAS Institute, Cary, NC).
Results
From 1999 to 2015, 56,622 patients were diagnosed with DTC in California. Of these, 6883 patients underwent lobectomy, and 46,906 patients underwent total or near-total thyroidectomy. Whereas the absolute volume of both procedures increased steadily over the study period, the proportion of patients who underwent lobectomy remained relatively constant, ranging between 9.7% and 16.6% annually. The rate of lobectomy did not increase over the study period (16.6% in 1999 to 13.5% in 2015).
DTC patients who underwent near-total or total thyroidectomy
The mean age was 48.2 ± 15.5 (standard deviation) years, and 77.1% of patients were female (Table 1). The mean tumor size was 2.3 ± 5.1 (standard deviation) cm. Following thyroidectomy, 54.3% of patients received RAI ablation over the entire study period. Compared with patients who did not undergo RAI, patients who received RAI were more likely to have extrathyroidal extension (25.1% vs 13.8%, P < 0.01) and lymph node involvement (38.2% vs 19.9%, P < 0.01) (Table 2).
Demographic Characteristics of Patients Who Underwent Near-Total or Total Thyroidectomy for DTC Between 1999 and 2015
| All Patients (N = 46,906) | No RAI (n = 21,449) | RAI (n = 25,457) | SDi | |
|---|---|---|---|---|
| Age, y (means ± SD) | 48.2 ± 15.5 | 49.5 ± 15.5 | 47.1 ± 15.4 | −0.16 |
| Sex, n (%) | 0.08 | |||
| Female | 36,156 (77.1) | 16,895 (78.8) | 19,261 (75.7) | |
| Male | 10,746 (22.9) | 4551 (21.2) | 6195 (24.3) | |
| Race/ethnicity, n (%) | 0.09 | |||
| Whitea | 24,664 (52.6) | 11,437 (53.3) | 13,227 (52.0) | |
| Blacka | 1659 (3.5) | 866 (4.0) | 793 (3.1) | |
| Hispanic | 12,468 (26.6) | 5504 (25.7) | 6964 (27.4) | |
| Asian/Pacific Islandera | 7529 (16.1) | 3323 (15.5) | 4206 (16.5) | |
| SES quantile, n (%) | 0.07 | |||
| Lowest | 5746 (12.9) | 2850 (14.1) | 2896 (12.0) | |
| Lower-middle | 7674 (17.3) | 3541 (17.5) | 4133 (17.1) | |
| Middle | 8985 (20.2) | 4020 (29.9) | 4965 (20.5) | |
| Higher-middle | 10,373 (23.3) | 4586 (22.7) | 5787 (23.9) | |
| Highest | 11,685 (26.3) | 5245 (25.9) | 6440 (26.6) | |
| Unknown | 2443 (5.2) | 1207 (5.6) | 1236 (4.9) | |
| Hospital type, n (%) | 0.13 | |||
| Nonacademic | 34,326 (73.2) | 15,018 (70.0) | 19,308 (75.9) | |
| Academic | 12,022 (25.6) | 6136 (28.6) | 5886 (23.1) |
Abbreviation: SD, standard deviation.
Non-Hispanic.
Tumor Characteristics of Patients Who Underwent Near-Total or Total Thyroidectomy for DTC Between 1999 and 2015
| All Patients (N = 46,906) | No RAI (n = 21,449) | RAI (n = 25,457) | SDi | |
|---|---|---|---|---|
| Tumor size, cm (means ± SD) | 2.3 ± 5.1 | 2.0 ± 5.5 | 2.5 ± 4.6 | 0.10 |
| Summary stage, n (%) | 0.46 | |||
| Localized | 28,475 (60.7) | 15,577 (72.6) | 12,898 (50.7) | |
| Regional/distant | 18,265 (38.9) | 5796 (27.0) | 12,469 (49.0) | |
| Extrathyroidal extension, n (%) | 0.29 | |||
| Yes | 9346 (19.9) | 2959 (13.8) | 6387 (25.1) | |
| No | 37,433 (79.8) | 18,428 (85.9) | 19,005 (74.7) | |
| Lymph node involvement, n (%) | 0.41 | |||
| Yes | 14,013 (29.9) | 4278 (19.9) | 9735 (38.2) | |
| No | 31,663 (67.5) | 16,480 (76.8) | 15,183 (59.6) | |
| Histology, n (%) | 0.03 | |||
| Papillary | 31,079 (66.3) | 14,070 (65.6) | 17,009 (66.8) | |
| Nonpapillary | 15,827 (33.7) | 7379 (34.4) | 8448 (33.2) |
Abbreviation: SD, standard deviation.
The rate of RAI ablation decreased from 62.6% in 1999 to 43.3% in 2015 (Fig. 1). The rate of RAI ablation remained relatively stable for patients with regional or distant disease, ranging between 62.3% and 74.7%. There was a substantial decline in the rate of RAI ablation for patients with localized disease, from 54.6% in 1999 to 29.6% in 2015 (P < 0.01). For patients with localized disease, there was a clear point of inflection in RAI ablation after 2009 (P < 0.01).
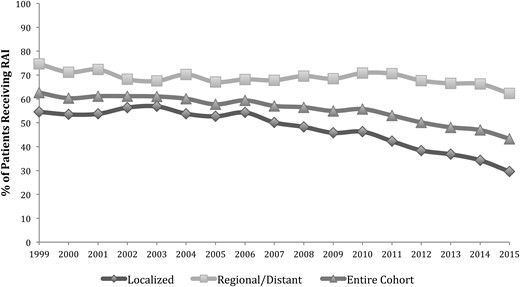
Rates of RAI ablation by year of diagnosis and disease stage. Disease stage was defined as localized (confined to the thyroid), regional (extrathyroidal extension or nodal metastasis), or distant.
Time trends of RAI ablation in patients with localized disease
Of patients with localized disease (no lymph node involvement or extrathyroidal extension), 45.3% underwent RAI ablation during the study period. Patients with localized disease who received RAI were younger (47.8 vs 50.0 years, SDi −0.15), had a larger mean tumor size (2.4 vs 1.7 cm, SDi 0.14), and were more likely to be treated in a nonacademic center (77.9% vs 71.6%, SDi 0.14) compared with patients who did not undergo RAI. There were no significant differences in patients with localized disease who received RAI ablation compared with patients who did not with respect to SES, ethnicity, or sex.
The effect of tumor size on RAI use for localized disease over time is shown in Fig. 2. The rate of RAI ablation for tumors <1 cm decreased by 70% over the study period from 38.8% in 1999 to 11.3% in 2015 (P < 0.01). The rate also decreased significantly for tumors between 1 and 2 cm (61.5% to 33.6%, P < 0.01) and tumors between 2 and 4 cm (67.4% to 48.6%, P < 0.01). Use of RAI remained relatively stable for tumors >4 cm, ranging from 51.3% to 67.0%. With the specific comparison of the rate of RAI before and after publication of the 2009 revised ATA guidelines, there was a decrease in RAI ablation in patients with tumors <1 cm (31.5% in 2009 to 11.3% in 2015, P < 0.01) and tumors between 1 and 2 cm (54.6% in 2009 to 33.6% in 2015, P < 0.01). However, the rates of RAI ablation for tumors larger than 2 cm did not change significantly following 2009. Overall, 36.6% of patients with localized tumors <1 cm received RAI from 1999 to 2009 compared with 19.3% of patients from 2010 to 2015 (P < 0.01).
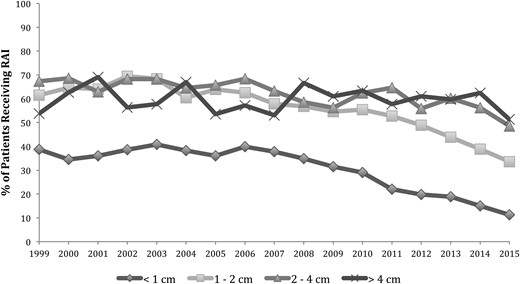
Rates of RAI ablation by tumor size in the localized disease group. Localized disease was defined as tumors confined to the thyroid with no extrathyroidal extension, lymph node, or distant metastasis.
The rate of RAI ablation decreased in both academic and nonacademic centers for patients with localized disease. RAI ablation in academic centers decreased from 47.2% in 1999 to 23.6% in 2015 (P < 0.01) and in nonacademic centers, from 56.4% in 1999 to 31.6% in 2015 (P < 0.01; Fig. 3). After 2009, academic centers had a greater decrease in the rate of RAI ablation (43.0% in 2009 to 23.6% in 2015, P < 0.01) compared with nonacademic centers (46.8% in 2009 to 31.6% in 2015, P < 0.01).
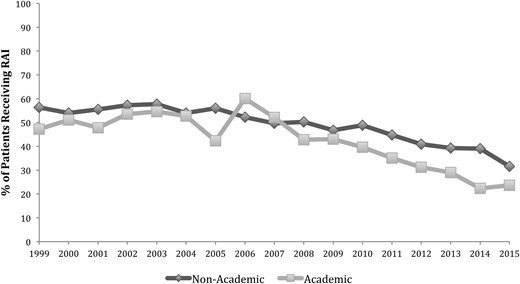
Rates of RAI ablation by hospital type in the localized disease group. Localized disease was defined as tumors confined to the thyroid with no extrathyroidal extension, lymph node, or distant metastasis.
Predictors of RAI ablation for patients with localized disease
In univariable analysis, clinical factors associated with decreased rates of RAI ablation for patients with localized disease included older age, smaller tumor size, treatment at an academic center, and papillary histology (Table 3). In multivariable analysis, tumor size <1 cm was predictive against RAI (OR 0.33, 95% CI: 0.31 to 0.35 vs tumor size 1 to 2 cm). Age >65 years was also predictive of decreased use of RAI (OR 0.77, 95% CI: 0.71 to 0.83 vs age 18 to 44 years), as was treatment in an academic hospital (OR 0.71, 95% CI: 0.67 to 0.75 vs nonacademic hospital). Year of diagnosis, papillary histology, and lowest SES were also independent predictors of decreased RAI rates (Table 3). The analysis was repeated with age as a continuous variable, and no changes in the findings were observed.
Univariable Analyses and Multivariable Regression for RAI Ablation in the Localized Disease Group
| Univariable Analysis | Multivariable Regression | |
|---|---|---|
| OR (95% CI) | OR (95% CI) | |
| Tumor size | ||
| <1 cm | 0.34 (0.32–0.36) | 0.33 (0.31–0.35) |
| 1–2 cm | 1 (Reference) | 1 (Reference) |
| 2–4 cm | 1.38 (1.29–1.47) | 1.31 (1.22–1.41) |
| >4 cm | 1.27 (1.16–1.4) | 1.26 (1.14–1.39) |
| SES | ||
| Lowest | 1 (Reference) | 1 (Reference) |
| Lower-middle | 1.16 (1.06–1.27) | 1.23 (1.12–1.36) |
| Middle | 1.20 (1.10–1.31) | 1.25 (1.14–1.38) |
| Higher-middle | 1.26 (1.16–1.37) | 1.35 (1.23–1.48) |
| Highest | 1.17 (1.08–1.27) | 1.29 (1.17–1.42) |
| Hospital | ||
| Academic | 0.72 (0.68–0.76) | 0.71 (0.67–0.75) |
| Nonacademic | 1 (Reference) | 1 (Reference) |
| Age, years | ||
| 18–44 | 1 (Reference) | 1 (Reference) |
| 45–65 | 0.87 (0.83–0.91) | 1.04 (0.98–1.1) |
| >65 | 0.67 (0.62–0.72) | 0.77 (0.71–0.83) |
| Year of treatment | 0.93 (0.93–0.94) | 0.94 (0.93–0.94) |
| Tumor histology | ||
| Papillary | 0.79 (0.76–0.83) | 0.91 (0.87–0.96) |
| Nonpapillary | 1 (Reference) | 1 (Reference) |
| Race/ethnicity | ||
| Blacka | 0.88 (0.78–0.99) | 0.89 (0.78–1.01) |
| Whitea | 1 (Reference) | 1 (Reference) |
| Hispanic | 1.06 (1–1.13) | 1.06 (0.99–1.13) |
| Asian/Pacific Islandera | 1.07 (1–1.15) | 1.04 (0.96–1.12) |
| Sex | ||
| Female | 0.87 (0.82–0.93) | 0.96 (0.89–1.02) |
| Male | 1 (Reference) | 1 (Reference) |
Non-Hispanic.
Discussion
We found a decreasing rate of RAI ablation for patients with low-risk DTC in California from 1999 to 2015. This is a departure from previous studies that have found increases in RAI ablation across all tumor sizes from 1990 to 2008 (12). The routine use of RAI ablation for low-risk DTC was explicitly discouraged in the 2009 ATA guidelines. This population-level study assesses the potential impact of the 2009 ATA guidelines on RAI use. We found that the rate of RAI decreased significantly following 2009 for patients with localized tumors <2 cm, but many patients still underwent potentially unnecessary RAI ablation for tumors >2 cm.
Before publication of the 2009 ATA guidelines, studies reported an increase in RAI ablation over time. In a study of 189,219 patients from 1990 to 2008 using the US National Cancer Database, Haymart et al. (12) reported an increase in RAI ablation across all tumor sizes. This trend was attributed to an overestimation of RAI efficacy and subsequent overtreatment. In a similar study of 37,136 patients from 1973 to 2007 using the Surveillance, Epidemiology, and End Results database, Iyer et al. (19) also reported an increase in RAI ablation across all cases of DTC. In this study, the rates of RAI ablation for low-risk thyroid cancer patients also increased consistently over time, with no changes in overall survival.
In contrast, we found a decreased rate of RAI ablation, particularly following 2009. We observed that the greatest decrease in RAI ablation occurred in localized tumors smaller than 2 cm. The decrease in the rate of RAI ablation for localized tumors between 2 and 4 cm was less pronounced. Although the ATA definition of low-risk DTC includes tumors up to 4 cm, many patients with tumors between 2 and 4 cm still received potentially unnecessary RAI ablation. The more contemporary database likely explains the main difference in our findings compared with earlier studies. There may also be differences in our study as a result of the use of a state-wide rather than national database. However, given the large size of the CCR database and heterogeneity of the population in California, it is likely that this reflects national trends. Indeed, previous studies using CCR showed no differences in RAI ablation trends compared with studies using national databases (20).
The large variability in RAI administration and guideline adherence is likely multifactorial and includes unexplained hospital characteristics (12). In keeping with prior reports (13–15), we found that patients in academic hospitals were less likely to receive RAI ablation compared with nonacademic centers, particularly after 2009. This suggests that academic centers were more likely to be early adopters of the ATA guidelines. Previous studies have shown that strong clinical evidence correlates with higher rates of clinical guideline adherence (12, 21). In other words, the lack of definitive evidence, despite expert consensus, reduces guideline adherence. The evidence base supporting a lack of benefit for RAI ablation is strongest in patients with microcarcinomas (7). Prior studies have reported a decreased risk of tumor recurrence and mortality following RAI ablation for tumors larger than 1 to 1.5 cm but no benefit for smaller tumor sizes (22, 23).
We examined additional clinical factors that influenced the rate of RAI ablation for patients with low-risk DTC. Our finding that patients >65 years were less likely to undergo RAI compared with younger patients is consistent with previous studies (12, 20, 24, 25). Physicians are more likely to pursue aggressive treatment in younger patients (20, 26). The distribution of race/ethnicity and SES categories in our study was similar between patients who underwent RAI and those who did not. However, in multivariable analysis after accounting for other clinical factors, SES but not race/ethnicity was significantly associated with RAI use. Lowest SES was an independent predictor of decreased RAI use in our study. Patients with low SES have been previously found to present with more advanced disease compared with high SES patients but are less likely to receive RAI ablation (25, 27, 28). Although lack of health care access may result in delayed or undertreatment, our study indicates that patients in higher SES groups are being overtreated for low-risk DTC.
Our study has several limitations, including those inherent to the retrospective analysis of a large database. Risk factors, such as family history and prior radiation exposure, are not included in the database. Potential coding errors in tumors characteristics, such as extrathyroidal extension, may explain the use of RAI in otherwise low-risk patients. However, our main outcome was the use of RAI over time, and coding errors would be unlikely to account for the decrease in RAI use over the study period. Another limitation is the inability to assess the dose of RAI ablation given to patients. Previous studies have suggested that there is no difference in outcomes for low-risk DTC with RAI doses between 30 and 100 mCi (29, 30). We were unable to assess trends in the dose of RAI used for low-risk patients, as this variable is also unavailable in CCR. Furthermore, the updated 2015 ATA guidelines modified the stratification criteria for low-risk DTC (8). In this update, the low-risk DTC group was expanded to include intrathyroidal DTC of any size with ≤5 lymph node micrometastases. Given this change, some patients that were not previously categorized as low risk would now be included in this category. As the rate of RAI ablation in our study was higher for patients with larger tumors or regional disease, this would increase the rate of RAI in patients now considered to be in the low-risk category. However, the retrospective application of the 2015 ATA updates would be inappropriate, as a different set of guidelines was used to guide clinical practice.
In conclusion, RAI ablation for patients with low-risk DTC has decreased following the 2009 ATA guidelines. This is mostly attributable to a substantial decrease in RAI ablation for thyroid cancers <2 cm. Academic hospitals have adopted recommended treatment guidelines earlier than nonacademic centers. Despite the 2009 ATA guidelines, many patients still receive unnecessary RAI for low-risk DTC between 2 and 4 cm.
Abbreviations:
- ATA
American Thyroid Association
- CCR
California Cancer Registry
- CI
confidence interval
- DTC
differentiated thyroid cancer
- OR
odds ratio
- RAI
radioactive iodine
- SDi
standardized differences
- SES
socioeconomic status.
Acknowledgments
Disclosure Summary: The authors have nothing to disclose.
