


Abstract
Iatrogenic hypoglycemia is the most common acute diabetic complication, and it significantly increases morbidity. In people with diabetes, reduction in the levels of circulating stem and progenitor cells predicts adverse outcomes.
To evaluate whether hypoglycemia in diabetes affects circulating stem cells and endothelial progenitor cells (EPCs).
We performed an experimental hypoglycemia study (Study 1) and a case-control study (Study 2).
Tertiary referral inpatient clinic.
Type 1 diabetic patients (Study 1, n = 19); diabetic patients hospitalized for severe iatrogenic hypoglycemia, matched inpatient and outpatient controls (Study 2, n = 22/group).
Type 1 diabetic patients underwent two in-hospital sessions of glucose monitoring during a breakfast meal with or without induction of hypoglycemia in random order. In Study 2, patients hospitalized for hypoglycemia and matched controls were compared.
Circulating stem cells and EPCs were measured by flow cytometry based on the expression of CD34 and kinase insert domain receptor (KDR).
In Study 1, the physiologic decline of CD34+KDR+ EPCs from 8 am to 2 pm was abolished by insulin-induced hypoglycemia in type 1 diabetic patients. In Study 2, diabetic patients hospitalized for severe iatrogenic hypoglycemia had significantly lower levels of CD34+ stem cells and CD34+KDR+ EPCs compared with diabetic inpatients or outpatient controls.
In diabetic patients, a single mild hypoglycemic episode can compromise the physiologic EPC fluctuation, whereas severe hypoglycemia is associated with a marked reduction in stem cells and EPCs. These data provide a possible link between hypoglycemia and adverse outcomes of diabetes.
Iatrogenic hypoglycemia is the most common acute complication in people with diabetes. Virtually all patients with type 1 diabetes are destined to suffer from at least some mild hypoglycemic episodes. Also in type 2 diabetes, despite widening of the therapeutic armamentarium, hypoglycemia remains a major concern (1, 2). There is indeed a great interest in the development of new therapeutic strategies to improve glucose control without posing the patients at a higher risk of hypoglycemia. Insulin pumps and sensor-augmented pumps are helpful to reduce time spent in hypoglycemia (3), and many modern glucose-lowering medications for type 2 diabetes are associated with a very low risk of hypoglycemia compared with insulin or sulfonylureas (4).
Especially in patients with type 2 diabetes, hypoglycemia contributes to morbidity and mortality (5, 6). The increased rate of severe hypoglycemia observed during intensive glucose-lowering therapy is believed to counterbalance the beneficial effects of glucose control on cardiovascular outcomes (7).
About a decade ago, we and others demonstrated that diabetic patients have fewer circulating stem and progenitor cells than controls, a defect that is more profound in the presence of macrovascular complications (8, 9). Circulating stem cells, identified by expression of the hematopoietic marker CD34, have proangiogenic activity (10) and are nowadays considered to contribute to homeostasis of the cardiovascular system. A small subpopulation of CD34+ cells expressing endothelial markers, such as kinase insert domain receptor (KDR) (or vascular endothelial growth factor receptor-2), represents so-called endothelial progenitor cells (EPCs) (11). Controversies still exist on whether coexpression of CD133 enriches for functional EPCs (12, 13). Although most CD34+ cells are hematopoietic and the exact ontology of EPCs is debated, it is important to note that reductions in the levels of circulating stem cells and EPCs predict cardiovascular outcomes in different population of subjects (14). Remarkably, CD34+ cells predict the future development of microangiopathy and macroangiopathy in patients with diabetes (15, 16).
Hypoglycemia can exert several detrimental effects on cardiovascular function, by inducing vasoconstriction and a proinflammatory, prothrombotic, and a proarrhythmogenic state (17). Although the negative impact of hyperglycemia on EPCs has been previously documented (8), there are almost no data on whether hypoglycemia also affects EPCs.
In this study, we evaluated the effects of experimental or iatrogenic hypoglycemia on circulating stem/progenitor cells in diabetic patients.
Materials and Methods
The protocols were approved by the Ethical Committee of the University Hospital of Padova and conducted in compliance with the Declaration of Helsinki. All patients provided written informed consent.
Study 1
Patients were recruited at the Division of Metabolic Diseases of the University Hospital of Padova. Inclusion criteria were as follows: age >18, type 1 diabetes since at least 1 year, on a stable insulin regimen since at least 6 months, a body mass index <35 kg/m2, and ability to provide informed consent. Exclusion criteria were as follows: pregnancy or lactation; steroid therapy; blood donation in the last 3 months; and any severe concomitant disease, adrenal, or pancreatic diseases. During the study, all patients were wearing a flash glucose-monitoring system (Freestyle Libre; Abbott, Rome, Italy) and underwent two in-hospital sessions (control and hypoglycemia) in random orders separated by 1 week. Randomization was achieved by means of a random sequence generator function on a common electronic spreadsheet. After admission at 8 am, a cannula was placed in a forearm vein for blood sampling and venous glucose measurement (Yellow Springs glucose analyzer). During the control session, patients received a standard breakfast and the habitual insulin dose calculated from pre-meal glycemia, the insulin:carbohydrate ratio, and the correction factor. To monitor venous glucose, blood samples were drawn at 15-minute intervals for 3 hours and at 30-minute intervals for additional 3 hours (total session duration 6 hours). During the hypoglycemia session, to induce hypoglycemia, the insulin bolus was delayed by 30 minutes with respect to breakfast and was doubled. Based on previous studies, this procedure is known to be safe and effective (18). Blood samples were drawn at 15-minute intervals from 8 am to 9 am, at 10-minute intervals until 12 am, again at 15-minute intervals until 1 pm, and then at 30-minute intervals until session end (2 pm). Hypoglycemia was defined as a glucose value <60 mg/dL on at least two measures and was then interrupted by the oral administration of 15 g glucose. Blood samples for cell analysis were drawn at 8 am and 2 pm.
Study 2
Patients were recruited at the inpatient Division of Metabolic Diseases of the University Hospital of Padova. We included all consecutive patients aged 18 to 90 years admitted for severe iatrogenic hypoglycemia from September 2013 to October 2014, provided they did not meet exclusion criteria. Severe hypoglycemia was defined as a symptomatic hypoglycemic episode, with confirmed glucose levels <70 mg/dL, for which the patient required hospitalization. Control diabetic patients had to be hospitalized for reasons other than hypoglycemia, to be matched 1:1 for sex and age (±5 years) with cases, and were recruited at the same clinic room during the same day as cases. Exclusion criteria were as follows: acute disease or infection, recent surgery or cardiovascular disease, chronic immune-inflammatory conditions, organ transplantation, pregnancy and lactation, and inability to provide informed consent. After enrollment, and within 48 hours from onset of hypoglycemia, a peripheral blood sample was drawn into heparinized tubes for flow cytometry analysis of circulating stem/progenitor cells. We initially hypothesized that hypoglycemia could stimulate progenitor cell release owing to the catecholaminergic and glucocorticoid stress. Thus, we set the 48-hour window based on the kinetic of progenitor cells after acute medical conditions like myocardial infarction (19). As the use of an inpatient control group may lead to a bias driven by the causes of hospitalization (mostly hyperglycemia), we also included a control group of outpatients without a history of severe hypoglycemia who were enrolled at the Outpatient Diabetes Clinic of the same hospital and underwent blood sampling for progenitor cell determination during the study protocol. These patients were matched 2:1 with patients hospitalized for hypoglycemia for age, sex, diabetes type and duration, hemoglobin A1c, complications, and medications.
Patient characterization
We recorded the following data from patients’ electronic chart records: age, sex, height and weight, type of diabetes and duration, history of previous severe hypoglycemic episodes, and medications. The presence of concomitant risk factors and chronic diabetic complications was defined as follows. Hypertension was defined as a systolic blood pressure ≥140 mm Hg or a diastolic blood pressure ≥90 mm Hg, or the use of antihypertensive medications. A suboptimal lipid profile was defined as a total cholesterol ≥200 mg/dL, or low-density lipoprotein cholesterol ≥100 mg/dL, or triglycerides ≥150 mg/dL. Smoking was defined as habitual active smoking of one or more cigarettes per day. Retinopathy was defined on the basis of standardized digital retinal fundus images, examined, and scored remotely by an experienced ophthalmologist, according to the Early Treatment of Diabetic Retinopathy classification (20). Somatic peripheral neuropathy was diagnosed, after exclusion of nondiabetic causes, in the presence of typical sensory or motor symptoms (numbness, tingling, or pain in the toes, feet, legs, hands, arms, and fingers, or wasting of the muscles of the feet or hands), and confirmed by clinical examination (ankle reflexes, vibratory perception threshold, pinprick, and 10-g monofilament sensitivity) and eventual determination of neural conduction velocity, in a minority of unclear cases. Autonomic neuropathy was screened annually using four routine cardiovascular autonomic function tests, as follows: deep breathing, lying-to-standing, Valsalva maneuver, and orthostatic hypotension. Nephropathy was defined as a chronic kidney disease stage III or higher based on estimated glomerular filtration rate (21). Coronary artery disease was defined as a history of myocardial infarction or angina, or evidence of >70% stenosing coronary artery disease at coronary angiography. Peripheral arterial disease was defined as a history of claudication or rest pain, or hemodynamically relevant stenosis in leg arteries. Asymptomatic atherosclerosis was defined as the presence of carotid artery plaques (stenosis >15%) at routine ultrasound examination. Macroangiopathy was defined as the presence of coronary artery disease, peripheral arterial disease, or asymptomatic atherosclerosis.
Flow cytometry
The analysis of circulating stem/progenitor cells was performed as previously described in detail (16). Briefly, cells were stained with anti-CD34 (BD Biosciences, San Jose, CA) and KDR (R&D Systems, Minneapolis, MN) monoclonal antibodies. After gating CD34+ cells in the mononuclear cell population, cells were examined for the dual expression of KDR. One million events were acquired, and cell count was always expressed per 106 events. Baseline progenitor cell levels were quantified by the same two trained operators using the same method and materials throughout the study, although lots of antibodies for KDR have changed. The absolute number of cells per microliter of blood was calculated by multiplying cell counts/106 events by the white blood cell count × 103/μL using a two-platform approach (22). Based on test–retest evaluation of reproducibility, the coefficients of variation of CD34+ cells and CD34+KDR+ EPCs were 6.1% and 11.9%, respectively.
Statistical analysis
Continuous data are presented as mean ± standard error. Normality was checked using the Shapiro–Wilk test, and nonnormal variables were log transformed before analysis. Categorical data are presented as percentage. For Study 1, we compared data obtained at 8:00 am with those obtained at 14:00 am using the paired Student t test. We also calculated the mean change from baseline in each arm; as this variable had a skewed distribution, it was log transformed and analyzed using the paired Student t test. For study 2, comparison of continuous variables between two groups was performed using unpaired Student t test, whereas categorical data were compared using the χ2 test. To account for potential confounders in the comparison of cell levels between the groups, we performed a multivariable analysis in which we entered all variables that differed significantly between the two groups at the univariate analysis. All tests were two tailed, and statistical significance was accepted at P < 0.05. When multiple comparisons were performed, the Bonferroni correction was applied to account for inflation of type 1 error. SPSS version 23 or higher was used.
Results
Experimental hypoglycemia influences physiological progenitor cell fluctuations
Clinical characteristics of the 19 patients with type 1 diabetes enrolled in Study 1 are shown in Table 1. Induction of hyperglycemia was successful in all patients, although at different time points, and nadir plasma glucose was significantly lower during the hypoglycemia than during the control session (60.2 ± 1.3 vs 104.4 ± 4.5 mg/dL; P < 0.0001; Fig. 1a–1c).
Clinical Characteristics of Type 1 Diabetic Patients Enrolled in Study 1
| Variable | Value |
|---|---|
| Number | 19 |
| Age, y | 35.5 ± 3.0 |
| Sex male, n (%) | 8 (42.1) |
| Body mass index, kg/m2 | 23.2 ± 0.7 |
| Diabetes duration, y | 18.6 ± 2.7 |
| HbA1c, % (mmol/mol) | 7.5 ± 0.2 (58.2 ± 1.8) |
| MDI/CSII, n | 12/7 |
| Total daily insulin dose, IU | 33.5 ± 1.9 |
| Retinopathy, n (%) | 3 (15.8) |
| Neuropathy, n (%) | 2 (10.5) |
| Nephropathy, n (%) | 0 (0.0) |
| Macroangiopathy, n (%) | 1 (5.3) |
Abbreviations: CSII, continuous subcutaneous insulin infusion; HbA1c, hemoglobin A1c; MDI, multidose insulin.

Change in relative stem and progenitor cell levels during Study 1. For the control (a) and hypoglycemia session (b), average plasma glucose levels (black line) and standard deviation are reported along with each patient’s glucose profile (gray lines). Nadir plasma glucose is compared between the two sessions (c). CD34+ stem cells (d–f) and CD34+KDR+ EPCs (g–k) were quantified at baseline (8 am; a and d) after breakfast (2 pm; d and e) with or without induction of hypoglycemia, and here reported as cells/106 events. The change from baseline is also compared for the two sessions (f and k). Graphs in d and e and in g and h show the box and whisker plots (media, interquartile range, minimum and maximum), together with variation in each individual patient. *P < 0.05 upon paired t test.
During the control session in the absence of hypoglycemia, the levels of CD34+ stem cells and those of CD34+KDR+ EPCs declined significantly from 8 am to 2 pm (by ∼20% and 40%, respectively; Table 2; Fig. 1d and 1g), according to a circadian fluctuation. During the experimental hypoglycemia session, CD34+ stem cells declined significantly, but CD34+KDR+ EPCs remained stable. The change in EPC levels was significantly lower after hypoglycemia than during the control session (P = 0.012; Table 1; Fig. 1e and 1h). No significant carryover effect was noted for CD34+ or CD34+KDR+ cell counts.
Levels of Stem/Progenitor Cells in Study 1
| Control Session | Hypoglycemia Session | |||||
|---|---|---|---|---|---|---|
| 8 am | 2 pm | Change | 8 am | 2 pm | Change | |
| White blood cells, 103/mL | 5.3 ± 0.2 | 4.9 ± 0.2 | −0.4 ± 0.3 | 5.2 ± 0.2 | 5.2 ± 0.2 | 0.01 ± 0.2 |
| CD34+/106 (/mL) | 385.2 ± 38.5 (2087 ± 236) | 314.6 ± 34.0a (1572 ± 184) | −70.6 ± 20.6 (−515 ± 169) | 370.8 ± 53.2 (1968 ± 287) | 276.1 ± 25.6a (1473 ± 152) | −94.7 ± 39.2 (−494 ± 208) |
| CD34+KDR+/106 (/mL) | 20.8 ± 2.9 (110 ± 15) | 12.5 ± 1.6a (61 ± 8) | −8.3 ± 2.1 (−48 ± 11) | 13.8 ± 1.7 (71 ± 9) | 13.6 ± 1.8 (73 ± 11) | −0.3 ± 2.2b (2 ± 11) |
Levels of CD34+ stem cells and CD34+KDR+ EPCs were determined at 8 am and 2 pm during both sessions.
P < 0.05 in paired t test.
P < 0.05 vs control session.
The total white blood cell count did not change significantly in either the control or hypoglycemia session (Table 2), and the observed changes in stem/progenitor cells were highly consistent when expressed per one million events or per milliliter of blood (Supplemental Fig. 1).
Severe hypoglycemia is associated with a reduction in stem and progenitor cells
We included 22 patients admitted for severe iatrogenic hypoglycemia, 22 age- and sex-matched diabetic patients admitted for other reasons, and 44 fully-matched diabetic outpatients (Table 3). Mean age was ∼70, and half were females. The average admission plasma glucose was 36.6 ± 2.9 mg/dL in hypoglycemia patients vs 263.0 ± 18.3 mg/dL in control inpatients (P < 0.0001).
Clinical Characteristics of Patients Enrolled in Study 2
| Variable | Hypoglycemia | Inpatient Controls | Outpatient Controls |
|---|---|---|---|
| Number | 22 | 22 | 44 |
| Age, y | 71.3 ± 2.6 | 70.1 ± 2.8 | 70.9 ± 0.5 |
| Sex male, n (%) | 11 (50.0) | 11 (50.0) | 22 (50.0) |
| Body mass index, kg/m2 | 29.0 ± 1.8 | 33.9 ± 2.3 | 29.7 ± 1.5 |
| Type 1/type 2 diabetes, n | 1/21 | 1/21 | 2/42 |
| Diabetes duration, y | 12.1 ± 2.0 | 9.8 ± 2.6 | 12.8 ± 0.5 |
| HbA1c, % (mmol/mol) | 6.8 ± 0.4 | 9.3 ± 0.5a | 7.10.3 |
| Risk factors | |||
| Hypertension, % | 15 (68.2) | 21 (95.5)a | 34 (77.2) |
| Smoking habit, % | 1 (4.5) | 4 (18.2) | 5 (11.4) |
| Total cholesterol, mg/dL | 140.8 ± 8.7 | 153.2 ± 9.7 | 144.1 ± 5.8 |
| HDL cholesterol, mg/dL | 51.5 ± 4.0 | 39.0 ± 3.4a | 51.2 ± 2.2 |
| LDL cholesterol, mg/dL | 73.0 ± 6.3 | 85.0 ± 8.4 | 82.9 ± 6.9 |
| Triglycerides, mg/dL | 81.7 ± 10.1 | 146.0 ± 24.6a | 119.8 ± 12.6 |
| eGFR, ml/min/1.73 m2 | 78.7 ± 10.2 | 57.7 ± 6.1 | 73.1 ± 3.3 |
| Complications | |||
| Previous hypoglycemia, episodes/patient | 0.7 ± 0.2 | 0.0 ± 0.0a | 0.0 ± 0.0a |
| Retinopathy, n (%) | 13 (59.1) | 8 (36.4) | 24 (54.5) |
| Neuropathy, n (%) | 6 (27.3) | 7 (31.8) | 7 (15.9) |
| Nephropathy, n (%) | 8 (36.4) | 9 (40.9) | 14 (31.8) |
| Coronary artery disease, n (%) | 4 (18.2) | 10 (45.5) | 9 (20.5) |
| Peripheral arterial disease, n (%) | 3 (13.6) | 9 (40.9) | 11 (25.0) |
| Cerebrovascular disease, n (%) | 10 (45.5) | 13 (59.9) | 25 (59.0) |
| Medications | |||
| Metformin, n (%) | 11 (50.0) | 2 (9.1)a | 23 (52.3) |
| Sulfonylurea, n (%) | 8 (36.4) | 0 (0.0)a | 19 (43.2) |
| Glinides, n (%) | 3 (13.6) | 0 (0.0) | 4 (9.0) |
| Insulin, n (%) | 13 (59.1) | 16 (72.7) | 29 (65.9) |
| ACE inhibitors/ARBs, n (%) | 8 (36.4) | 13 (59.1) | 22 (50.0) |
| Beta blockers, n (%) | 4 (18.2) | 9 (40.9) | 12 (27.3) |
| Other antihypertensive, n (%) | 12 (54.5) | 18 (81.8) | 28 (63.6) |
| Antiplatelet, n (%) | 9 (40.9) | 13 (59.1) | 21 (47.7) |
| Statin, n (%) | 9 (40.9) | 13 (59.1) | 26 (59.0) |
Patients hospitalized for severe hypoglycemia were compared with two groups of controls (inpatients and outpatients).
Abbreviations: ACE, angiotensin-converting enzyme; ARBs, angiotension receptor blockers; eGFR, estimated glomerular filtration rate; HbA1c, hemoglobin A1c; HDL, high-density lipoprotein; LDL, low-density lipoprotein.
P < 0.05 vs the hypoglycemia group (t test for continuous variables or χ2 test for categorical variables).
The levels of circulating CD34+ stem cells in aged diabetic patients were significantly lower than in young type 1 diabetic patients from Study 1 (263 ± 21/106 vs 377 ± 33/106; P = 0.003), whereas EPC levels were similar (19.3 ± 1.9/106 vs 17.1 ± 1.7/106; P = 0.415).
In patients hospitalized for severe hypoglycemia, most of whom had type 2 diabetes, we found a significant reduction in the levels of CD34+ stem cells and CD34+KDR+ EPCs (by ∼33% and 35%) with respect to age- and sex-matched diabetic patients hospitalized for other reasons (Fig. 2). CD34+ and EPCs levels in patients hospitalized for severe hypoglycemia were also significantly lower than in matched outpatient controls, by ∼40% and by 55%, respectively. Results were similar when cell counts were expressed per unit of blood volume (Supplemental Fig. 2).
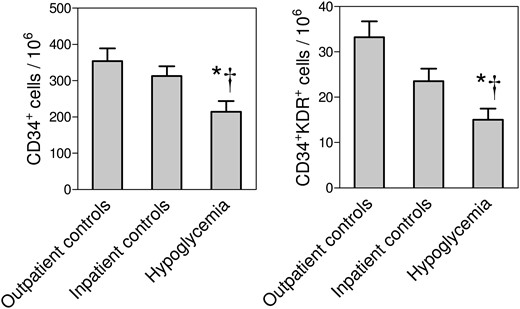
Relative circulating stem and progenitor cell levels in Study 2. The levels of CD34+ stem cells and CD34+KDR+ EPCs, expressed as cells/106 events, were compared in patients hospitalized for severe hypoglycemia vs patients hospitalized for other reasons (*P < 0.05) and vs outpatient matched controls (†P < 0.05).
Because the two inpatient groups differed significantly for hemoglobin A1c, past history of severe hypoglycemia, history of hypertension, lipid profile, and some glucose-lowering medications (Supplemental Table 1), we performed a multivariable analysis: hypoglycemia remained significantly associated with lower CD34+ stem cells (−61.4 ± 25.7%; P = 0.022), but not CD34+KDR+ EPCs, independently of such confounders. Outpatient controls were matched with hypoglycemia cases for all clinical variables except the history of severe hypoglycemia, and, therefore, no adjustment was performed.
Discussion
In two different substudies, we show that hypoglycemia has the potential to interfere with circulating stem and progenitor cells in patients with diabetes.
The levels of stem/progenitor cells in peripheral blood follow circadian fluctuations dictated by signals from the sympathetic nervous systems (23). In mice, which are nocturnal animals, a peak is observed during light phases and a nadir during darkness (23). In humans, who are diurnal animals, this rhythm is expected to be inverted (24), with stem cell release during night (and a predictable peak early in the morning) and a nadir during the day. Previous studies in healthy humans showed that CD34+ stem cells and other progenitor cells follow circadian rhythms, but peak time remains controversial (25, 26). Our data obtained in type 1 diabetic patients indicate that hypoglycemia disrupted the normal fluctuation of circulating EPCs observed during the control session. Of note, this finding comes from a crossover study wherein all participants underwent a control session without hypoglycemia and a hypoglycemia session in random order, thereby minimizing confounding. A lack of EPC decline from 8 am to 2 pm may be interpreted as a relative EPC stimulation by mild hypoglycemia. However, as similar trends were not observed for the total white blood cell count and the CD34+ population, the effect seems unlikely attributable to adrenergic stimulation, but may represent an effect on the circadian clock. Intriguingly, in an animal model of diabetes, loss of physiologic progenitor cell fluctuations was associated with autonomic neuropathy and preceded the onset of retinopathy (27). Whether diabetic patients display an inversion in circadian EPC regulation compared with healthy individuals remains to be investigated. Biological circadian rhythms are extremely important in maintaining organismal health status (28), whereas disrupting the internal clock is sufficient to induce metabolic disease in animal models (29). Clinically, it is well known that hypoglycemia, even nonsevere, results in alterations of sleep and daytime functioning (30). We argue that the effects of hypoglycemia on the internal clock may be underappreciated and involve EPCs.
In the second substudy, we evaluated the advanced consequences of severe hypoglycemia. On note, most of these patients had type 2 diabetes and a history of previous hypoglycemic episodes. When compared with diabetic patients hospitalized for other reasons or with fully-matched outpatient controls, those with hypoglycemia displayed a marked depletion of CD34+ stem cells and EPCs. This finding suggests that, at least in diabetes, hypoglycemia-induced adrenergic activation does not mobilize stem or progenitor cells, as it would be anticipated from studies in animals (31). This may be related to the negative effect of diabetes on stem cell mobilization from the bone marrow to peripheral blood (32), at least in part because of impaired autonomic signals (33). In addition, previous hypoglycemic episodes could have blunted the adrenergic response in these patients (34). It is also possible that repeated episodes of hypoglycemia resulted in an exhaustion of stem and progenitor cell pool. Previously, we found that, during intensified insulin therapy, hypoglycemia prevented the beneficial effects of glucose control on the increase in EPC levels (35). The mechanisms whereby hypoglycemia would affect EPCs are presently unclear. In diabetes, glucose variability was found to associate with reduced EPC levels (36) and epigenetic changes in circulating monocytes, leading to persistent endothelial dysfunction and oxidative stress (37). As the circadian clock is epigenetically regulated (38), we speculate that hypoglycemia can affect EPC fluctuations by epigenetic reprogramming.
Low levels of CD34+ stem cells have been consistently shown to predict the onset or worsening of microangiopathy and macroangiopathy in type 2 diabetes (15, 16). In this perspective, we offer a mechanistic explanation for the association between a history of severe hypoglycemia and poor clinical outcomes in type 2 diabetes (6, 7). Based on our previous longitudinal study, it can be calculated that the degree of CD34+ cell reduction associated with severe hypoglycemia would result in an increased risk of cardiovascular events of ∼1.79 times (15).
This study has some limitations. First, Substudy 1 was not designed to evaluate circadian oscillations in cell levels, which would require sampling at additional time points. Although we provide a partial view on how hypoglycemia affects EPC rhythms, studies in mouse models typically set two Zeitgeber times (ZTs) 6 to 8 hours apart (e.g., ZT5 and ZT13) (39). In Substudy 2, sample size was relatively small and some differences between the two inpatient groups may confound results despite multivariable adjustment, resulting in a loss of statistical significance for the association between hypoglycemia and reduced EPCs. To address this point, we included a larger control group of outpatients, which confirmed the findings of reduced CD34+ cells and EPCs. Although the comparison between outpatients and inpatients may be intrinsically biased, it provides a validation of the findings obtained comparing inpatient groups. An additional limitation was that we did not evaluate cell function in vitro, which may be relevant to fully understand the effect of hypoglycemia on stem/progenitor cells. Finally, the two study protocols and results were not entirely consistent. Young type 1 diabetic patients were involved in experimental hypoglycemia, whereas most patients admitted for severe hypoglycemia were old and had type 2 diabetes. Additionally, the CD34+ cell level was markedly different in type 1 vs type diabetes, and only EPCs were affected by a single hypoglycemic episode, whereas severe hypoglycemia was associated with both CD34+ and EPC impairments. Furthermore, EPCs tended to be relatively stimulated by a brief experimental hypoglycemia in young individuals with type 1 diabetes, whereas they were markedly reduced in older type 2 diabetic patients with severe hypoglycemia. The different EPC response to hypoglycemia may be attributed to age or diabetes type. It should be noted that severe hypoglycemia is a devastating acute condition often presenting with coma or persistently low life-threatening glucose levels. It is therefore not surprising that the degree of stem/progenitor cell alterations observed in this condition is more profound than after a brief episode of mild and controlled hypoglycemia. However, the observation of a relative stimulation of EPCs by mild hypo in young patients and a marked depletion of EPCs in aged patients with severe hypo are consistent with the hypothesis that repeated hypoglycemia can progressively deplete the EPC pool. In fact, it is well recognized that severe hypoglycemia is almost invariably preceded by many episodes of mild hypoglycemia (40), which could over the time exhaust EPCs.
In conclusion, our data shed further light on the detrimental effects of hypoglycemia on stem and progenitor cells, by showing that a single episode of hypoglycemia can impair their physiologic circadian rhythm, whereas severe hypoglycemias can induce a reduction in stem and progenitor cells, which may translate in a higher risk of adverse outcomes.
Abbreviations:
Acknowledgments
Clinical Trial Information: ClinicalTrials.gov no. NCT02734745 (registered 12 April 2016).
Disclosure Summary: The authors have nothing to disclose.
