


Abstract
Insulin resistance (IR) is promoted by a chronic low-grade inflammation in white adipose tissue (WAT). The latter might be regulated through epigenetic mechanisms such as DNA methylation. The one carbon cycle (1CC) is a central metabolic process governing DNA methylation.
To identify adipocyte-expressed 1CC genes linked to WAT inflammation, IR, and their causal role.
Cohort study.
Outpatient academic clinic.
Obese and nonobese subjects.
Gene expression and DNA methylation arrays were performed in subcutaneous WAT and isolated adipocytes. In in vitro differentiated human adipocytes, gene knockdown was achieved by small interfering RNA, and analyses included microarray, quantitative polymerase chain reaction, DNA methylation by enzyme-linked immunosorbent assay and pyrosequencing, protein secretion by enzyme-linked immunosorbent assay, targeted metabolomics, and luciferase reporter and thermal shift assays.
Effects on adipocyte inflammation.
In adipocytes from obese individuals, global DNA hypermethylation was associated positively with gene expression of proinflammatory pathways. Among the 1CC genes, IR in vivo and proinflammatory gene expression in WAT were most strongly and inversely associated with SLC19A1, a gene encoding a membrane folate carrier. SLC19A1 knockdown in human adipocytes perturbed intracellular 1CC metabolism, induced global DNA hypermethylation, and increased expression of proinflammatory genes. Several CpG loci linked SLC19A1 to inflammation; validation studies were focused on the chemokine C-C motif chemokine ligand 2 (CCL2) in which methylation in the promoter (cg12698626) regulated CCL2 expression and CCL2 secretion through altered transcriptional activity.
Reduced SLC19A1 expression in human adipocytes induces DNA hypermethylation, resulting in increased expression of specific proinflammatory genes, including CCL2. This constitutes an epigenetic mechanism that might link dysfunctional adipocytes to WAT inflammation and IR.
Insulin resistance (IR) is characterized by disturbances in several organs and is a key factor in the development of type 2 diabetes mellitus (T2DM) (1). An important contributor to IR is the chronic low-grade inflammation present in white adipose tissue (WAT) associated with obesity (2). Thus, both IR and T2DM correlate with increased secretion of proinflammatory/chemoattractant adipokines, leading to infiltration of leukocytes, primarily macrophages. Although a number of factors have been implicated, the mechanisms leading to a proinflammatory response in adipocytes have remained elusive.
An increasing body of evidence has suggested that epigenetic mechanisms are involved in promoting metabolic disease (3). A central epigenetic process is DNA methylation, and recent studies in insulin-resistant obese and/or T2DM subjects have demonstrated small, but statistically significant, alterations in methylation near metabolically relevant genes in both WAT (4–6) and isolated adipocytes (7). Although DNA methylation has classically been considered to confer gene repression, it has also been shown to activate gene transcription (8). The direction of the association between DNA methylation and gene expression might depend on several factors, including the location of the CpG in relation to the gene (8).
DNA methylation occurs when DNA methyltransferases (DNMTs) transfer methyl moieties from the methyl donor S-adenosyl methionine (SAM) to a cytosine nucleotide. SAM levels are regulated via the methionine cycle, which is fueled by various nutrients, in particular, folate (vitamin B9) through the folate cycle. The latter, therefore, plays a central role in regulating intracellular SAM levels (9). The folate and methionine cycles together are referred to as the one carbon cycle (1CC).
With our recent finding that adipocyte DNA from obese subjects is hypermethylated compared with nonobese individuals (7), we hypothesized that WAT inflammation could be influenced by epigenetic mechanisms resulting from perturbed 1CC gene expression in adipocytes.
Materials and Methods
Patient cohorts and samples
The characteristics of cohorts 1 to 3 (all women) are detailed in Supplemental Table 1. Samples were obtained from subcutaneous abdominal WAT. Cohort 1 (n = 30), including the subgroup (n = 16) in which adipocyte DNA methylation was available, has been described previously (7). Cohort 2 (n = 56) was described in the study by Arner et al. (10). Cohort 3 (n = 31) was used for messenger RNA (mRNA) expression analyses in Fig. 1G. For paired analyses of adipocytes and stroma vascular fraction, isolated as described by van Harmelen et al. (11) (Fig. 1F), WAT was obtained from 11 women, aged 38 ± 10 years (range, 20 to 50 years), with a body mass index (BMI) of 25.8 ± 3.0 kg/m2 (range, 20.5 to 29.4 kg/m2), who were undergoing plastic surgery for nonmalignant diseases. No additional clinical information was available regarding these subjects. The regional ethics board approved the present study, which was performed in accordance with the statutes in the Declaration of Helsinki. All the participants provided informed written consent.
![Analyses of 1CC genes in human WAT and the expression of SLC19A1. (A) A schematic overview of the 1CC highlighting the folate and methionine cycle, respectively (9). Protein names are indicated alongside the arrows, the metabolites are provided in italics, and SLC19A1 is highlighted in bold. Note that SLC19A1 (also called reduced folate carrier-1) is the main transporter for the uptake of the most abundant form of folate in the circulation [5-methyltetrahydrofolate (5-CH3-THF)], which constitutes a central substrate in the intersection between the folate and methionine cycles. Genes whose expression is lower or higher in obesity are marked with downward and upward arrows, respectively. (B) Genes in the 1CC were extracted from gene expression arrays in cohort 1, comparing nonobese insulin sensitive and obese IR individuals, and were subdivided according to their involvement in the folate (n = 25) or methionine (n = 50) cycle, respectively. The number of genes with greater (black), lower (gray), or not different (white) expression in obese vs nonobese subjects is indicated in the pie charts. (C) The mean gene expression of the obesity-regulated genes in the folate, methionine cycles, and SLC19A1 was measured during in vitro differentiation of human adipose-derived stem cells, as indicated. Expression of individual genes is reported in Supplemental Table 5. (D) SLC19A1 mRNA levels (by gene microarray signal) in cohort 1 (Upper). Protein lysates were available from a subset (n = 8) of cohort 1, and SLC19A1 levels were determined by Western blot (30 µg total protein loaded) and quantified using chemiluminescence (Lower). (E) SLC19A1 array signal in obese subjects of cohort 1 subdivided into low (insulin sensitive) or high (IR) homeostatic model assessment IR (HOMAIR). (F) SLC19A1 expression was measured by quantitative polymerase chain reaction in the stroma vascular fraction (SVF) and isolated mature adipocytes in paired samples from 11 individuals. (G) The attenuated WAT expression of SLC19A1 in obese subjects was confirmed in isolated adipocytes in cohort 3. mRNA levels are expressed in relative units to the reference gene LRP10. *P < 0.05, **P < 0.01, ***P < 0.001. ALDH1L1, aldehyde dehydrogenase 1 family member L1; AHCY, adenosylhomocysteinase; MAT2, methionine adenosyltransferase 2; MTHFD1, methylenetetrahydrofolate dehydrogenase, cyclohydrolase and formyltetrahydrofolate synthetase 1; MTHFR, methylenetetrahydrofolate reductase; MTR, 5-methyltetrahydrofolate-homocysteine methyltransferase; MTRR, 5-methyltetrahydrofolate-homocysteine methyltransferase reductase; SHMT1, serine hydroxymethyltransferase 1.](https://oup.silverchair-cdn.com/oup/backfile/Content_public/Journal/jcem/103/2/10.1210_jc.2017-01382/1/m_jc.2017-01382f1.jpeg?Expires=1747983315&Signature=aNzGTcp34alGaDAnQzLZCOIopRsk0a10LwtawVonXihUBBUf6gYcsoJYEP4VX5IxhpxXLrG2gfmu2-l~OH-kk7fI8LpezI964Q8ctfkxSpSj0oSyE50Er6sfzsDfYAZZIQRp01Prn1ETw750le3ktli60S8VakBKBauHdL1KEcV7gWsxQ2UXdBROaeWZn5jAUsj1-6fS8elkH0X0-BXtTNL8kh5nEqlY~eJVpN0WI7EtMitK231XgowNVPJ3Jwgb8MREshOfJPwwArrmcrvugm0nPoS7ljZtoYAuUpfpeY5XkG7508W~7zKum6AZmHseaCU-xLz16-0laLLj5ErMwA__&Key-Pair-Id=APKAIE5G5CRDK6RD3PGA)
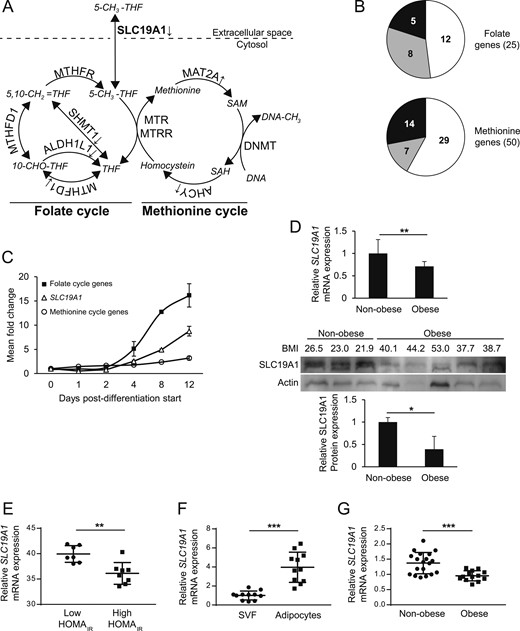
Analyses of 1CC genes in human WAT and the expression of SLC19A1. (A) A schematic overview of the 1CC highlighting the folate and methionine cycle, respectively (9). Protein names are indicated alongside the arrows, the metabolites are provided in italics, and SLC19A1 is highlighted in bold. Note that SLC19A1 (also called reduced folate carrier-1) is the main transporter for the uptake of the most abundant form of folate in the circulation [5-methyltetrahydrofolate (5-CH3-THF)], which constitutes a central substrate in the intersection between the folate and methionine cycles. Genes whose expression is lower or higher in obesity are marked with downward and upward arrows, respectively. (B) Genes in the 1CC were extracted from gene expression arrays in cohort 1, comparing nonobese insulin sensitive and obese IR individuals, and were subdivided according to their involvement in the folate (n = 25) or methionine (n = 50) cycle, respectively. The number of genes with greater (black), lower (gray), or not different (white) expression in obese vs nonobese subjects is indicated in the pie charts. (C) The mean gene expression of the obesity-regulated genes in the folate, methionine cycles, and SLC19A1 was measured during in vitro differentiation of human adipose-derived stem cells, as indicated. Expression of individual genes is reported in Supplemental Table 5. (D) SLC19A1 mRNA levels (by gene microarray signal) in cohort 1 (Upper). Protein lysates were available from a subset (n = 8) of cohort 1, and SLC19A1 levels were determined by Western blot (30 µg total protein loaded) and quantified using chemiluminescence (Lower). (E) SLC19A1 array signal in obese subjects of cohort 1 subdivided into low (insulin sensitive) or high (IR) homeostatic model assessment IR (HOMAIR). (F) SLC19A1 expression was measured by quantitative polymerase chain reaction in the stroma vascular fraction (SVF) and isolated mature adipocytes in paired samples from 11 individuals. (G) The attenuated WAT expression of SLC19A1 in obese subjects was confirmed in isolated adipocytes in cohort 3. mRNA levels are expressed in relative units to the reference gene LRP10. *P < 0.05, **P < 0.01, ***P < 0.001. ALDH1L1, aldehyde dehydrogenase 1 family member L1; AHCY, adenosylhomocysteinase; MAT2, methionine adenosyltransferase 2; MTHFD1, methylenetetrahydrofolate dehydrogenase, cyclohydrolase and formyltetrahydrofolate synthetase 1; MTHFR, methylenetetrahydrofolate reductase; MTR, 5-methyltetrahydrofolate-homocysteine methyltransferase; MTRR, 5-methyltetrahydrofolate-homocysteine methyltransferase reductase; SHMT1, serine hydroxymethyltransferase 1.
Cell cultures and RNA interference
Primary cultures of human in vitro differentiated adipocytes were set up as described by van Harmelen et al. (11) and further detailed in the Supplemental Methods. The cells were obtained from 10 female donors, aged 42 ± 10 years (range, 29 to 58 years), with a BMI of 25.8 ± 2.3 kg/m2 (range, 22.0 to 30.4 kg/m2). RNA interference-silenced cells were transfected using HiperFect (Qiagen, Hilden, Germany) and either SLC19A1 small interfering RNA (siRNA) (L-007422-01-0005) or nontargeting siRNA (D-001206-13-05) from Dharmacon (Little Chalfont, UK). Luciferase reporter assays were performed in in vitro differentiated adipocytes obtained from adipose-derived stem cells expanded in vitro and differentiated into adipocytes, as described previously (12).
RNA isolation, complementary DNA synthesis, and quantitative polymerase chain reaction
RNA was extracted using RNeasy Lipid Tissue Mini Kit/miRNeasy mini kit (Qiagen) or NucleoSpin RNA II kit (Macherey-Nagel, Düren, Germany). RNA concentrations and quality were measured using a Nanodrop 2000 spectrophotometer (Thermo Fisher Scientific, Lafayette, LA) and Agilent 2100 Bioanalyzer (Agilent Technologies, Palo Alto, CA), respectively. We synthesized 50 ng of complementary DNA (cDNA) using the iScript cDNA synthesis kit (Bio-Rad Laboratories, Hercules, CA). Assessment of gene expression was performed using TaqMan assays, and relative levels were calculated using a comparative Ct-method (2ΔCt-target gene/2ΔCt-reference gene). Probes were purchased from Applied Biosystems (Foster City, CA; Supplemental Table 2). The cDNA was diluted to 1 ng/µL, and 2.5 ng was used for each reaction mixed with 2× TaqMan Universal PCR Master Mix (Applied Biosystems) in a final volume of 10 µL. Measurements were performed in a Thermal cycler CFX96 (Bio-Rad Laboratories).
Protein and metabolite analyses
Total protein lysates were separated using sodium dodecyl sulfate-polyacrylamide gel electrophoresis and transferred onto polyvinylidene difluoride membranes (GE Healthcare, Little Chalfont, UK). Anti-SLC19A1 (catalog no. HPA024802; Atlas Antibodies, Stockholm, Sweden) was diluted 1:500 in blocking solution (GE Healthcare). Secondary rabbit IgG antibodies were conjugated to horseradish peroxidase (Sigma-Aldrich, St. Louis, MO). SLC19A1 levels were normalized against actin (catalog no. A2066, Sigma-Aldrich). Bands were detected by chemiluminescence using the ECL Select Western Blotting Detection Kit (GE Healthcare) in a Chemidoc XRS system (Bio-Rad Laboratories), and quantified using Quantity One software (Bio-Rad Laboratories). Enzyme-linked immunosorbent assays (ELISAs) (Supplemental Table 2) were performed according to manufacturer’s instructions. The metabolite analyses are described in the Supplemental Methods.
Transcriptome and epigenome arrays
Gene expression in siRNA-transfected cells was assessed using GeneChip® Human Transcriptome Array 2.0 (Affymetrix, Santa Clara, CA). Data were analyzed using packages from Bioconductor (http://www.bioconductor.org). Normalization and calculation of gene expression were performed using the robust multichip average expression measure and the oligo package (13). A nonspecific filter was applied to include only genes with expression signal >30 in ≥50% of all samples. The limma package (Bioconductor) (14) was used to identify differentially expressed genes (false discovery rate–adjusted P < 0.25) between small interfering SLC19A1 (siSLC19A1) and control transfected cells. The global WAT transcriptome and adipocyte epigenome of cohorts 1 and 2 have been previously described (7, 10).
DNA isolation, bisulfite conversion, and pyrosequencing
For pyrosequencing, RNA/DNA was isolated from cultured adipocytes using the AllPrep DNA/RNA/micro-RNA Universal Kit (Qiagen). Global DNA methylation was determined using an ELISA (Supplemental Table 2). The bisulfite conversion was performed using the EZ DNA Methylation-Gold™ Kit (Zymo Research, Irvine, CA). We used 200 ng of input DNA in a final volume of 20 µL. The software PyroMark Assay Design 2.0 (Qiagen) was used for primer design (Supplemental Table 2). The dispensing order was TAYGTTTTTT TTTAGTAGTA TGTTAGAG, with Y representing the cg12698626 position. One microliter bisulfite-converted DNA was amplified using the PyroMark PCR kit (Qiagen). An annealing temperature of 58°C was used. The size of the polymerase chain reaction (PCR) product was controlled by gel electrophoresis. Thereafter, 4 µM sequencing primer and Sepharose beads (GE Healthcare) was mixed with the PCR product and pyrosequenced with the PSQ 96 ID system (Qiagen) using PyroMark Gold Q96 reagents (Qiagen).
Gene ontology analysis
Gene ontology (GO) analyses were performed on genes (1) with CpG loci in the vicinity (<1.5 kb upstream to transcription start sites, in gene bodies, in 5′ untranslated region or 3′ untranslated region) of protein-encoding genes; (2) hypermethylated in obesity; and (3) in which the degree of methylation correlated with gene expression. Genes that correlated positively or negatively with associated CpG methylation were analyzed separately in the ToppGene database (available at: https://toppgene.cchmc.org/) to define their role in different biological processes.
C-C motif chemokine ligand 2 promoter assays
Constructs containing the upstream region of the C-C motif chemokine ligand 2 (CCL2) promoter with and without cg12698626 were prepared by PCR using KAPA HotStart ReadyMix (Kapa Biosystems, Wilmington, MA) from human genomic DNA using primers (Supplemental Table 2). Each DNA sequence was subcloned into pCpGL-basic vector (kindly provided by Professor M. Rehli, Regensburg, Germany) via BglII and NcoI restriction sites, resulting in pCpGL-CCL2+cg12698626 and pCpGL-CCL2-cg12698626 vectors. The correct insertion of each DNA fragment was controlled by sequencing. For transfection into cell cultures, plasmids were isolated and purified using EndoFree Plasmid Maxi Kit (Qiagen). Methylation was performed using SssI methyltransferase (New England Biolabs, Hitchin, UK). Constructs were electroporated into adipose-derived stem cells at day 8 of differentiation using a Neon electroporator (Invitrogen, Carlsbad, CA) with 100,000 cells in 10 µL, together with 500 ng of plasmid (1400 V, 20 ms width, and 2 pulses). Cells were cultured with or without 100 nM cortisol for 24 hours. Luciferase activity was measured in cell lysates using a Dual-Luciferase Reporter Assay System (Promega, Madison, WI) and was normalized to the protein concentrations of each sample assessed using a BCA protein assay (Thermo Fisher, Waltham, MA).
Statistical analysis
Differences were assessed using the Student t test. Correlations are presented with the Pearson product-moment correlation coefficient or rho value using the Spearman rank correlation. P < 0.05 was considered statistically significant. Associations between SLC19A1 and clinical parameters were corrected for BMI in multiple regression analyses. The Benjamini-Hochberg method was used to detect significantly altered genes in the microarray of SLC19A1-silenced cells. In primary cell cultures, the fold change within each experiment was calculated to normalize for interindividual variances. All graphs, except for the box plots, represent the mean ± standard deviation. IBM SPSS Statistics, version 22.0, software (IBM Corp., Armonk, NY) was used.
Results
Adipocyte DNA hypermethylation associates with proinflammatory gene expression
To identify epigenetic links to adipocyte inflammation in IR, the global adipocyte DNA methylome and WAT gene expression were compared between obese (n=8) and insulin sensitive nonobese (n = 8) individuals (a subgroup of cohort 1; Supplemental Table 1). In accordance with recent data (7), we confirmed higher methylation of CpGs proximal to protein-encoding genes in obese vs nonobese individuals (Fig. 2A). The genes whose expression correlated with hypermethylated CpGs in obesity were subdivided based on the direction of their expression (i.e., positive or negative association with DNA methylation). A GO analysis revealed that CpG hypermethylation associated positively with the expression of genes in proinflammatory pathways and negatively with genes related to metabolic processes, in particular, lipid metabolism (Fig. 2B and 2C; Supplemental Table 3).
DNA methylation in human adipocytes. (A) Methylation in CpG loci (β value) in proximity to (defined as <1.5 kb upstream to transcription start site, in gene bodies, in 5′- or 3′-untranslated region) protein-encoding genes were compared between nonobese and obese individuals in subcohort 1. Based on data from subcohort 1, GO analyses were performed for genes associated with (B) higher or (C) lower expression in relation to hypermethylation in neighboring CpGs. **P < 0.01.
The 1CC gene SLC19A1 is linked to IR and WAT inflammation
DNA methylation is controlled by the availability of specific metabolites and antecedent precursors (e.g., folates, vitamin B12, choline, and methionine), alongside transcriptional regulation of the enzymes and transporters within the 1CC (summarized in Fig. 1A). To determine whether the expression of 1CC genes (n = 78; Supplemental Table 4) were altered in obese insulin-resistant WAT, we probed transcriptomic data from obese (n = 15) and nonobese (n = 15) subjects (cohort 1). Approximately one-half of the folate and one-third of the methionine cycle genes were altered in the obese state (Fig. 1A and 1B; Supplemental Table 4). Among these, genes involved in the folate cycle were pronouncedly induced during the later stages of human adipogenesis (Fig. 1C; Supplemental Table 5), indicating that this gene set might be relevant for adipocyte function. Seven folate cycle genes (Table 1), altered in both obesity and induced during adipogenesis, were identified, and their association with clinical phenotypes was determined in cohort 2. Of these, SLC19A1 encoding a cell membrane transporter responsible for the uptake of folates (Fig. 1A) was induced approximately ninefold during adipogenesis (Fig. 1C) and displayed the strongest relationship with in vivo insulin sensitivity (BMI corrected) and expression of proinflammatory genes (Table 1). Both mRNA and protein levels were reduced in WAT from obese individuals in cohort 1 (Fig. 1D), and among the latter, SLC19A1 levels were lower in subjects with high vs low homeostatic model assessment IR (Fig. 1E). Similar differences between obese subjects discordant in insulin sensitivity were observed in previously reported data from 39 women (15) (Supplemental Fig. 1A). Moreover, among all the subjects in cohort 1, an inverse relationship was between SLC19A1 WAT expression and circulating high-sensitivity C-reactive protein levels (Supplemental Fig. 1B).
Associations Between Expression of 1CC Genes, Insulin Sensitivity, and Adipose Inflammation
| Gene Identification | KITT Standard β Coefficient | P Value | Statistically Significant BMI-Independent Correlations With 238 GO-Annotated Inflammation Genes (P < 0.01) |
|---|---|---|---|
| SLC19A1 | 0.36 | 0.047 | 81 |
| ALDH1L1 | 0.26 | 0.154 | 44 |
| MTHFD1 | 0.15 | 0.432 | 31 |
| DHFR | 0.05 | 0.781 | 9 |
| GCSH | 0.05 | 0.782 | 6 |
| FPGS | 0.02 | 0.904 | 41 |
| SHMT1 | −0.02 | 0.900 | 35 |
The expression of 1CC genes that was significantly altered in obesity and induced during adipogenesis was compared with in vivo insulin sensitivity (measured using the insulin tolerance test) in cohort 2. Associations were corrected for BMI in a multiple regression analysis, in which each gene and BMI were set as independent regressors. Standardized β coefficients and P values are given. In addition, for each gene, the number of significantly associated genes (P < 0.01) in GO pathways linked to inflammation is given.
Abbreviation: KITT, rate constant for insulin tolerance test.
SLC19A1 expression in WAT is enriched in adipocytes
The cellular expression of SLC19A1 in human WAT was determined by quantitative PCR in paired samples of isolated adipocytes and stroma vascular fraction. In line with the expression during adipogenesis, SLC19A1 was enriched in the adipocyte fraction (Fig. 1F). In cohort 3, SLC19A1 was lower in isolated adipocytes from obese subjects (Fig. 1G). This suggests that the lower SLC19A1 levels observed in obese WAT are primarily due to attenuated expression in adipocytes (and not other cell types).
Reduced SLC19A1 expression induces global DNA hypermethylation and altered gene expression
The functional role of SLC19A1 was assessed by RNA interference in in vitro differentiated human adipocytes. Compared with control cells, siSLC19A1-transfection reduced SLC19A1 expression at both the mRNA (∼75%; Supplemental Fig. 1C) and protein (∼50%; Supplemental Fig. 1D) level without influencing adipogenesis (Supplemental Fig. 1E). Attenuated SLC19A1 levels resulted in altered 1CC metabolism, as confirmed by decreased intracellular folic acid, methionine, SAM levels, and SAM/S-adenosylhomocysteine (SAH) ratio (Fig. 3A). Interestingly, it also increased global DNA methylation (Fig. 3B). The association between DNA hypermethylation (Fig. 2A), proinflammatory pathways (Fig. 2B), and SLC19A1 expression (Table 1) prompted us to search for CpG loci linking SLC19A1 to inflammation. First, we analyzed the SLC19A1-regulated transcriptome in siRNA-transfected cells, which identified 1400 significantly regulated transcripts (Fig. 3C). To select genes regulated by SLC19A1 through altered DNA methylation, this data set was overlapped with the adipocyte DNA methylome and WAT transcriptome data in subcohort 1. The analysis included a selection of genes whose expression correlated with methylation of neighboring CpGs (n = 4509) and were associated with SLC19A1 expression in WAT (n = 3913). Using this approach, 186 genes were identified, of which 101 (Supplemental Table 6) displayed a concordant direction in expression between the in vivo and in vitro data (i.e., if upregulated by siSLC19A1, the mRNA levels were higher in obese subjects and vice versa). A GO analysis of these 101 genes confirmed that those upregulated by SLC19A1 knockdown (n = 73) were enriched for proinflammatory pathways, and those downregulated (n = 28) were primarily involved in lipid metabolism (Fig. 3D; Supplemental Table 7), mirroring the findings in Fig. 2B and 2C.
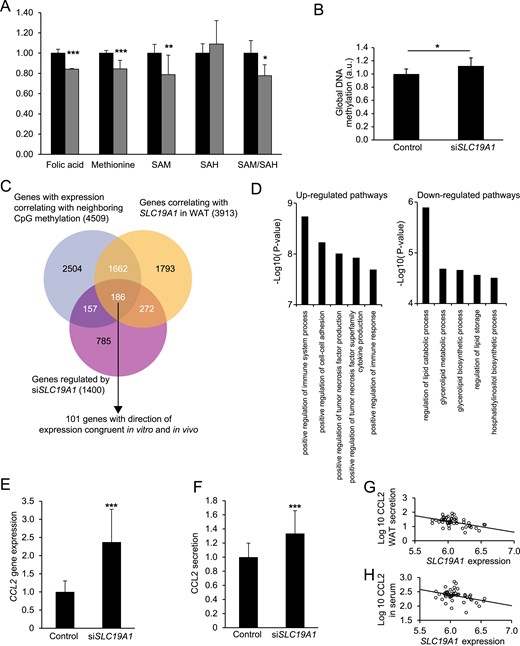
Effects of SLC19A1 silencing in human adipocytes. In vitro differentiated primary adipocytes were transfected with siSLC19A1. This resulted in (A) reduced intracellular folic acid, methionine, SAM levels, and SAM/SAH ratio and (B) an increase in global DNA methylation measured using an ELISA (detailed in Supplemental Table 2). (C) Venn diagram summarizing the bioinformatic approach to identify SLC19A1-regulated genes linked to altered methylation of proximal CpG loci. A total of 186 genes fulfilled the following criteria: regulated in SLC19A1 silenced adipocytes (purple circle), correlated with SLC19A1 expression in WAT (yellow circle; subcohort 1), and had at least one neighboring CpG in which methylation was associated with gene expression (gray circle; subcohort 1). Of these, 101 genes displayed a direction in expression congruent with data obtained in vitro and in vivo. (D) GO analyses of the 101 genes subdivided according to the direction of gene expression in relation to SLC19A1 expression in vitro and in vivo. The top five pathways according to statistical significance are shown; the full list is detailed in Supplemental Table 7. Analyses of (E) mRNA expression and (F) protein secretion confirmed that CCL2 was selectively upregulated in vitro on SLC19A1 silencing. In cohort 2, SLC19A1 expression in subcutaneous WAT was substantially associated with (G) CCL2 secretion (in multiple regression analysis, β coefficient, −0.34 and P = 0.003 after BMI correction) from WAT explants ex vivo and (H) serum CCL2 levels (in multiple regression analysis, β coefficient, −0.27 and P = 0.048 after BMI correction). *P < 0.05, **P < 0.01, ***P < 0.001.
Reduced SLC19A1 expression increases CCL2 transcription through site-specific methylation
To demonstrate that SLC19A1 alters the expression of specific genes through DNA methylation, we searched the genes listed in Supplemental Table 6 for factors with well-established roles in adipocyte/WAT metabolism or inflammation. Reductions in selected metabolic genes (ACACB and LPL) were validated by quantitative PCR (Supplemental Fig. 1F). In contrast, among the top 10 proinflammatory candidates was CCL2, which encodes CCL2, a key factor in WAT inflammation (see the Discussion section). The CCL2 promoter (defined as 1.5 kb upstream of the transcription start site) contained a CpG (cg12698626) that correlated positively with CCL2 expression. A causal link between SLC19A1 and CCL2 expression was suggested in vitro because siSLC19A1 resulted in increased CCL2 mRNA levels (Fig. 3E) and CCL2 secretion (Fig. 3F). These observations were further supported by analyses in cohort 2, which demonstrated a relevant, BMI-independent, negative association between WAT SLC19A1 expression and both ex vivo CCL2 secretion (Fig. 3G) and serum CCL2 levels (Fig. 3H). In comparison, no in vitro effects or in vivo associations were observed for tumor necrosis factor-α or adiponectin (genes that lack CpGs associated with obesity and SLC19A1 expression; data not shown). To test the link between SLC19A1 and CCL2 expression through cg12698626 methylation, pyrosequencing assays were performed in siSLC19A1-treated adipocytes. This confirmed that SLC19A1 silencing increased cg12698626 methylation (Fig. 4A), and the changes in methylation correlated positively with the change in CCL2 expression (Fig. 4B). Moreover, in primary in vitro differentiated adipocytes from various donors, a clear bimodal distribution was found in cg12698626 methylation (Fig. 4C). Cells with highly methylated cg12698626 displayed substantially higher secretion of CCL2 than cells with a low degree of methylation (Fig. 4D). A direct link among SLC19A1, DNA methylation, and CCL2 expression was further demonstrated by transfecting primary human adipocytes with control or siSLC19A1 in the presence of the DNMT inhibitor RG108. This completely abrogated both the increase in cg12698626 methylation and CCL2 expression after SLC19A1 knockdown (Supplemental Fig. 2A and 2B).
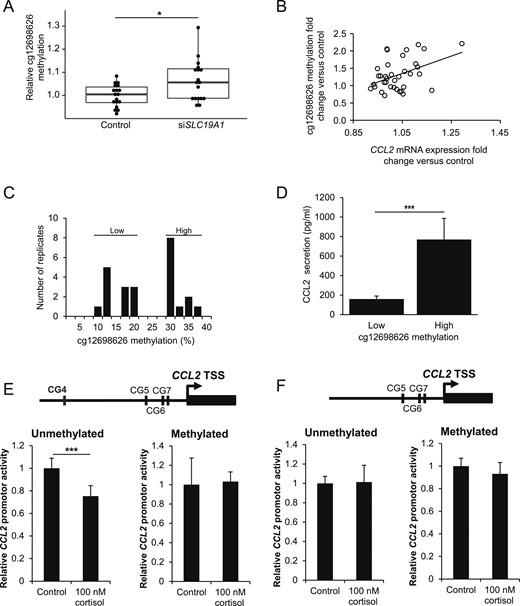
SLC19A1 knockdown induces cg12698626 methylation and CCL2 transcriptional activity. (A) The methylation of cg12698626 increased significantly on SLC19A1 silencing in human adipocytes, and (B) the fold-change in methylation correlated significantly with the fold-change in CCL2 expression (rho = 0.35 and P = 0.037, using Spearman rank correlation). (C) The absolute methylation of cg12698626 in primary in vitro differentiated adipocytes from five donors displayed a bimodal distribution and could be subdivided according to “low” or “high” methylation in the individual replicates. (D) CCL2 secretion from adipocytes shown in C was compared between the groups with high or low cg12698626 methylation. (E) Cortisol-mediated repression of the CCL2 promoter was assessed using a luciferase reporter assay containing cg12698626 (CG4) in the (Left) unmethylated or (Right) methylated state. (F) Similar experiments as in D were performed using constructs in which CG4 was deleted. *P < 0.05, **P < 0.01, ***P < 0.001.
To identify a molecular mechanism explaining how site-specific methylation increases CCL2 expression, we studied the CCL2 promoter and noted that a total of seven CpGs (CG1 to CG7; Supplemental Fig. 2C), of which only cg12698626 (CG4) displayed a strong correlation between the methylation degree (β value) and CCL2 WAT expression (subcohort 1; Supplemental Fig. 2D). Based on publically available ENCODE ChIP-sequencing data, CG4 is situated in a predicted glucocorticoid receptor (GR) binding site (Supplemental Fig. 2C). CCL2 has been reported as a GR target gene in different cell models (16), and, accordingly, cortisol rapidly decreased CCL2 expression in in vitro differentiated adipocytes (Supplemental Fig. 2E). A thermal shift assay was performed to determine whether CG4 methylation status affected the interaction with GR. A purified GR-DNA binding domain displayed a significantly greater dissociation temperature when bound to an unmethylated vs a methylated CG4 locus (Supplemental Fig. 2F), indicating greater binding affinity to the unmethylated sequence. To establish whether CG4 methylation also affected promoter activity, we developed a luciferase reporter assay in which different plasmids containing the CCL2 promoter (with or without CG4) were expressed in adipocytes. In agreement with the results shown in Supplemental Fig. 2E, CCL2 promoter activity was significantly reduced on treatment with cortisol, a repressive effect that was fully abrogated when the promoter was methylated (Fig. 4E). In similar experiments performed with constructs lacking CG4 (Fig. 4F), the repressive effect of cortisol was abolished, independently of DNA methylation status.
Discussion
The present study has identified a mechanism that provides information on the relationship between adipocyte dysfunction and IR. In our previous work, we performed a global analysis of the adipocyte DNA methylome and its relationship to gene expression (7). We focused on genes characterized by DNA hypermethylation in IR and observed a link to a proinflammatory gene signature and reduced expression of metabolic pathways. In a screen for 1CC genes associated with IR and proinflammatory gene expression, SLC19A1 displayed the strongest, BMI-independent, associations. The relationship was also reflected at the systemic level of inflammation (i.e., high-sensitivity C-reactive protein). In human adipocytes, SLC19A1 knockdown resulted in altered intracellular levels of key 1CC metabolites, global DNA hypermethylation, and upregulation of specific proinflammatory genes. Among the latter, methylation at a specific CpG in the CCL2 promoter correlated with gene expression/secretion and affected transcriptional activity. Incubation with a DNMT inhibitor abrogated the increase in cg12698626 methylation and CCL2 expression. This supports a notion that SLC19A1 reduction in human adipocytes promotes an epigenetically regulated inflammatory response (summarized in Fig. 5).
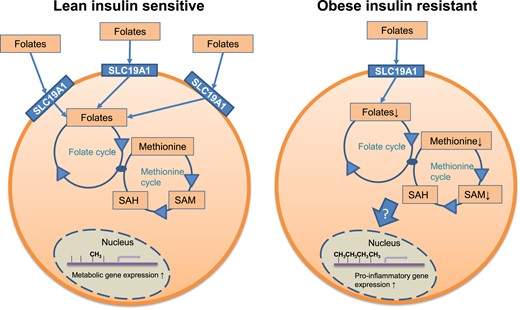
The link among SLC19A1, DNA methylation, and gene expression. Based on the presented data, we propose the following model. (Left) In insulin-sensitive adipocytes), the expression of SLC19A1 and the 1CC pool was balanced. This associates with a normal degree of DNA methylation and gene expression. (Right) In IR adipocytes, the expression of SLC19A1 is reduced, resulting in a perturbed 1CC and reduced SAM levels. Via mechanisms that remain to be elucidated, this results in CpG methylation associated with specific alterations in the expression of proinflammatory (increased) and metabolic (decreased) genes, respectively. The factors attenuating SLC19A1 expression need to be clarified.
SLC19A1 gene knockdown reduced the intracellular levels of folic acid and the SAM/SAH ratio. It might seem counterintuitive that a decrease in methyl donor levels can lead to increased DNA methylation. However, results in several cell models have shown that folate deprivation induces both global (17) and site-specific CpG methylation (18), and similar observations have been reported in rat colon cells in vivo (19). Furthermore, SAH treatment of 3T3-L1 cells (resulting in an ∼25% decrease in the SAM/SAH ratio; i.e., comparable to the effect observed after siSLC19A1), induced site-specific increases in DNA methylation (20). Thus, low folate levels and/or a reduced SAM/SAH ratio might result in DNA hypermethylation. Methylome changes could depend on altered expression/activity of methylation and/or demethylation enzymes, which we did not measure. Nevertheless, we observed no changes in the expression of DNMT1, DNMT3A, DNMT3B, and DNMT3L or demethylation enzymes (TET1, TET2, and TET3) in siSLC19A1-treated adipocytes (data not shown). However, because DNMTs undergo post-translational modifications (e.g., ubiquitination and sumoylation), which regulate their stability and activity (21), it is worth mentioning that several genes involved in ubiquitination were selectively altered after SLC19A1 knockdown (data not shown). In addition, we observed an ∼50% increase in SUMO1 expression (data not shown), which could increase DNMT activity via sumoylational modifications (22). However, the mechanisms explaining the link between decreased folate levels and DNA hypermethylation remain to be elucidated.
DNA hypermethylation correlates with increased inflammation in 3T3-L1 adipocytes (23). Our present studies focused on the causal link between SLC19A1 and CCL2. This chemokine plays a central chemoattractant role in promoting macrophage infiltration into WAT (24) and is directly linked to the development of IR in obesity (25, 26). Mature adipocytes express and secrete substantial amounts of CCL2 (27, 28), suggesting that adipocytes per se might induce WAT inflammation. The importance of altered folate metabolism for CCL2 expression is supported by several clinical observations. Thus, in obese individuals (with IR), CCL2 WAT expression is higher and serum folate levels are lower compared with nonobese subjects (29). Furthermore, genetic variations in the 1CC gene MTHFR associate with increased circulating levels of CCL2 (30). In contrast, a 12-week-long folate supplementation in overweight subjects reduced circulating CCL2 levels and improved insulin sensitivity (31). Although the latter study did not determine gene expression in WAT, we observed a correlation between SLC19A1 and CCL2 WAT expression and CCL2 serum levels. Epigenetic regulation of CCL2 expression has been demonstrated in murine WAT, where adipocyte-specific Dnmt3a overexpression resulted in increased Ccl2 expression and inflammation after high-fat feeding (32). In the present study, SLC19A1 knockdown increased CCL2 protein secretion by ∼30%. This effect size might appear small but was comparable to that induced by micro-RNAs (10), heat shock proteins (33), hypoxia (34), vitamin D (35), NF-κB inhibition (36) or corticosterone (37). Moreover, increased secretion of even modest amounts of CCL2 for long periods can be pathophysiologically relevant. Importantly, we only studied the effects of SLC19A1. Given that several 1CC genes are altered in obese IR WAT, it is plausible that they, together, might have a much stronger effect on inflammation and metabolic health than SLC19A1 dysregulation alone.
That cg12698626 methylation correlated positively with CCL2 expression suggested that it could alter CCL2 promoter activity. This was confirmed by two independent assays demonstrating that methylation attenuated both GR-binding affinity and the repressive effects of cortisol. This suggests that adipocyte cg12698626 methylation increases CCL2 expression by regulating the response to endogenous cortisol. Admittedly, we could not establish the clinical relevance of this effect, and it is possible that additional transcription factors and/or mechanisms link SLC19A1 to altered CCL2 expression. Moreover, because siSLC19A1 affects the expression of several genes, we could not exclude that the effects on CCL2 expression might also depend indirectly on methylation changes in other CpGs. However, it demonstrated that cg12698626 methylation affects CCL2 transcriptional activity. Notably, cg12698626 is not conserved between mice and humans (38). In addition, in contrast to our observations in humans, diet-induced obesity in mice results in CpG hypomethylation near inflammatory genes (38). Altogether, this indicates that WAT inflammation, in particular, CCL2 expression, is regulated through epigenetic mechanism that might only pertain to humans.
We used obesity as a model for IR because WAT inflammation is much more pronounced in obese compared with nonobese individuals, facilitating the detection of specific culprit genes. However, our findings were independent of BMI suggesting that the relationships were not related to body fat mass (at least within the ranges we studied). In comparisons of WAT transcriptomic data from obese individuals discordant for insulin sensitivity, we observed in two independent cohorts that SLC19A1 expression was lower among insulin-resistant obese. This supports our hypothesis that SLC19A1 reduction contributes to IR independently of fat mass. Admittedly, although significant, these differences were small, confirming that additional factors affect IR in obesity. One weakness with the present study was that all the subjects were women. Nevertheless, although men might display more pronounced WAT inflammation than women (39), no data are available suggesting that this process is qualitatively different between sexes.
What attenuates SLC19A1 expression? A possible explanation could be DNA methylation, because adipocytes from obese individuals are hypermethylated in CpGs close to SLC19A1 (data not shown). Studies in blood leukocytes and skeletal muscle have shown that obesity is associated with SLC19A1 CpG hypomethylation (40), indicating that epigenetic regulation of SLC19A1 expression might be tissue specific.
In conclusion, the findings from the present study suggest that adipocyte downregulation of SLC19A1 results in DNA hypermethylation and altered expression of specific inflammatory genes, at least in obese women. This might constitute a mechanism through which fat cells initiate macrophage infiltration and inflammation and thereby promote the development of IR and T2DM.
Abbreviations:
- 1CC
one carbon cycle
- BMI
body mass index
- CCL2
C-C motif chemokine ligand 2
- cDNA
complementary DNA
- DNMT
DNA methyltransferase
- GO
gene ontology
- GR
glucocorticoid receptor
- IR
insulin resistance
- mRNA
messenger RNA
- PCR
polymerase chain reaction
- SAH
S-adenosylhomocysteine
- SAM
S-adenosyl methionine
- siRNA
small interfering RNA
- siSLC19A1
small interfering SLC19A1
- T2DM
type 2 diabetes mellitus
- WAT
white adipose tissue.
Acknowledgments
The authors thank Gaby Åström, Kerstin Wåhlén, and Elisabeth Dungner for excellent technical assistance.
Financial Support: The present study was supported by grants from the Swedish Research Council, the Novo Nordisk Foundation, including the Tripartite Immuno-metabolism Consortium (Grant NNF15CC0018486), the Measurement Science for Advanced Manufacturing Consortium (Grant NNF15SA0018346), Center for Innovative Medicine, Swedish Diabetes Foundation, European Federation for the Study of Diabetes, Stockholm County Council, and the Diabetes Research Program at Karolinska Institutet.
Author Contributions: The study was planned and designed by P.P., H.G., and M.R. P.P., H.G., N.M., L.B., A.C., S.N., A.G., S.T., and J.B. performed the experiments. The data were analyzed and interpreted by P.P., H.G., and M.R. The patient material was collected and analyzed by P.A., M.R., and I.D. The plastic surgery material was provided by P.H. and P.P. M.R. wrote the manuscript, which was commented on and approved by the other authors. M.R. is the guarantor of the work.
Disclosure Summary: The authors have nothing to disclose.
