


Abstract
There are ethnic differences in glucoregulation and prevalence of type 2 diabetes, but studies on the role of genetics in modifying ethnic effects in normoglycemic African-Americans and Caucasians are limited. Therefore, we investigated glucoregulation in normoglycemic African-Americans and Caucasians with or without parental diabetes.
Fifty subjects with parental diabetes (from the Pathobiology of Prediabetes in a Biracial Cohort Study) and 50 subjects without parental diabetes were matched in age, sex, ethnicity, and body mass index (BMI). Subjects underwent a 75-g oral glucose tolerance test (OGTT), physical examination, anthropometry, biochemistries, indirect calorimetry and assessment of body composition, insulin sensitivity by euglycemic clamp (Si-clamp), and β-cell function by Disposition index.
The mean age was 40.5 ± 11.6 years, BMI 28.7 ± 5.9 kg/m2, fasting plasma glucose 90.2 ± 5.9 mg/dL, and 2-hour postglucose 120.0 ± 26.8 mg/dL. Offspring with parental diabetes showed higher glycemic excursion during OGTT–area under the curve–glucose (16,005.6 ± 2324.7 vs 14,973.8 ± 1819.9, P < 0.005), lower Si-clamp (0.132 ± 0.068 vs 0.162 ± 0.081 µmol/kg fat-free mass/min/pmol/L, P < 0.05), and lower Disposition index (8.74 ± 5.72 vs 11.83 ± 7.49, P < 0.05). Compared with lean subjects without parental diabetes, β cell function was lower by ∼30% in lean subjects with parental diabetes, ∼40% in obese subjects without parental diabetes, and ∼50% in obese individuals with parental diabetes (P < 0.0001). African-Americans without parental diabetes had ∼40% lower insulin sensitivity (P < 0.001), twofold higher acute insulin secretion (P < 0.001), but ∼30% lower Disposition index (P < 0.01) compared with Caucasians without parental diabetes. Remarkably, there were no significant differences by ethnicity in these glucoregulatory measures among subjects with parental diabetes.
Offspring with parental diabetes harbor substantial impairments in glucoregulation compared with individuals without parental diabetes. Ethnic disparities in glucoregulation were abrogated by parental diabetes.
Ethnic minority groups are disproportionately affected by type 2 diabetes mellitus (T2DM). Available data from cross-sectional studies indicate that the prevalence rates for diabetes are nearly twofold higher in African-Americans compared with Caucasians (1–4). Furthermore, the prevalence of prediabetes is higher in African-Americans compared with Caucasians (1, 2); the standardized prevalence of prediabetes was more than two times higher in African-Americans in a study that classified glycemic status by hemoglobin A1c (HbA1c) (2). Although cross-sectional surveys show a higher prevalence of diabetes in African-Americans compared with Caucasians, prospective studies have not replicated this observation. For instance, the rate of progression from impaired glucose tolerance to T2DM was similar in the different ethnic groups in the Diabetes Prevention Program, where incident diabetes was ∼10% irrespective of ethnicity (5). Furthermore, normoglycemic African-Americans and Caucasians with parental history of T2DM developed prediabetes at an equal rate of 11% in the Pathobiology of Prediabetes in a Biracial Cohort (POP-ABC) Study (6).
Several studies have reported glucoregulatory differences between African-Americans and Caucasians (7–11). The Insulin Resistance Atherosclerosis Study demonstrated higher degrees of insulin resistance, fasting insulin, and acute insulin response (AIR) to glucose challenge among African-Americans than Caucasians; ethnic differences in insulin secretion and action persisted after adjusting for obesity and behavioral factors (7, 8). Likewise, cross-sectional studies comparing subjects of African ancestry and Caucasians observed a higher degree of insulin resistance in the African descendants (9, 10). Impaired first-phase insulin secretion has been shown to be a major predictor of dysglycemia (12). Compared with subjects without parental diabetes, normoglycemic offspring of African parents with diabetes exhibited subnormal insulin secretory responses (13), whereas normoglycemic first-degree relatives of European patients with T2DM were reported to have intact insulin secretion (14). Transition from normal glucose tolerance to dysglycemia is associated with a decline in insulin sensitivity and secretion (12). Although insulin resistance is present in subjects who develop T2DM, evidence from monogenic diabetes and inherited forms of insulin resistance, such as mutation in the human insulin receptor, suggests that intrinsic genetic variability in β cell function may be the ultimate determinant of progression to T2DM (15). The relative effects of diminished insulin secretion and action on glucoregulation may be more discernable before the development of abnormal glucose tolerance; hence, we have undertaken to study euglycemic subjects. The etiology of ethnic disparity in the prevalence of T2DM remains unclear. Therefore, to explore the ontogeny of ethnic disparities in T2DM, we investigated glucoregulation in normoglycemic African-Americans and Caucasians, with or without parental diabetes.
Materials and Methods
Subjects inclusion criteria
Eligibility criteria included age 18 to 65 years; self-reported non-Hispanic white or non-Hispanic black race/ethnicity status; biological parent(s) with or without T2DM; no personal history of diabetes; normal fasting plasma glucose [<100 mg/dL (5.6 mmol/L)] and 2 hours plasma glucose [<140 mg/dL (7.8 mmol/L)] during a 75-g oral glucose tolerance test (OGTT); and good overall health.
Exclusion criteria
Excluded from participation were subjects with a history of diabetes or use of medications known to alter glucose metabolism or body weight, such as antidiabetic agents, steroids, and hydrochlorothiazide. Also excluded were subjects who engaged in a weight-loss program or have had liposuction or bariatric surgery, pregnant women and women within 12 months postpartum, and individuals hospitalized within 6 weeks of the screening visit.
We recruited 50 subjects without parental history of diabetes who were matched in age, sex, ethnicity, and body mass index (BMI), with 50 participants with a parental history of diabetes in the POP-ABC study. The details of the study design and methods have been previously described (6, 16). Parental history of T2D was ascertained using a questionnaire that obtained information on the number of biological parents with diabetes (6, 16). The study protocol was approved by the Institutional Review Board of the University of Tennessee Health Science Center. All participants gave written, informed consent before participation in the study, which was conducted at the General Clinical Research Center of the University of Tennessee, in accordance with the principles of the Helsinki Declaration.
Study procedure
The methods adopted in this study were patterned after the POP-ABC study (6, 16). In brief, subjects underwent a screening visit, during which time informed consent and a medical history were obtained; a physical examination, which included anthropometry and vital signs, was performed. A standard 75-g OGTT was administered. Blood samples for blood chemistry, including insulin level, lipid profile, HbA1c, and hematology, as well as urine sample for urinalysis and microalbumin/creatinine ratio, were obtained.
Study visit 1
Subjects who fulfilled the inclusion criteria were invited for study visit 1, during which time blood samples for cytokine levels were obtained and health questionnaires were administered. Measurement of total and resting energy expenditure (REE) using indirect calorimetry and intravenous glucose tolerance test (IVGTT) to measure β cell response to glucose infusion was performed.
Study visit 2
Study visit 2 included assessment of body composition using a dual-energy X-ray absorptiometry scan and leptin secretion test, in addition to interval history, anthropometric measurements, and a health questionnaire.
Study visit 3
Study visit 3 involved the performance of an insulin sensitivity test by hyperinsulinemic euglycemic clamp, in addition to interval history and anthropometric measurements.
Participants arrived at the research center after an overnight fast. Study procedures included a structured medical interview and a general physical examination, including measurement of weight, height, waist circumference, and blood pressure (BP) and a standard 75-g OGTT (6, 16). Weight was measured in duplicate on a calibrated balance-beam scale. Standing height was determined in duplicate with a standard stadiometer. The BMI was calculated as the weight in kilograms divided by the height in meters squared. Waist circumference was determined to the nearest 0.1 cm at the midpoint between the highest point of the iliac crest and the lowest costal margin in the midaxillary line, using a Gulick II tape measure (Country Technology). BP was recorded in the seated position, using an automated sphygmomanometer; the mean of two readings was obtained. The OGTT was preceded by written instructions to consume a usual diet with adequate carbohydrates, refrain from strenuous exercise and alcohol consumption for 24 hours, and avoid smoking and consumption of coffee or tea on the morning of the test. The test was performed between 7 and 11 am, after fasting for ∼12 hours: venous blood samples for the measurement of glucose and insulin were obtained before (0 minutes) and at 30 and 120 minutes after ingestion of 75 g flavored glucose (Trutol 75; Custom Laboratories). Lipid profile, HbA1c, and other analytes in fasting plasma specimens were also measured per protocol (6, 16).
Measurement of insulin sensitivity and insulin secretion
Measures of insulin resistance, such as the homeostasis model of insulin resistance (HOMA-IR) (17), Matsuda index (18), and quantitative insulin check index (QUICKI) (19), and measures of insulin secretion, such as HOMA-β cell dysfunction (HOMA-B) (17) and insulinogenic index (20), were derived from glucose and insulin values during OGTT. In addition, clamp index of insulin sensitivity (Si-clamp) was assessed directly using the hyperinsulinemic euglycemic clamp, and insulin secretion was evaluated using frequently sampled IVGTT, as previously described (21). The clamp procedure was performed after an overnight fast, for ∼12 hours. A primed, continuous intravenous infusion of regular insulin (2 mU · kg−1· min−1; 14.4 pmol · kg−1 · min−1) was administered for 180 minutes, and blood glucose concentration was maintained at ∼100 mg/dL (5.6 mmol/L) with a variable rate dextrose (20%) infusion. Arterialized blood specimens for measurement of glucose and insulin levels were obtained every 10 minutes. The rate of total insulin-stimulated glucose disposal was calculated for the last 60 minutes of the insulin infusion and corrected for steady-state plasma insulin levels to derive the Si-clamp (17). Insulin secretion was assessed by the intravenous administration of dextrose (25 g) after an overnight fast. Sampling for glucose and insulin in arterialized blood was performed 30 minutes before and at 2, 3, 4, 5, 7, and 10 minutes after the intravenous dextrose bolus (12, 17). The AIR to intravenous glucose was computed as the mean incremental insulin concentration from 3 to 5 minutes after the dextrose bolus (12, 17). AIR was log transformed to correct for the scatter in insulin secretion. β Cell function was assessed using the Disposition index.
Formulae
HOMA-IR: (fasting plasma glucose × fasting plasma insulin)/405 (17)
HOMA-B: (360 × fasting plasma insulin)/(fasting plasma glucose − 63) (17)
QUICKI: 1/log fasting insulin + log fasting glucose (19)
Matsuda index: 10,000/√(fasting plasma glucose × fasting plasma insulin) × (mean OGTT glucose × mean OGTT insulin) (18)
Insulinogenic index: insulin30 minutes – fasting insulin/glucose30 minutes – fasting glucose (20)
Disposition index: (Si-clamp × AIR)
Biochemical measurements
Plasma glucose was measured with the glucose oxidase method (Yellow Spring Instruments). Plasma insulin was measured immunochemically in our Endocrine Research Laboratory, using commercial enzyme-linked immunosorbent assay kits. HbA1c and fasting plasma lipid profiles were measured in a clinical laboratory.
Statistical analysis
Data are reported as means ± standard deviation, unless otherwise specified. Significance level was set as P < 0.05. Differences in mean values between two continuous variables were analyzed using Student’s t test. Data on insulin sensitivity, insulin secretion, and other metabolic variables were compared using three-way analysis of variance (ANOVA; primary variables: race, sex, and parental history of T2DM), with interaction between race/ethnicity and parental history of T2DM forced into the model, to compare insulin sensitivity, insulin secretion, and other metabolic variables between the two ethnic groups, adjusted for sex. Other two- and three-way interactions were selected using stepwise procedure. Thus, the final results were adjusted for sex and parental history of T2DM, as well as all interactions.
All statistical analyses were performed with the use of SAS statistical software, version 9.3 (SAS Institute).
Results
Study cohort clinical, anthropometric, and laboratory characteristics
We recruited 100 healthy, normoglycemic African-Americans and Caucasians, 50% of whom had parental diabetes; 54% of the subjects were women. The subjects were categorized and analyzed based on the presence or absence of parental T2DM. The cohort was well matched in age, sex, ethnicity, and measures of obesity, including weight, BMI, and waist circumference (P ≥ 0.2). Blood chemistry, including lipid profile and the liver enzymes aspartate transaminase and alanine transaminase, were also compared between the two groups. A urinary microalbumin/creatinine ratio was similar in both groups, as was the total white cell count. Systolic BP was higher in subjects with parental diabetes (125.3 ± 17.2 vs 117.4 ± 11.7, P < 0.01; Table 1).
Clinical, Anthropometric, and Laboratory Characteristics of the Subjects
| No Parental Diabetes (n = 50) | Parental Diabetes (n = 50) | P Value | |
|---|---|---|---|
| Age, y | 39.5 ± 13.2 | 41.1 ± 9.9 | 0.584 |
| Sex, F/M | 27/23 | 27/23 | |
| Ethnicity, AA/C | 25/25 | 25/25 | |
| BMI, kg/m2 | 28.4 ± 6.1 | 29.1 ± 5.8 | 0.565 |
| Weight, kg | 83.5 ± 18.2 | 87.3 ± 20.5 | 0.297 |
| Waist, cm | 92.2 ± 15.0 | 95.8 ± 14.2 | 0.196 |
| Truncal fat mass, kg | 12.1 ± 7.6 | 13.7 ± 5.9 | 0.243 |
| Systolic BP, mmHg | 117.4 ± 11.7 | 125.3 ± 17.2 | 0.007 |
| Diastolic BP, mmHg | 73.4 ± 11.7 | 75.7 ± 17.2 | 0.320 |
| Aspartate transaminase | 22.9 ± 16.7 | 21.1 ± 8.6 | 0.479 |
| Alanine transaminase | 20.5 ± 13.2 | 24.4 ± 18.5 | 0.244 |
| Total cholesterol | 178.3 ± 40.6 | 172.6 ± 33.0 | 0.345 |
| High-density cholesterol | 52.4 ± 12.7 | 49.8 ± 13.8 | 0.264 |
| Low-density cholesterol | 106.8 ± 33.1 | 103.2 ± 27.8 | 0.474 |
| Triglyceride | 95.4 ± 59.9 | 98.3 ± 55.4 | 0.774 |
| Urinary microalbumin/creatinine ratio | 7.3 ± 8.3 | 10.1 ± 10.3 | 0.120 |
| White blood cell | 5.7 ± 1.4 | 5.5 ± 1.5 | 0.487 |
| REE, kcal/FFM | 31.3 ± 7.0 | 29.4 ± 5.5 | 0.137 |
| Respiratory quotient | 0.98 ± 0.10 | 1.07 ± 0.30 | 0.069 |
Abbreviations: AA, African-American; C, Caucasian; F, female; FFM, fat-free mass; M, male; REE, resting energy expenditure.
Energy expenditure
The REE was similar between individuals with parental diabetes and those without [REE kilogram/fat-free mass (FFM) 29.4 ± 5.5 vs 31.3 ± 7.0, P > 0.1], but subjects with parental diabetes appeared to have a tendency toward more fatty acid oxidation compared with the control subjects: respiratory quotient (1.07 ± 0.30 vs 0.98 ± 0.10, P = 0.067).
Glucoregulatory characteristics
Although all subjects were euglycemic, glycemic excursion during OGTT (2 hour postglucose and area under the curve for glucose) was higher in subjects with parental diabetes; furthermore, HbA1c was significantly higher in individuals with parental diabetes, indicating that a higher glycemic burden in offspring of parents with diabetes may be chronic in nature. Subjects with parental diabetes were less insulin sensitive with Si-clamp, which was ∼20% lower than that of offspring of parents without diabetes. Furthermore, other indices of insulin sensitivity, including QUICKI and Matsuda, were higher in the controls as well; HOMA-IR were nearly twofold higher in individuals with parental diabetes (1.85 ± 1.72 vs 0.99 ± 0.89, P < 0.001; Table 2). Compared with subjects without parental diabetes, offspring of parents with diabetes demonstrated diminished insulin action with compensatory augmentation in basal insulin secretion (fasting insulin and HOMA-B were approximately twofold higher in individuals with parental diabetes), but AIR to oral and intravenous glucose challenge was comparable in both groups.
Glucoregulatory Characteristics in Subjects, With or Without Parental Diabetes
| Characteristics | No Parental Diabetes (n = 50) | Parental Diabetes (n = 50) | P Value |
|---|---|---|---|
| HbA1c | 5.36 ± 0.40 | 5.61 ± 0.47 | 0.006 |
| Fasting plasma glucose, mg/dL | 89.5 ± 5.6 | 90.9 ± 6.3 | 0.183 |
| 2 Hours postglucose load, mg/dL | 113.1 ± 19.3 | 126.8 ± 31.7 | 0.005 |
| Area under the curve (glucose) | 14,973.8 ± 1819.9 | 16,005.6 ± 2324.7 | <0.005 |
| HOMA-IR | 0.99 ± 0.89 | 1.85 ± 1.72 | <0.001 |
| QUICKI | 5.53 ± 0.43 | 5.16 ± 0.31 | <0.0001 |
| Matsuda index | 11.63 ± 6.08 | 7.59 ± 5.60 | 0.0003 |
| ISI-clamp, µmol/kg FFM/min/pmol/L | 0.162 ± 0.081 | 0.132 ± 0.068 | 0.034 |
| Fasting insulin, µU/mL | 4.39 ± 3.65 | 8.12 ± 7.34 | 0.004 |
| HOMA-B, % | 59.9 ± 45.2 | 103.8 ± 83.8 | 0.0007 |
| AIR, µU/mL | 88.16 ± 70.94 | 79.96 ± 62.77 | 0.523 |
| DI index, log AIR × ISI | 0.286 ± 0.125 | 0.225 ± 0.114 | 0.012 |
Abbreviations: DI, Disposition index; ISI, insulin sensitivity index; ISI-clamp, Si-clamp.
Effect of parental diabetes and ethnicity on glucoregulation
We applied a three-way ANOVA to investigate the effects of parental diabetes, ethnicity, and sex on glucoregulatory measures. Among subjects without parental diabetes, hepatic insulin sensitivity measured by HOMA-IR was comparable in African-Americans and Caucasians (1.01 ± 0.28 vs 0.95 ± 0.28, P = 0.888; Table 3), but whole-body Si-clamp was significantly lower in African-Americans compared with Caucasians (0.122 ± 0.014 µmol/kg FFM/min/pmol/L vs 0.196 ± 0.014 µmol/kg FFM/min/pmol/L, P = 0.0002; Table 3). Acute insulin secretory response to intravenous glucose challenge was twofold higher in African-Americans compared with Caucasians (120.6 ± 12.5 µU/mL vs 56.2 ± 12.6 µU/mL, P = 0.0005), but insulin secretion corrected for ambient insulin sensitivity (Disposition index) was ∼30% lower in African-Americans vs Caucasians (0.24 ± 0.02 vs 0.32 ± 0.02, P = 0.009; Table 3).
Glucoregulatory Characteristics in African-Americans and Caucasians Adjusted for Sex and Parental History of Diabetes
| Characteristics | No Parental Diabetes | Parental Diabetes | ||||
|---|---|---|---|---|---|---|
| African-American (n = 25) | Caucasian (n = 25) | P Valuea | African-American (n = 25) | Caucasian (n=25) | P Valuea | |
| HbA1c | 5.44 ± 0.09 | 5.29 ± 0.09 | 0.242 | 5.68 ± 0.09 | 5.52 ± 0.09 | 0.229 |
| Fasting plasma glucose, mg/dL | 88.8 ± 1.2 | 90.2 ± 1.2 | 0.423 | 89.6 ± 1.2 | 92.3 ± 1.2 | 0.129 |
| 2 Hours postglucose load, mg/dL | 115.6 ± 5.2 | 109.9 ± 5.3 | 0.442 | 126.8 ± 5.2 | 126.0 ± 5.3 | 0.932 |
| Area under the curve (glucose) | 14,716.4 ± 416.7 | 15,212.0 ± 420.2 | 0.406 | 15,549.3 ± 416.8 | 16,442.6 ± 420.2 | 0.136 |
| HOMA-IR | 1.01 ± 0.28 | 0.95 ± 0.28 | 0.888 | 1.69 ± 0.28 | 2.01 ± 0.28 | 0.419 |
| ISI-clamp, µmol/kg FFM/min/pmol/L | 0.122 ± 0.014 | 0.196 ± 0.014 | 0.0002 | 0.111 ± 0.014 | 0.122 ± 0.014 | 0.079 |
| Fasting insulin, µU/mL | 4.53 ± 1.17 | 4.21 ± 1.18 | 0.847 | 7.51 ± 1.17 | 8.66 ± 1.18 | 0.485 |
| AIR, µU/mL | 120.64 ± 12.54 | 56.22 ± 12.64 | 0.0005 | 95.41 ± 12.54 | 65.06 ± 12.64 | 0.093 |
| DI index, log AIR × ISI | 0.24 ± 0.02 | 0.32 ± 0.02 | 0.009 | 0.20 ± 0.02 | 0.24 ± 0.02 | 0.245 |
P Value from three-way ANOVA (ethnicity, parental history, and sex).
In contrast to the findings mentioned previously in persons without parental diabetes, offspring of parents with T2DM displayed no significant ethnic disparities in insulin sensitivity. African-Americans and Caucasians had statistically similar HOMA-IR (1.69 ± 0.28 vs 2.01 ± 0.28, P = 0.419), as well as whole-body Si-clamp (0.111 ± 0.014 µmol/kg FFM/min/pmol/L vs 0.122 ± 0.014 µmol/kg FFM/min/pmol/L, P = 0.079; Table 3). Likewise, no significant ethnic differences were observed in measures of insulin secretion. The AIR to intravenous glucose challenge was 95.4 ± 12.5 µU/mL in African-Americans and 65.03 ± 12.6 µU/mL in Caucasians (P = 0.093; Table 3). Insulin secretion corrected for ambient insulin sensitivity (Disposition index) was 0.20 ± 0.02 in African-Americans and 0.24 ± 0.02 in Caucasians (P = 0.245; Table 3).
Thus, in contrast to the findings among individuals without parental diabetes, ethnic differences in insulin sensitivity (measured by HOMA-IR and hyperinsulinemic euglycemic clamp) and insulin secretion (measured by IVGTT and Disposition index) were abrogated among offspring of parents with T2DM.
Effect of parental diabetes and obesity on glucoregulation
β Cell function (Disposition index) was significantly higher in subjects without parental diabetes. In a four-way analysis, we compared the Disposition index in the subjects categorized by parental diabetes and obesity. Compared with lean subjects without parental diabetes, β cell function was reduced by ∼30% in lean subjects with parental diabetes, ∼40% in obese subjects without parental diabetes, and ∼50% in obese offspring of parents with diabetes (ANOVA, P < 0.0001; Figs. 1 and 2).
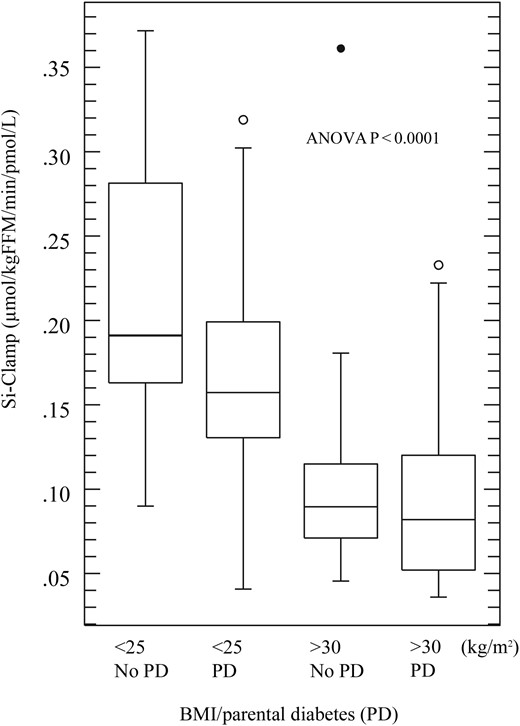
Effect of obesity and parental diabetes (PD) on insulin sensitivity. Box plot showing median and range of insulin sensitivity index displayed in quartiles, circles represent outliers.
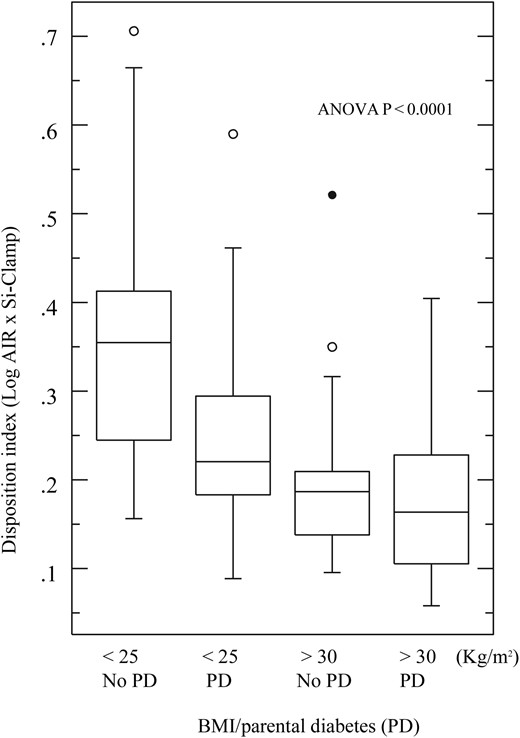
Effect of obesity and parental diabetes on β cell function. Box plot showing median and range of disposition index displayed in quartiles, circles represent outliers.
Discussion
In this study, we have demonstrated that among subjects without parental history of T2DM, African-Americans were less insulin sensitive than Caucasians; this glucoregulatory defect was compensated, in part, by more robust insulin secretion to glucose challenge. Despite a higher AIR, β cell function in African-Americans lagged significantly behind that of Caucasians. These glucoregulatory differences between African-Americans and Caucasians without parental diabetes were absent in African-Americans and Caucasians with parental diabetes. Diminished insulin action with compensatory augmentation in insulin secretion in African-Americans has been reported by several cross-sectional studies (7–11, 22), but the abrogation of the ethnic disparities in glucoregulatory indices by parental T2DM, to our knowledge, has not been reported. Our data in subjects without parental diabetes support several previous studies in children, adolescents, and adults, showing that African-Americans have lower insulin sensitivity than Caucasians and that African-Americans compensate with a greater-than-expected AIR, independent of adiposity (23–26).
The reasons for the higher insulin levels in African-Americans compared with Caucasians have been investigated by several workers. The higher insulin concentration in people of African descent was found to be linked to decreased hepatic insulin extraction and clearance (9, 26). A similar finding of reduced hepatic insulin clearance has been reported in Afro-Caribbean subjects compared with Caucasians in the United Kingdom (27). Furthermore, another study reported that African-American children had a greater first-phase insulin secretory response to glucose compared with Caucasians during a tolbutamide-modified IVGTT (25). In the same report, hepatic insulin extraction was significantly lower in the African-American children than their Caucasian counterparts (25). Thus, the higher plasma insulin levels in African-Americans observed likely resulted from a combination of increased secretion and decreased hepatic clearance.
We have reported that among the POP-ABC cohort, the progression from normoglycemia to prediabetes in African-American and Caucasian offspring of parents with T2DM occurred at a similar rate (6). The absence of racial disparity in incident prediabetes may suggest that in individuals with parental diabetes, ethnicity may not be a major determinant of glucoregulation. Prevailing statistics on T2DM in the United States are notably derived from cross-sectional surveys, which relied on self-report during telephone interviews. In the 2005 to 2006 National Health and Nutrition Examination Survey, subjects who reported being told by a health care professional that they had diabetes were classified as having diagnosed diabetes, and individuals who did not report pre-existing diabetes were evaluated with blood glucose measurements to estimate the prevalence of undiagnosed diabetes and prediabetes (28). With the use of the self-reported information, the prevalence of diagnosed diabetes was 12.8% in African-Americans and 6.6% in Caucasians, but there were no significant ethnic differences in the prevalence of undiagnosed diabetes or prediabetes that relied on blood glucose measurement (28). A similar result was obtained in the 2011 National Diabetes Fact Sheet that also used blood glucose and HbA1c measurements to categorize the subjects (29).
Furthermore, with the use of different measures of insulin secretion and insulin sensitivity, we have demonstrated that normoglycemic offspring of parents with T2DM exhibited diminished insulin action, β cell function, and higher glycemic burden compared with controls without parental diabetes. Although basal or fasting insulin secretion was robust and apparently compensated for insulin resistance in subjects with parental diabetes, following a glucose challenge, insulin secretion failed to compensate completely for ambient insulin resistance, resulting in lower β cell function. We have also shown that obesity conferred a reduction in insulin sensitivity and β cell function and appeared to act in synergy with genetic constitution in individuals with parental diabetes. Compared with lean subjects without parental diabetes, β cell function was reduced by ∼30% in lean subjects with parental diabetes, ∼40% in obese subjects without parental diabetes, and ∼50% in obese offspring of parents with diabetes. Our findings are consistent with previous reports that abnormal insulin action and defective insulin secretion are evident in the early stages of dysglycemia, suggesting that both processes occur simultaneously in the evolution from euglycemia to prediabetes and ultimately, T2DM (12, 30, 31). Additionally, we have demonstrated that these defects are evident in the normoglycemic phase in subjects with genetic constitution for T2DM. Our observation reinforces the role of β cell dysfunction in the pathogenesis of T2DM. Although insulin resistance is present in subjects who develop T2DM, many subjects with insulin resistance do not develop the disease, as they are able to compensate with increased insulin secretion, such that Disposition index remains preserved. Furthermore, evidence from monogenic diabetes and inherited forms of insulin resistance, such as mutation in the human insulin receptor, suggests that an intrinsic genetic defect in β cell function may be the ultimate determinant of progression to T2DM (15).
The impact of family history of diabetes on glucoregulation and other metabolic characteristics has been investigated by other workers (22, 31–33). In the Botnia Study conducted in Finland, first-degree relatives of patients with T2DM showed evidence of abdominal obesity, insulin resistance, and decreased resting metabolic rate compared with control subjects without a family history of T2DM (32). Lower insulin sensitivity was also reported among participants with a family history of T2DM compared with those without a family history in the multicenter European Group of Insulin Resistance study (33). Interestingly, a study comparing obese subjects, with or without a family history of T2DM, did not find significant differences in β cell function (22). The different result obtained in this study may be a result of the methodology used. Given the very strong influence of heredity on incident T2DM, we postulated that glucoregulatory defects would be discernable in normoglycemic offspring of T2DM parents. Diminished insulin action and robust AIR to glucose challenge have been reported in African-Americans, but the attenuation of the ethnic disparities in glucoregulatory indices by parental T2DM, to our knowledge, has not been previously reported.
Our study confirms and extends the previous reports on the impact of family history on insulin action and secretion in two specific ways. First, we enrolled offspring of patients with T2DM who were matched in age, sex, obesity, and ethnicity with subjects without parental diabetes in a case-control fashion. Offspring of parents with T2DM are more likely to have the genetic constitution for T2DM than subjects with a history of diabetes in distant family members. Thus, we have selected a unique population for our study. Furthermore, we have studied a biracial cohort rather than a population comprised of a single ethnicity, as might have been the case in the Botnia study, and we have characterized our study population using rigorous integrated physiology techniques, such as euglycemic clamp and IVGTT.
Obesity attenuated the advantage in β cell function, conferred by the absence of parental diabetes, indicating that environmental factors, such as diet and sedentary lifestyle, which lead to obesity, could over-ride the protective influence of good genetic constitution. This observation is buttressed by a recent study of over 4,000 monozygotic twin pairs with discordant BMIs, which reported that a higher BMI was associated with an over-twofold risk of incident T2DM over 15 years (34). Furthermore, another study that investigated the impact of family history of diabetes on β cell function in obese subjects did not find any differences between those with family history of diabetes and those without (22), suggesting that obesity may have obscured the effect of apparent genetic makeup. The lack of association between glucoregulatory parameters and family history of diabetes in that study is most likely a result of the confounding effect of obesity, which we eliminated in our study by matching subjects and controls for obesity. Offspring of patients with diabetes had higher glycemic burden compared with control subjects; 2 hours postglucose load and area under the curve–glucose during OGTT and HbA1c were elevated, suggesting that the elevation in blood glucose level is chronic in nature, even though the subjects had remained normoglycemic. We have investigated glucoregulation in a well-matched cohort of subjects, with or without parental diabetes, using detailed integrated physiology techniques to interrogate the relevant systems. Although our sample is relatively small, it has allowed us to reach reasonable conclusions in our cohort. However, we are unable to evaluate age of onset of the glucoregulatory defects; whether these defects are present at birth or become manifest as the individuals grow older is best determined by a longitudinal study in a cohort that is younger than our population.
Conclusion
Ethnic disparities in glucoregulation are abrogated by parental history of T2DM; this may explain the absence of a higher incident T2DM and prediabetes in longitudinal studies. Compared with subjects without parental diabetes, normoglycemic offspring of diabetic parents exhibited diminished insulin action and β cell function and a higher glycemic burden during OGTT. Obesity was also associated with reduced insulin action and β cell function in normoglycemic subjects. These alterations represent the earliest glucoregulatory defect in the evolution of dysglycemia in high-risk individuals.
Abbreviations:
- AIR
acute insulin response
- ANOVA
analysis of variance
- BMI
body mass index
- BP
blood pressure
- FFM
fat-free mass
- HbA1c
hemoglobin A1c
- HOMA-B
homeostasis model assessment for β cell dysfunction
- HOMA-IR
homeostasis model assessment for insulin resistance
- IVGTT
intravenous glucose tolerance test
- OGTT
oral glucose tolerance test
- POP-ABC
Pathobiology of Prediabetes in a Biracial Cohort Study
- QUICKI
quantitative insulin check index
- REE
resting energy expenditure
- Si-clamp
clamp index of insulin sensitivity
- T2DM
type 2 diabetes mellitus.
Acknowledgments
We are indebted to the participants who volunteered for this study.
Financial Support: This study was supported by Grants R01 DK067269, R01 DK067269-04S1, and MO1 RR00211 from the US National Institutes of Health; Grant 7-07-MN-13 from the American Diabetes Association; and the State of Tennessee Clinical Research Center fund (University of Tennessee Health Science Center Clinical Research Center Grant E070166010).
Author Contributions: S.D.-J. was the principal investigator, designed the study, and reviewed and revised the manuscript. E.N. did the data collection, drafting, and revision of the manuscript. I.O. completed the data collection and reviewed and revised the manuscript. J.W. did the statistical analysis and reviewed and revised the manuscript.
Disclosure Summary: The funding sources had no role in the design and execution of the study or the analysis and publication of the data obtained. The authors have nothing to disclose.
References
Centers for Disease Control and Prevention. National diabetes statistics report, 2017: estimates of diabetes and its burden in the United States. Available at: https://www.cdc.gov/diabetes/pdfs/data/statistics/national-diabetes-statistics-report.pdf. Accessed 20 July 2017.
Centers for Disease Control and Prevention. National health and nutrition examination survey. Available at: www.cdc.gov/nchs/about/major/nhanes/nhanes2005-2006/nhanes05_06.htm. Accessed 3 January 2014.
Centers for Disease Control and Prevention. National diabetes fact sheet. Diagnosed and undiagnosed diabetes in the United States, all ages, 2010. Available at: https://www.cdc.gov/diabetes/pubs/pdf/ndfs_2011.pdf. Accessed 19 February 2014.
